May 31st, 2020 by Roy W. Spencer, Ph. D.
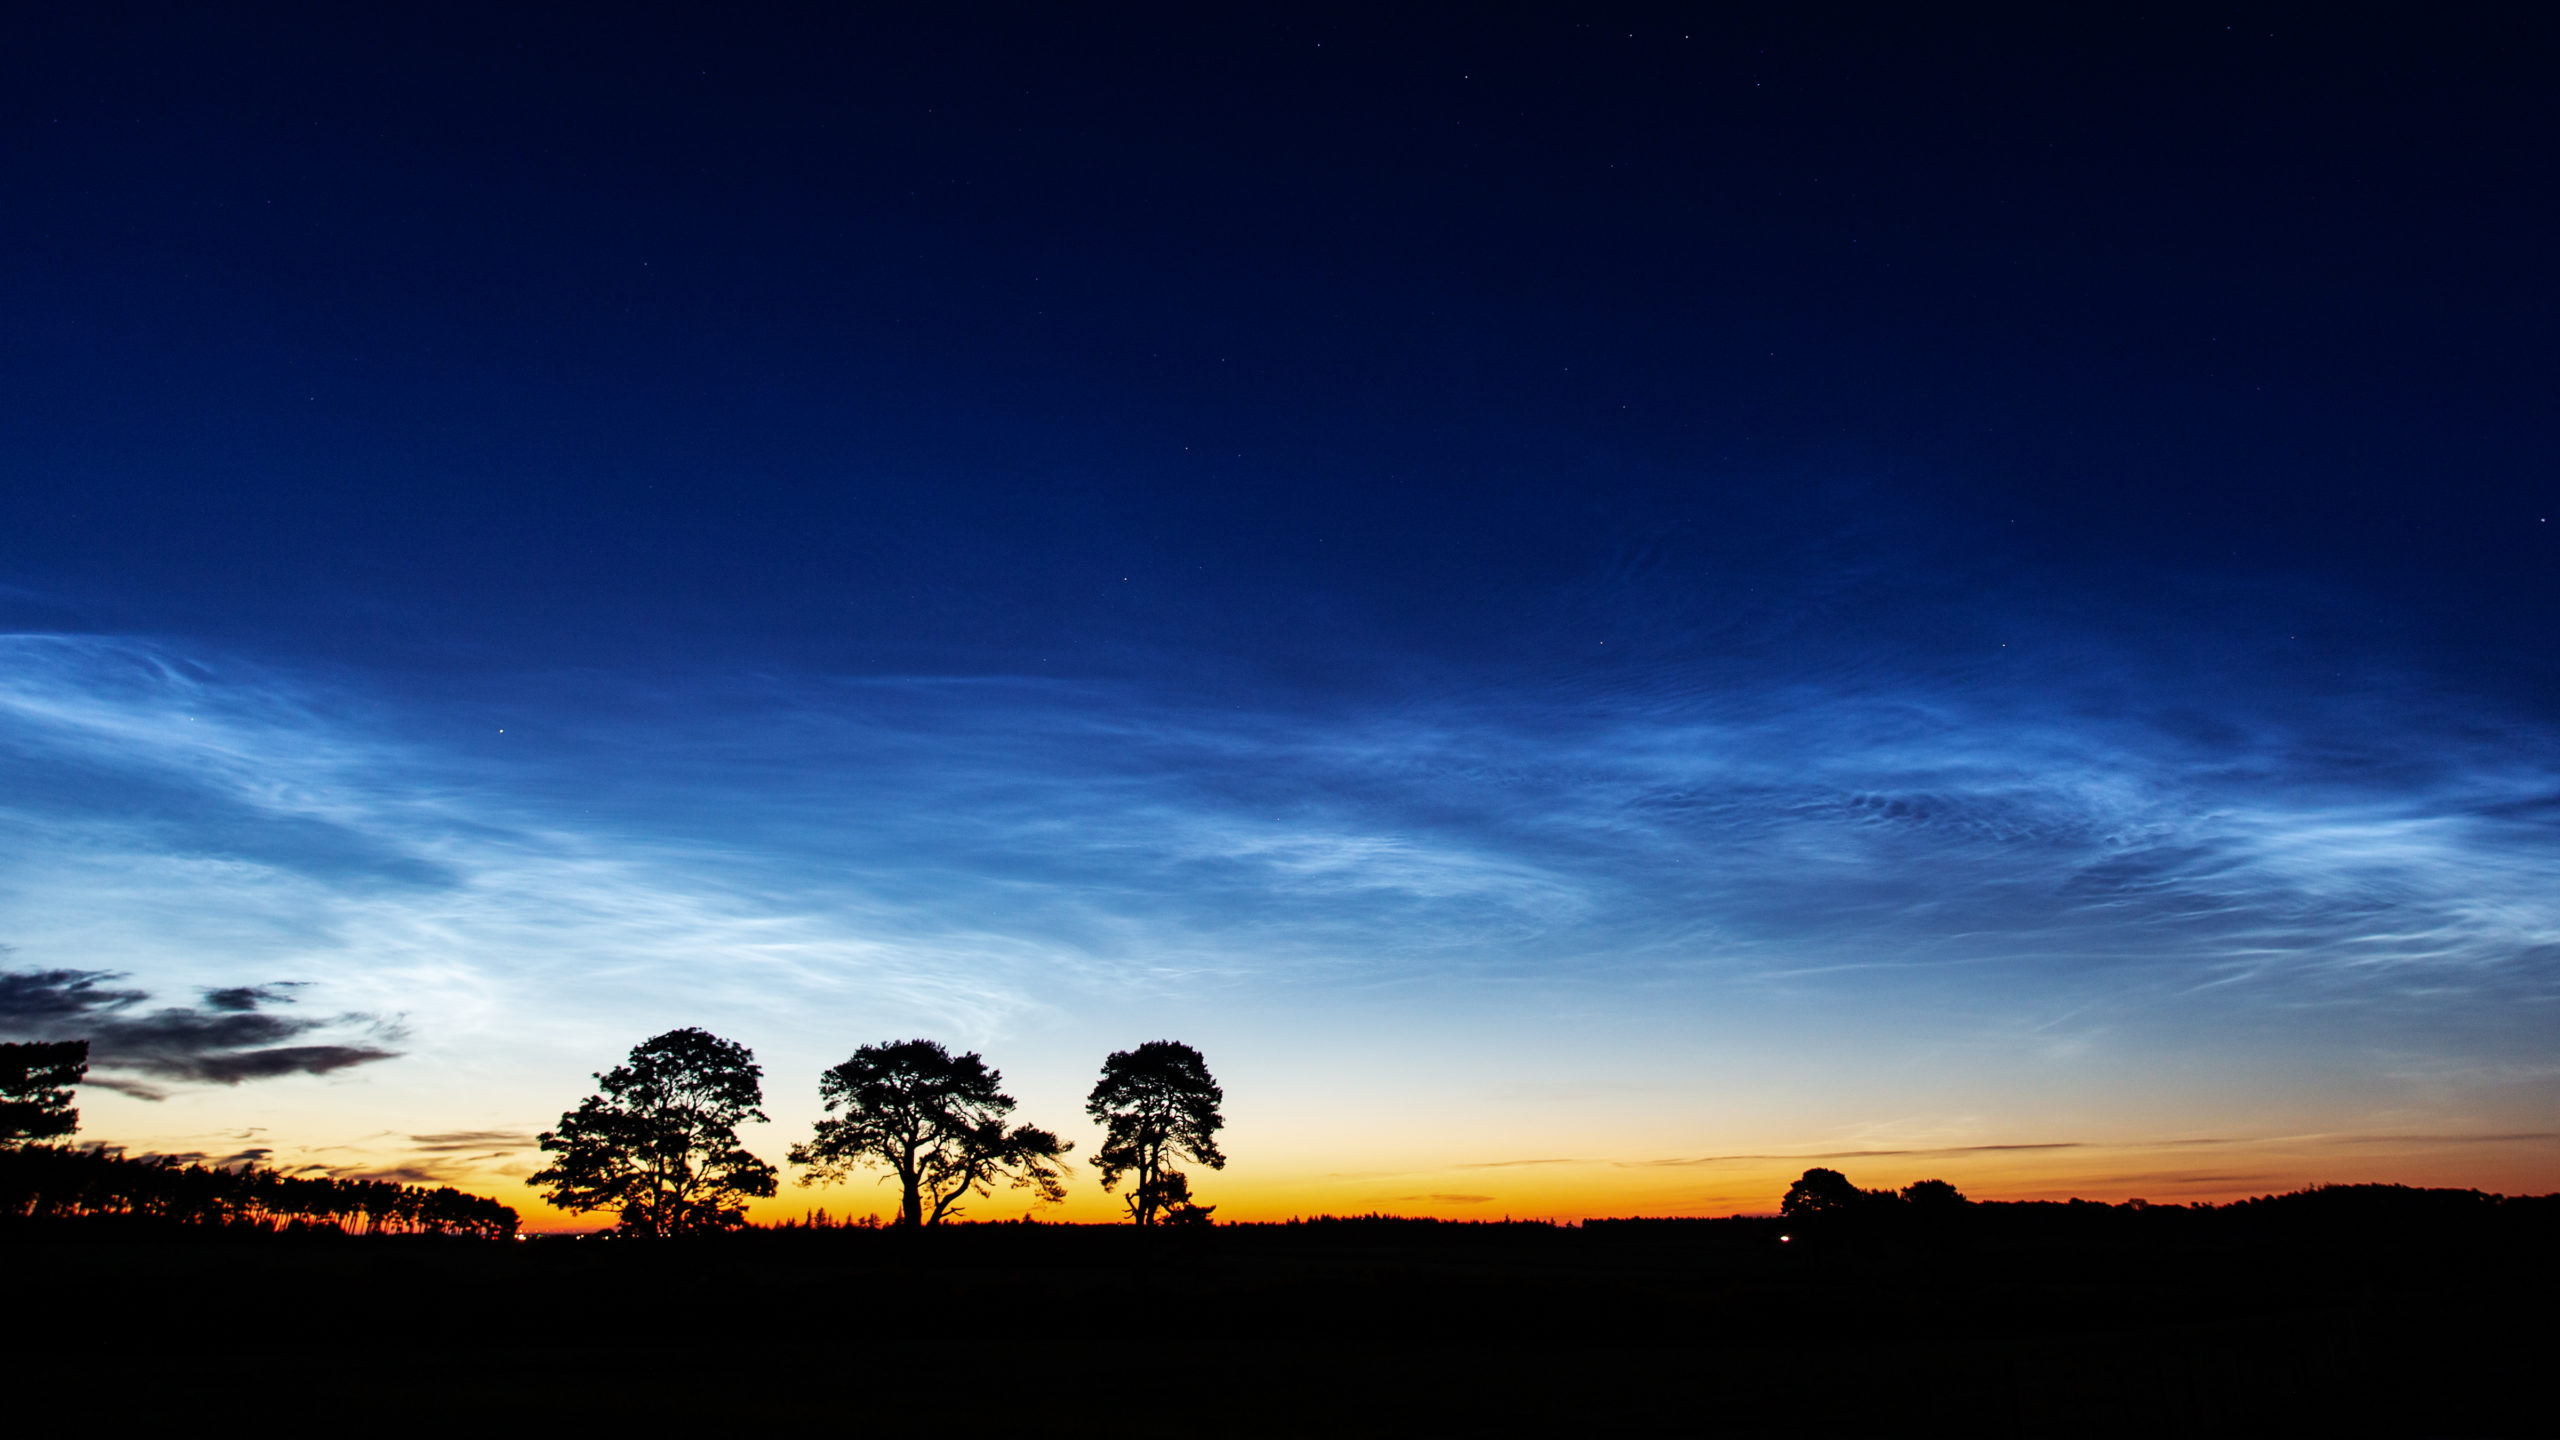
Noctilucent clouds (NLCs) are often visible in the extreme upper atmosphere (80-85 km altitude) well after sunset in the late spring and summer at high northern latitudes. They form from ice condensing on meteoric dust at extremely cold temperatures (below 150 Kelvin or -190 deg. F). The cold temperatures are due to adiabatic cooling from dynamic uplift combined with little ozone to absorb the sun’s ultraviolet radiation.

Noctilucent clouds on May 31, 2020 (Alan Tough, Scotland)
With current solar minimum conditions reducing solar heating by ultraviolet radiation, and slowly increasing CO2 in the atmosphere causing enhanced infrared cooling to outer space, record low temperature are occurring. This has extended the southernmost viewing opportunity for NLCs from the usual ~60 deg. N latitude to as low as 35N latitude last year, with NLC sightings near Los Angeles and Las Vegas in 2019.
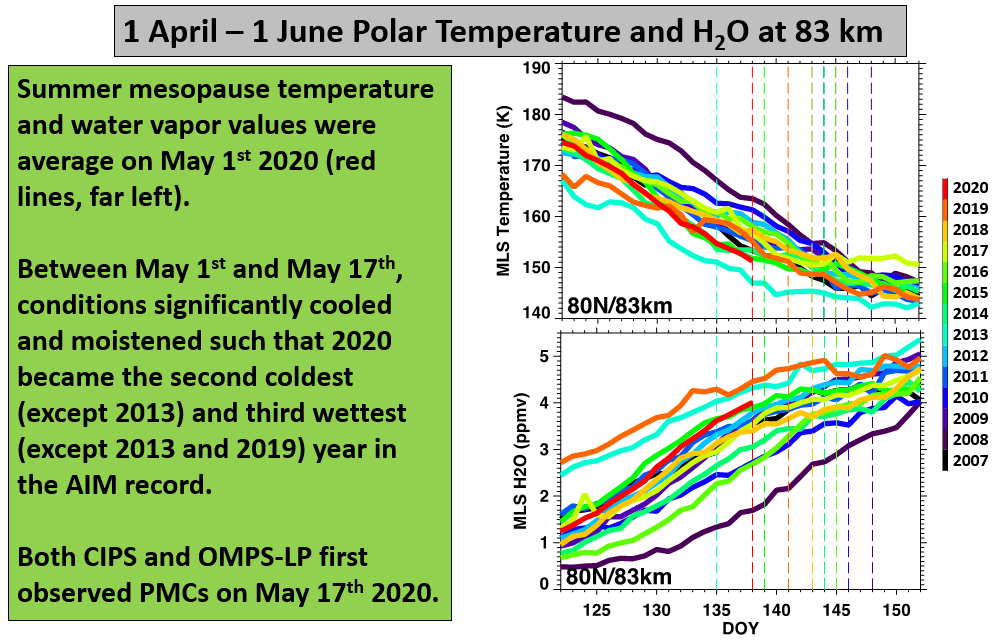
This recent article by Dr. Tony Phillips suggested that 2020 is shaping up to be another good NLC viewing season. An earlier article by Tony included this nice plot of April-May temperatures at 80 N latitude from this year compared to previous years, showing the general cooling trend during the current solar minimum conditions.

Data plot courtesy of Dr. Lynn Harvey, U. of Colorado.
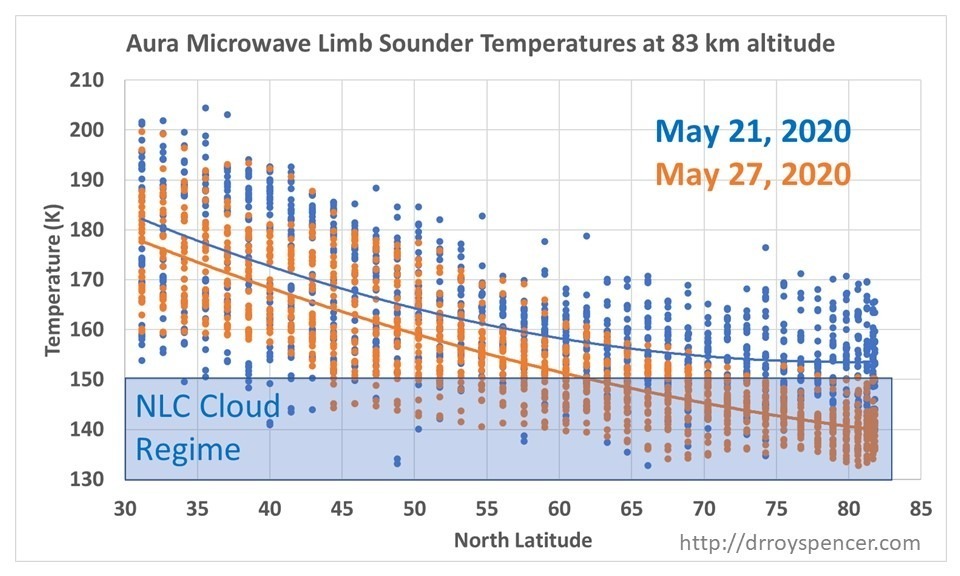
We downloaded some more recent Aura satellite Microwave Limb Sounder data, and plotted it as a function of latitude. Note how fast temperatures dropped in only 6 days… 1-2 deg. C per day depending upon latitude.

Upper mesospheric temperatures at 83 km altitude on two different days in May, 2020 as a function of latitude. Lines are 2nd order polynomial fits to the data, providing average temperatures as a function of latitude.
The 141 K average temperature on May 27 (Day 148) at 80N latitude appears to be a new record low if we compare it to the data in the previous plot by Dr. Harvey.
I will try to keep track of these temperatures as the NLC season progresses in the coming weeks. So far, NLC sightings have been mostly in northern Europe and the UK.
Question: if the meso is cooling, will this affect the altitude of lower cloud formation? Or do we know?
So, a fun ‘science question’ on notilucent clouds. Why do they appear ‘blue-whitish’ rather than red-whitish if they only appear after the Sun has set? Hint, even wiki gives a (patyly) correct physics answer. They missed differential humidity and its blue light scattering causing reddish troposphere sunsets.
Another similar ephemera is rainbows, finally partly explained using prisms by Newton‘s decomposition of white light Into colors. (The rest is how water droplets mimic prisms.) Even wiki has a decent rainbow physics explanation.
Stuff we all need to ‘sorta’ know since many climate scientists probably don’t. Climate science is by definition eclectic, so offers many easy credibility challenges to many ‘narrow but deep’ climate scientists. Example: when do polar bears do ~80% of their annual feeding. Hint, seal whelping season, which IS NOT on summer ice.) Hence the comment.
Or, in summary, an expert is someone who knows more and more about less and less until (Sort of the Calculus limit theorem) he/she knows everything about nothing.
Last year I saw them at 50°N in Germany, but they must have been to see much farther in the south following the horizon line of my view, but it was in July 24.
Looking west
“May 2020 becomes the sunniest calendar month on record
It has been the sunniest Spring on record for the UK and all the home nations and the driest May on record in England.
626 hours of bright sunshine were recorded in Spring 2020 for the UK and have exceeded the previous high (555 hours, set in 1948) by over 70 hours. Spring 2020 also exceeds the sunshine amount for most summer seasons, with only three summers being sunnier (1976, 1995, and 1989).
The figure for England is even higher. Spring 2020 recorded 696 hours of sunshine, exceeding the previous record set of 594.3 hours”
https://www.metoffice.gov.uk/about-us/press-office/news/weather-and-climate/2020/2020-spring-and-may-stats
90%+ fall in airline traffic, absence of condensation trails seeding clouds formation?
It would seem very like that a portion of the increase in sunshine would be due to the drop in air traffic.
Wind patterns might also be a factor. It is interesting to listen to Joe Bastardi explain weather, comparing year to year, and what is happening to cause specific regional changes. Joe’s data would also enable comparisons to other regions of the world to determine comparative amounts.
On a different subject, was there a sun spot observed in May? I see the monthly sunspot total for the month of May, 2020 is 0.2 at this site.
Everyone ignored the disappearing sunspot phenomena. Sunspot groups once had a lifetime of around 22 days so…
.. due to the rotational period of the sun, it was not odd to see a sunspot group twice. Now, sunspot groups have a lifetime of few days.
This month there was a dozen or so new sunspot groups, the problem is now it is not possible to see the sunspot group visually.
We ‘see’ the sunspot group by looking at sunspot’s magnetic field’s effect on an ion of Fe. So what the disappearing sunspot observation shows, is the sun is still producing sunspot groups however the magnetic field strength of the coils of each sunspot group is weakening.
… so that the sunspot group is getting torn apart by turbulence on the surface of the sun, in a few days, rather than in 22 days.
And in sunny Queensland…
https://www.brisbanetimes.com.au/national/queensland/saturday-was-queensland-s-coldest-ever-may-day-20200525-p54wax.html
https://watchers.news/2020/05/25/brisbane-sees-coldest-may-day-in-nearly-a-century-as-record-cold-snap-hits-much-of-queensland/
Mmm. Brrrr, yes that Saturday really dragged down the Autumn average.
http://www.bom.gov.au/jsp/awap/temp/index.jsp?colour=colour&time=latest&step=0&map=meandecile&period=3month&area=nat
Germany in May was 1.2k below average. Flowering started two to three weeks belated.
PS
Since weeks, night temps below 0°C
https://wobleibtdieglobaleerwa
wobleibtdieglobaleerwaermung.files.wordpress.com/2020/05/wdrvideotexttminbodennrw02062020bodenfrost-e1591087916635.jpg?w=720&h=448
And in Norway, still record snow:
correction first link
last try
No idea, what happend before
We’re under one of the main transatlantic flight paths, we often see contrails that spread out hundreds of metres either side of the actual flight path, so it is quite likely the lack of aeroplanes is reducing the quantity of cloud formation. To some extent it is counter-intuitive as I expected the solar minimum to result in a weakening in the Earth’s magnetic fielt, which in turn would have allowed in more cosmic rays to seed clouds, but that didn’t happen or isn’t noticeable.
Never gave it much thought before about how much meteor dust winds up in the upper atmosphere, so asked a search engine for some estimates…but now I know it isn’t just all dead skin posing as dust in my house. Apparently, taking a magnet to your roof/eavestroughs will show up some minor magnetic meteor dust that slowly falls to earth. Estimates are not conclusive and vary so hard to know if it is significant.
“Estimates vary of how much cosmic dust and meteorites enter Earth’s atmosphere each day, but range anywhere from 5 to 300 metric tons, with estimates made from satellite data and extrapolations of meteorite falls” That’s every day, so over vast time scales, it must slowly add up but still insignificant in the scheme of things.
“Every year, the Earth is hit by about 6100 meteors large enough to reach the ground, or about 17 every day, research has revealed” Of course, probably no one really knows, and there other ‘informed’ estimates, some higher and some lower.
Which brings up other questions as to how much friction heat is produced from falling meteor(ites)/dusting through the atmosphere from burning up, and how this manifests in any changes to things in the upper atmosphere. Or do periodic and predictable meteor showers have any significant affect on longer term weather/climate from insolation changes? Everything has some accumulated effect, but is it significant? Perhaps the reflection of insolation near the top of the atmosphere has a much greater effect than the kinetic energy being released from slowing down these miniature projectiles, if much. The Noctilucent clouds are interesting, and I always thought they must be very high altitude since have seen these many times in the northern summer after midnight when it is a crystal clear atmosphere in the semi twilight in the northern latitudes north of the 49th parallel.
Actual TCI
“2020 is shaping up to be another good NLC viewing season”
That’s great. Thanks.
More about nlc
https://tambonthongchai.com/2018/07/17/noctilucentclouds/
Why record cold at 80 N latitude, 83 km altitude?
What about global surface(under greenhouse “layers”)?
And why you don’t say Temperatures are increasing under greenhouse layers while upper atmosphere and the Sun cool down
What ‘greenhouse layers’ are you referring to?
I say in low areas of the Atmosphere, where Greenhouse effect acts we, are experiencing warming
No matter upper layers of the Atmosphere are cooling cause reduced Sun Activity
It’s the ultimate proof for Greenhouse induced Global Warming
Your new here aren’t you. We don’t talk about warming.
And not about Australian averages 😀
Only in models, not in reality.
In models and in thermometers
We can measure the warming indeed
And there it is
Provide some sources…
The source that we’re warming up is in the thermometers
The same with the upper atmosphere cooling
It’s you who have to provide counter evidence
You are partially correct Miki, but it is measuring the UHI (Urban Heat Island) that is registering higher temperatures. But that really has nothing to do with CO2, other than all this concrete and asphalt was aided and abetted by ‘carbon’ based fuels. There is no doubt that billions of people are going to experience higher urban temperatures, but it isn’t the entire globe radically warming up, but the larger urban areas are indeed increasing in temps, some by multiple degrees. Nothing to do with the minuscule radiative warming from CO2, but albedo and thermal retention of heating large physical massive heat retaining product like millions of tons of concrete and asphalt that radically warm cities, especially at night. This will exist whether we burn fossil fuels or not. Let’s be intellectually honest.
Urban Heat Island noise is removed from adjusted data
We now know since long ago, cities put fake warming in thermometers that must be removed
Mmm, reality.
https://tinyurl.com/y99e3gwd
@Loydo
Mmm, reality.
Really ?
Urban Heat Island noise is removed from adjusted data
We now know since long ago, cities put fake warming in thermometers that must be removed
And you are sure it’s done correctly, if done ?
If you habe a look at the DTR (diurnal temperatur range), you see:
Source
An index for UHI
Mean minimum temperature is leading the Temperature rise
That means…
It’s not the Sun which warms through increased irradiance at daytime
Are Greenhouse Gases which retain heat, that made the difference at night
Miki June 2, 2020 at 6:47 am
“Adjusted Data…”
I think this is the whole point is this period of time now known as the Adjustocene! Dishonest science, as we see from the hockey sthick crowd. Who are the gatekeepers of truth? With this hyper senstitized political atmosphere we now live in, many people are starting to see the agenda of what is really going, which has nothing to do with climate. And if it was about climate, we would have to realize that both moderate rising temps and moderately rising CO2 levels are the best thing that ever happened to humanity.
You might argue that all our social ills are blamed on this population increase that is due to a benign climate and fossil fuel use, but arguing the climate change meme is a non starter to a lot people now, and I expect even less people in the future, as we see real problems with multiple black swan events unfolding before our eyes in 3 months, and none of it to do with weather or climate. The only thing now holding up this house of cards is a dishonest media and dishonest academia living off the welfare of climate study grants that all say the world is ending due to climate change. Oh, and dishonest politicians looking for another reason to tax to get themselves reelected. Hopefully the climate charade is over soon. We need a vaccination for this stupidity too.
You know, that you will be the very first one to find the ultimaive proof for greenhouse induced warming, by humans 😀
Than tell me, why, starting around May, CO2 is decreasing (starting photosynthesis) and the tempertures are rising 😀
Temperatures are rising because CO2 is rising
That doesn’t mean that for a while Carbon cycle can’t put extra CO2 in plants
Past years, May also saw a decrease in Atmospheric CO2
But because is a decrease from lower levels, this year is warmer
Never mind May….Miki presented the graph going back to 1870 and in particular there is that roughly 1940 to 1980 period when temp went down slightly while CO2 went up…what’s up with that? Miki?
The 1950-1980 “cooling trend” is something well understood
It’s because mass industrialization used dirty coal which have Sulfur particles that reflect sunlight
And there’s also people who present a fake cooling trend using unadjusted data that doesn’t take into account old thermometers where highly sensitive to Solar Irradiance, among many other factors
@Miki
The 1950-1980 “cooling trend” is something well understood
It’s because mass industrialization used dirty coal which have Sulfur particles that reflect sunlight
You are not well informed:
Cooling by aerosols weaker and less uncertain
Where have you done your Master in Climate change ?
Aerosol emissions may not cool the planet as much as we thought
It may not have so much cooling effects
But REAL GRAPHS show a tiny decrease in the 1950s in comparison with 1940
Just browse ‘World Temperatures 20th century” to look real graphs
And what these “real graphs” tell about the reasons ?
Noone says it doesn’t warm, the question is still unchanged: why ?
AGW, human induced warming, is a presumption, and only possible, if water vapor, the main greenhouse gas is a positive feedback, like and only in climate models, but the measured reality says, it’s a negative feedback.
Negative Feedback From H2O
Water vapour feedback is simply written into climate models as parameters?
Only doubling CO2 lets increase temps about 1k, not more. not less.
Scribd…
Really?😒😒😒
Scribd is not a scientific journal for the love of God
And that guy says the stupid “theory” that if we increase Greenhouse Gases it would grow exponentially forever
Evidence for Negative Water Feedback
About Clive Best
Five Reasons Why Water Vapor Feedback Might Not Be Positive
Water vapor feedback: evaporation
@Miki
Are Greenhouse Gases which retain heat, that made the difference at night
Same source as before:
or (2) the observed warming in a considerable portion of the Northern Hemisphere landmass is significantly affected by factors unrelated to an enhanced anthropogenically‐induced greenhouse effect.
Because the subject are NLC, not more, not less.
Seems to be very simple, not for you ?? :d
I know what’s the subject of the post
I just pointed out that Cooling in the upper atmosphere while sharp warming downhere
Proves “official” Anthropogenic Global Warming Theory is right
The one has nothing to do with the other, you are far of topic, that’s all.
And, btw, nothing is proven, not by your comments, not by any scientist, it’s nothing more than wishfull thinking 😀
Miki, could we see your graph of “dirty coal” burning producing sulfur? Also, could you expand on your claim about the alleged “old” thermometers whose data was not adjusted? 1.3 C rise in 170 years is not exactly alarming – is it? There is no proof that CO2 much less man made CO2 is causing any warming….and I’m sure you agree with Mikey Mann that we must average the temps to one figure for the entire earth so those cold upper atmosphere temps matter too, no? On the subject of meteorite dust….I would think that the Greenland ice cores and ocean bottom cores should be interesting on that subject.
There’s not a graph of sulfur causing 1950-80 cooling.
The old anadjusted data is something some deniers have used to put higher Temperatures in the past
This guy loves to live more in the little iceage, should he change his domicil to Sibiria 😀
No idea of what clown menageri he broked out. 😀
No paper, no links, no proofs but thinks knowing the truth 😀
Miki, there is no “sharp warming”. No adjectives please – it doesn’t help. If you are willing to factor out urban heat islands you should agree to factoring out El Nino’s as they have nothing to do with CO2 or other GHG’s. When you do, there is fundamentally no atmospheric warming since 1997.
Generally speaking we see about warming is positive including a large drop in fuel needed to heat homes in the N Hemisphere. Regarding the short contributions about about “how things work” you may not get far in consultation on this website because here accumulate far better informed members of the public than you will find on say, PBS or NYT or Fox blogs.
There is no “official” AGW theory. It is widely disputed why, how and where the atmosphere warms. If you do not know that, you can hang around here are read a lot more. You are most welcome. There are some very well informed people contributing regularly. Bad-mouthing Scribd and therefore all publications there, is tribalism. Be prepared to read widely and find the truth yourself. You will discover soon enough why the Earth is about to go into a cold period, the consequences of which will be terrible, while advocates of warming try to explain why humans are causing it with GHG’s. Yes, the situation is really that bad, that foolish.
El Niño may be natural
But it’s a heat transfer from an ocean… Already heated up by global warming.
Obviously, it may be difficult to keep warming speedily right after 1998, Because you have to start counting Temp growth from an unusually warm year
But you should compare from the mid 1990s, and noticing the 2000s are far warmer.
The heat may came in 1998, but after that year, it never went away
Oceans heat source is the sun, and earth heat source is the sun and oceans and it’s circulations.
You may tell us, what’s cooling the water und La Niña conditions, or, otherwise, why while La Niña the ocean doesn’t heat up, as CO2 is always present ?
I am at the 50th parallel, and have noticed these clouds starting at around 2300 local CDT, white area extending from about 280 – 290 degrees through to 340 – 350.
Now I know.
The only way water vapor can cross the stratopause and enter the mesosphere? There is no known mechanism. Not in the quanties needed to form clouds of any type. And we image the presence of water vapor all year in the mesosphere, but it varies. And here is the interesting part, it varies in conformity with Dr Louis Frank’s (university of Iowa) observation that the small comet flux constantly entering the upper atmosphere diminishes near the end of the calendar year. Around 20,000 small comets enter the atmosphere every day. He imaged the comets passing through the ionosphere over fifteen years with multiple spacecraft imaging systems.
Thirty five years ago, everyone asked Frank, “where’s the water then on the moon?”. Now we know there is water on the moon. There are water ice mountains on Ceres and Pluto. There is water on the surface of Mercury. Not traces of water, substantial water in craters shaded from the sun.
There is water on most of Jupiter’s and Saturn’s moons. There is apparently water ice on Nix, Pluto’s moon, which is 49 km long.
I challenge anyone to explain how the water vapor in noctilucent clouds gets into the mesosphere.
The solar system has a comet flux that all the orbits of planetary objects constantly pass through.
“I challenge anyone to explain how the water vapor in noctilucent clouds gets into the mesosphere.”
I thought you answered your own question when you mention that we are also being constantly bombarded by nano comets (ice) of various size? Which would make sense where the water vapor then comes from in the mesosphere, as the nano comets debris obviously melts instantly, forming water vapor at high altitude and then sticks to the nearest bit of meteor dust and freezes. Probably a left over feature of the original supernova that formed our present day solar system for both the left over meteors and nano comets that are still orbiting the new Sun.
William Abbot: “I challenge anyone to explain how the water vapor in noctilucent clouds gets into the mesosphere”
WR: Interesting question. The content of water vapor rises very quickly (graphic Dr. Lynn Harvey). Anyone who has an answer?
“I challenge anyone to explain how the water vapor in noctilucent clouds gets into the mesosphere.”
“Abstract. A space shuttle launch deposits 700 tonnes of water in the atmosphere. Some of this water is released into the upper mesosphere and lower thermosphere where it may be directly detected by a limb sounding satellite instrument. We report measurements of water vapour plumes from shuttle launches made by the Microwave Limb Sounder (MLS) on the Aura satellite. Approximately 50%–65% of shuttle launches are detected by MLS. The signal appears at a similar level across the upper 10km of the MLS limb scan, suggesting that the bulk of the observed water is above the top of the scan. Only a small fraction at best of smaller launches (Ariane 5, Proton) are detected. We conclude that the sensitivity of MLS is only just great enough to detect a shuttle sized launch, but that a suitably designed instrument of the same general type could detect the exhausts from a large proportion of heavy-lift launches.”
https://www.atmos-meas-tech.net/4/89/2011/amt-4-89-2011.pdf
STUDY FINDS SPACE SHUTTLE EXHAUST CREATES NIGHT-SHINING CLOUDS
“Exhaust from the main engines of NASA’s space shuttle, which is about 97 percent water vapor, can travel to the Arctic in the Earth’s thermosphere where it forms ice to create some of the Earth’s highest clouds that literally shine at night, according to a new study led by the Naval Research Laboratory and jointly funded by NASA and the Office of Naval Research”
https://www.nasa.gov/centers/goddard/news/topstory/2003/0522shuttleshine.html
The scientific observation of Noctilucent clouds predates the space-age by one hundred years.
Willian Abbott ,
I never said rocket launches are the cause of all Noctilucent clouds events. If you scroll down a bit more you will see what the cause has been for ever, I like one of Walter Lewin’s
sayings ” If it wasn’t for electricity we wouldn’t be here” . cheers
William Abbott June 1, 2020 at 4:28 pm
I challenge anyone to explain how the water vapor in noctilucent clouds gets into the mesosphere.
It’s due to the oxidation of methane.
No. Not enough molecule interaction in the mesosphere. There isn’t much there. We call it the ignoramusphere because it is hard to study. How do you probe the mesosphere and study it? Right now we don’t. There isn’t much methane in the atmosphere, period. To have it oxidizing in the mesosphere at the rate necessary to create that much transitory water vapor is extremely improbable. Molecules don’t regularly bump into each other in the mesosphere. It ain’t outer space, but its getting close.
There is too much water vapor in the mesosphere. There is not enough methane, nor a plausible mechanism for it oxidation in the mesosphere to account for the persistent volume observed.
WATER VAPOR MEASURMENTS IN THE MESOSPHERE MAUNA LOA OVER SOLAR CYCLE 23
https://agupubs.onlinelibrary.wiley.com/doi/full/10.1029/2009JD012504
also – “It’s due to the oxidation of methane” is not even an attempted explanation. It’s an assertion.
“Water vapor enters the middle atmosphere primarily by vertical transport through the tropical tropopause layer (TTL) [e.g., Holton et al., 1995; Fueglistaler et al., 2009]. The low temperatures inside this layer cause a strong reduction of the water vapor concentration by freeze-drying and subsequent sedimentation of ice particles. In the stratosphere the water vapor concentration increases with altitude. This increase is due to the production of water vapor by the oxidation of methane. This production outweighs the main sink process of water vapor in the stratosphere, i.e., the reaction with O( D). With increasing altitude the destruction of water vapor by photodissociation becomes increasingly important. Above about 70 km the photodissociation is primarily caused by solar Lyman-a radiation [Brasseur and Solomon, 1998]. The balance between these production and loss processes can be found roughly in the upper stratosphere/lower mesosphere region, consequently resulting in a water vapor maximum at those altitudes. In the mesosphere, the water vapor concentration decreases gen- erally with altitude, since additional production processes are usually missing [Brasseur and Solomon, 1998].”
JOURNAL OF GEOPHYSICAL RESEARCH, VOL. 114, D10304, doi:10.1029/2008JD011462, 2009
and slowly increasing CO2 in the atmosphere causing enhanced infrared cooling to outer space, record low temperature are occurring.
As rare as the atmosphere at 80km height, is this article admitting that CO2 near the top of atmosphere causes cooling by increasing IR radiation to space.
Despite assertions to the contrary, sunlight contains some IR. This IR component of direct sunlight is attenuated by upper atmosphere CO2, with the result that increasing CO2 is slightly reducing solar radiation. No water vapour is present in the exosphere-mesosphere, so in this region the thermal effect (cooling) of CO2 is uncomplicated by water vapour interactions.
Phil Salmon , What sort of effect do you think this has on the climate???
“Humans have long been shaping Earth’s landscape, but now scientists know we can shape our near-space environment as well. A certain type of communications — very low frequency, or VLF, radio communications — have been found to interact with particles in space, affecting how and where they move. At times, these interactions can create a barrier around Earth against natural high energy particle radiation in space. These results, part of a comprehensive paper on human-induced space weather, ”
https://www.nasa.gov/feature/goddard/2017/nasas-van-allen-probes-spot-man-made-barrier-shrouding-earth
It’s all created by the global electric circuit.
“The theory for electrical effects on scavenging of aerosols in clouds is reviewed, with several microphysical processes having consequences for contact ice nucleation; effects on droplet size distributions; precipitation and cloud lifetimes. There are several pathways for resulting macroscopic cloud changes that affect atmospheric circulation; including enhanced ice production and precipitation from clouds in cyclonic storms, with latent heat release affecting cyclone vorticity; and cloud cover changes in layer clouds that affect the atmospheric radiation balance. These macroscopic consequences of global circuit variability affecting aerosols–cloud interactions provide explanations for the many observations of short term and long term changes in clouds and climate that correlate with measured or inferred Jz and cosmic ray flux changes due to external or internal forcing, and lead to predictions of additional effects.”
https://iopscience.iop.org/article/10.1088/0034-4885/71/6/066801/pdf
file:///C:/Users/User/Downloads/Charged_aerosols_and_electrical_structure_of_the_p.pdf
Sorry mod for the bad link, here’s the correction. Free to download the full PDF.
“An examination of our rocket probe measurements during overhead noctilucent cloud (NLC) and polar mesosphere summer echo (PMSE) conditions has revealed a number of aerosol-related layering effects on the region’s electrical structure.”
https://www.researchgate.net/publication/4706724_Charged_aerosols_and_electrical_structure_of_the_polar_summer_mesopause_region
Interesting material @jmorpuss, haven’t had the chance to read it in detail yet but it should be no surprise that the increase in cosmic ray events (e.g. Muon showers) associated with the solar minimum has a non-negligible effect on the atmosphere’s electrical environment. Of course, such processes are very difficult to investigate in a laboratory environment which the climate change scaremongers argue proves the negative. This also allows them to substitute alternative theories (also very difficult to investigate empirically) to support their narrative.