
Guest zero-point-zero by David Middleton
Offshore oil and gas rigs leak more greenhouse gas than expected
John Sullivan, Office of Engineering Communications
Aug. 15, 2019 9:49 a.m.A survey of offshore installations extracting oil and natural gas in the North Sea revealed far more leakage of methane, a powerful greenhouse gas, than currently estimated by the British government, according to a research team led by scientists from Princeton University.
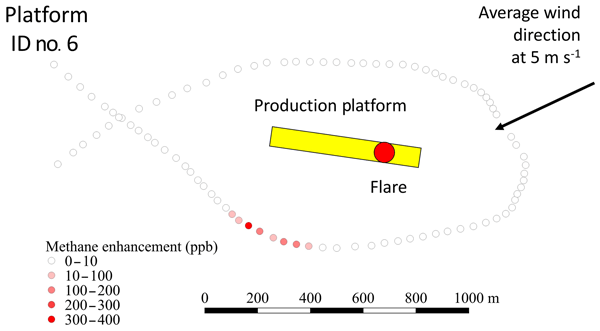
Using a laser-based instrument mounted on small fishing boats, the researchers estimated methane emissions from eight North Sea production platforms off the coasts of England and Scotland. Contrary to current expectations, they found that all the sampled offshore installations leaked even when they were not conducting operations expected to cause methane emissions. On average, methane leakage occurring during normal operations more than doubles each installations’ reported emissions to the U.K.’s National Atmospheric Emission Inventory.
In an article published Aug. 2 in the journal Atmospheric Chemistry and Physics, the researchers noted that previously reported leakage from operating oil and gas platforms appear low: 0.13% of production by U.K. government estimates. However, the researchers found that an additional 0.19% occurred during normal operations. For the U.K., this additional 0.19% corresponds to an additional 330,000 cars on the road (an increase of 1% in registered U.K. vehicles), the researchers said.
[…]
Princeton University
Firstly, production platforms are not rigs.
Secondly, the bass-ackwards world of climate “science” must be the only field in which 97% is a YUGE number if it’s SkepSci bloggers agreeing with one another, 99.7% isn’t mentioned when it’s ice not melted or gas not leaked and the difference between 0.03% and 0.04% is a climate crisis.
Thirdly, slightly more than the Dean Wormer line is still the Dean Wormer line.
Using a laser-based instrument mounted on small fishing boats, [a stack of assumptions and a Gaussian plume model] the researchers estimated methane emissions from eight North Sea production platforms off the coasts of England and Scotland.
Before I shoot this down like an F-14 Tomcat vs. a Mitsubishi A6M Type 0, lets accept their conclusions.
| Methane Leaked | Methane Not Leaked | |
| Official Estimate | 0.1% | 99.9% |
| Plus Plume Model | 0.2% | 99.8% |
| New Total | 0.3% | 99.7% |
The article is not pay-walled.
Key passage:
3.4 Uncertainties/shortcomings of Gaussian plume modelling
A range of scenarios were run using the Gaussian plume model to estimate uncertainty in average CH4 emissions resulting from UGGA instrument precision, thermometer precision, varying wind speed, assessment of the PGSC, and uncertainty in distance between the emission source and the detector. Uncertainty in the UGGA and the thermometer has little effect on the average emission estimate (Sect. S3). The largest variability in wind speed was recorded during measurement of platform no. 3 on 6 July 2017 at 4.4±0.6 m s−1(Sect. S1); using this variability in wind speed in the Gaussian plume model results in an uncertainty in average emission of ±12 %. Uncertainty in estimating the distance between the emission source and the detector results in an uncertainty in average emissions of ±8 %. The Gaussian plume model has the greatest response to the uncertainty in estimating the PGSC, resulting in an uncertainty of ±41 %. We estimate the overall uncertainty in the average CH4 emission, calculated as the root of the sum of the individual uncertainties squared, to be ±45 %.
As mentioned in Sect. 2.5, the uniform vertical mixing assumption made in the Gaussian plume model may not hold here as the data we collected provide no information on vertical mixing. However, the Gaussian plume model only assumes a constant vertical mixing rate between the source and the detector. In most cases this distance is relatively short and unlikely to significantly affect the calculation of emissions. In future experiments, the vertical mixing rate could be calculated by measuring the vertical gradient of wind speeds to make an accurate thermodynamic profile.
Atmos. Chem. Phys.
| Plume Model (+/-) | 45% | |
| Methane Leaked | Methane Not Leaked | |
| Plume Model Min | 0.2% | 99.8% |
| Plume Model Max | 0.5% | 99.5% |
Technically, in this particular case, the Zero shot itself down: 0.2% +/−45%…
What do 0.1% and 0.3% have in common? They both round down to…
Reference
Riddick, S. N. , Mauzerall, D. L., Celia, M., Harris, N. R. P., Allen, G., Pitt, J., Staunton-Sykes, J., Forster, G. L, Kang, M., Lowry, D., Nisbet, E. G. and Manning, A. J. “Methane emissions from oil and gas platforms in the North Sea”. Atmospheric Chemistry and Physics. 19, 9787–9796, 2019
https://doi.org/10.5194/acp-19-9787-2019
Climate Scientists who commit knowing fraud are like a perp who points a gun at a cop…
Some day they are the windshield, some day they are the bug. But the windshield always wins.
Blue Lives Mater.
matter… grrr…ratta….
To be fair and pedantic, for it to be fraud they would have the skills to *know* that stating a 0.2% effect with a +/-45 % error bound is a mistake
argues facts not in evidence 😛 🙂
Misuse of %, the two ‘%’ are not comparable. Should be 56 g s−1 (±45%).
And there’s no rounding down to zero!
Or (better) 56 ± 25 gs-1, or (even better) 0.2 ± 0.1 %.
There is a politically motivated war on every form of energy from fossil fuels.
Like statistics, any can be proved using a model.
I will keep an eye out for the BBC coverage of this. No doubt it will be along the lines of
“Methane emissions double that claimed by the oil companies “
They do realise Methane is about 1.8 ppm at the moment……..
Meaning 999,600 Parts Per Million in the atmosphere are NOT CO2 or Methane?
A bunch of foreigners snooping around the UK installations that help to keep us warm at night , maintain the national industries and help the fragile financial situation- no doubt with the motive of closing them down.
Not sure that I am happy with that.
So the official estimate for CH4 loss (based on inventory data) is 0.13% and this measurement (from just 8 platforms) is 0.2+-0.1 % (where the uncertainty is almost certainly under-estimated).
I. e. no significant difference.
These researchers would have been better off calibrating their gaussian plume model to the known methane releases from each of the rigs.
Why didn’t they do this?
Must have had an agenda.
They did this in small boats being tossed about on the North Sea..LOL! Perhaps they inadvertently pointed the laser at someone’s bottom for a moment when the boat pitched about and got a false positive. Your percentage calculation says it all David, putting another Sky is falling story on the fail list.
Or maybe some of this…
Enlightenment please, what the feck are UGCA & PGSC? I’ve googled them but the results aren’t particularly scientific! Thank you.
UGGA: Ultraportable Greenhouse Gas Analyser
For example, this.
PGSC: Pasquill–Gifford Stability Class
Related to how stable a molecule is, from Wikipedia.
My goodness, they must have blown half their grant budget on time inventing these new-fangled terminologies! 🙁
Validation of model in field …. oh none
It’s junk built on guesses, estimates and fudge factors.
0.0? Gee, its coming from somewhere. Just check this hockey stick out, my favourite so far.
Releasing 1 kg of CH4 into the atmosphere is about equivalent to releasing 25 kg of CO2
The 800,000 yr methane hockey stick is just as fraudulent as the 800,000 yr carbon dioxide hockey stick.
The recent rise in methane is not from oil & gas production.
https://www.climate.gov/news-features/understanding-climate/after-2000-era-plateau-global-methane-levels-hitting-new-highs
You and your “fraudulent”. There is nothing fraudulent about it.
fraud
/frɔːd/
noun
wrongful or criminal deception intended to result in financial or personal gain.
There may be some accuracy issues but calling it fraud is bs. Are you disputing methane levels where roughly 500ppb for the last million years? No I didn’t think so. Are you disputing the concentration has spiked to a current 1850? No I didn’t think so.
Leave it out.
I posted some alternative facts to your “meh, nothing to see” schtick. CH4 is 20% of anthropogenic GHG. You are correct in that PROPORTION of fossil fuel sourced methane is reducing but overall it is still increasing.
Like the rest of our trolls, when finding himself behind in an argument (a very familiar place for Loydo) he immediately tries to change the terms of the debate.
There may be some accuracy issues but calling it fraud is bs.
ROFL
The title of this post:
Offshore Oil and Gas Production Leaks Virtually No Methane
Implicitly agrees that the release of methane is a problem. It isn’t a problem.
Loydo says “Releasing 1 kg of CH4 into the atmosphere is about equivalent to releasing 25 kg of CO2”
What Loydo doesn’t say is how much methane will run up global temperature. Why? Because it’s essentially nothing.
Every hand wringing post about how much methane is or isn’t being released by human activity needs to address the overriding fact that the greenhouse effect of methane is nearly and effectively nothing. Arguing about how much or how little is released is an exercise of no more importance than determining the number of angels that can dance on the head of a pin.
WUWT authors like Dave Middleton should stop taking the bait.
If there are actual leaks, it’s a problem because the system is designed to not leak methane. It’s an insignificant problem because it’s a vanishingly small volume of methane. It’s a potentially significant problem if government imposes fees or fines based on leakage estimates.
News flash: The greenhouse effect is real. CO2 and CH4 are greenhouse gases. At least half of the rise in atmospheric CO2 and CH4 over the past 150 years is due to the combustion of fossil fuels. All other factors held equal, an increase in the atmospheric concentration of greenhouse gases will elevate the average temperature of the bulk atmosphere. There is absolutely no scientific debate about this… Not from Judith Curry, John Christy, Roy Spencer, Richard Lindzen or WUWT…
https://wattsupwiththat.com/policy/
The scientific debate revolves around climate sensitivity to GHG’s, the benefits vs costs of warmer temperatures and higher atmospheric and oceanic CO2 concentrations and various mitigation and/or adaptation policies.
David Middleton August 21, 2019 at 5:26 am
If there are actual leaks, it’s a problem because the system is designed to not leak methane.
That’s an economic problem, not an environmental one
It’s an insignificant problem because it’s a vanishingly small volume of methane.
BINGO!
it’s a potentially significant problem if government imposes fees or fines based on leakage estimates.
And government needs to justify the fine based on how much CH4 will run up temperature not the bogus Global Warming Potential number that is quoted so frequently.
“WUWT authors like Dave Middleton should stop taking the bait.”
News flash: The greenhouse effect is real. CO2 and CH4 are greenhouse gases.
Yes, and how much is CH4 going to run up temperature?
At least half of the rise in atmospheric CO2 and CH4 over the past 150 years is due to the combustion of fossil fuels.
CH4 is a product of combustion??
All other factors held equal, an increase in the atmospheric concentration of greenhouse gases will elevate the average temperature of the bulk atmosphere. There is absolutely no scientific debate about this… Not from Judith Curry, John Christy, Roy Spencer, Richard Lindzen or WUWT…
And Methane’s contribution to global temperature rise is how much. You haven’t said so far.
Certain topics are not welcome here and comments concerning them will be deleted. This includes topics on religion, discussions of barycentrism, astrology, aliens, bigfoot, chemtrails, 911 Truthers, Obama’s Birth Certificate, HAARP, UFO’s, Electric Universe, mysticism, and other topics not directly related to the thread.
–
For the same reasons as the absurd topics listed above, references to the “Slaying the Sky Dragon” Book and subsequent group “Principia Scientific” which have the misguided idea that the greenhouse effect doesn’t exist, and have elevated that idea into active zealotry, WUWT is a “Slayer Free Zone”. There are other blogs which will discuss this topic, take that commentary there.
I am not a nut job. If you think CH4 significantly contributes to Global Warming please say how much in degrees Celsius, Fahrenheit or Kelvin & give your sources. I say it’s insignificantly small and does not warrant government fines and any discussion of the gas should point out that’s it’s insignificant.
https://wattsupwiththat.com/policy/
I haven’t violated WUWT policy
The scientific debate revolves around climate sensitivity to GHG’s,
Excellent point, and the climate sensitivity of methane (CH4) is exactly what? I say it’s about 0.04K If you think it’s significantly greater than that say how much and a link would be great because I have never found one.
the benefits vs costs of warmer temperatures and higher atmospheric and oceanic CO2 concentrations and various mitigation and/or adaptation policies.
The adaptation cost due to the greenhouse effect of methane would be nothing.
And thanks for your reply I appreciate it.
My overall point is Climate Change now being renamed the Climate Crisis is not a problem. Every rebuttal to the alarmists needs to address the fact that there isn’t a problem. Coming up with ways to reduce CO2 or Methane or sequester it or God forbid a geoengineering scheme is counter productive to winning this propaganda war.
Government regulations and penalties don’t go away because you or I don’t think they’re justified.
Methane is an insignificant contributor to the recent warming. Government efforts to eliminate methane leaks in natural gas production and distribution are potentially catastrophic problems. Pointing out the insignificance of the problem is critical to restraining government.
I wasn’t suggesting that you violated any policies. I was simply pointing out that WUWT doesn’t dismiss the greenhouse effect as some skeptics do.
David Middleton August 21, 2019 at 7:21 am
Government regulations and penalties don’t go away because you or I don’t think they’re justified.
. . .
Pointing out the insignificance of the problem is critical to restraining government.
That’s right and it takes the President and a majority of the Congress. And to get there they need to understand that:
Methane is an insignificant contributor to the recent warming.
Loydo alluded to the Global Warming Potential numbers. That load of B.S. needs to be exposed for the misdirection and flim flam that it is.
“At least half of the rise in atmospheric CO2 and CH4 over the past 150 years is due to the combustion of fossil fuels.”
Sorry, but that has never been established empirically. Estimates, assumptions, scientifically incompetent direct comparisons of proxies and atmospheric measurements, circular logic and pre-conceived conclusions do not constitute empirical “evidence.” Unless they have MEASURED all “sources” and “sinks” of atmospheric CO2, our “contribution” of 4% of (total, but estimated) “emissions” can be safely said to be the “share” we have contributed to any CHANGE as well.
“All other factors held equal, an increase in the atmospheric concentration of greenhouse gases will elevate the average temperature of the bulk atmosphere.”
Yes, a nice “hypothetical” situation. However, here in the real world, “all other factors” are most assuredly NOT “held equal,” the feedbacks are net negative, and the ACTUAL, as opposed to hypothetical, effect of increasing CO2 is essentially NIL, as can be seen by the paleoclimate record which shows ZERO empirical support for the notion that CO2 drives the Earth’s temperature, and plenty of empirical support for the notion that the Earth’s temperature is UNAFFECTED by atmospheric CO2 levels.
“At least half of the rise in atmospheric CO2 and CH4 over the past 150 years is due to the combustion of fossil fuels. All other factors held equal, an increase in the atmospheric concentration of greenhouse gases will elevate the average temperature of the bulk atmosphere. There is absolutely no scientific debate about this… Not from Judith Curry, John Christy, Roy Spencer, Richard Lindzen or WUWT…”
I don’t disagree with that.
But we should emphasize that “all other factors” are not held equal, and there is a possiblity, after feedbacks are incorporated into the equation, that there may be no net heat increase in the atmosphere due to CO2. I don’t think the scientists you mention above, or yourself would disagree with that. But the Congress critters don’t know that and they should know that before they inadvertenly give legitimacy to the unsubstatiated CAGW speculation.
If we don’t emphasize this, then congress critters will think the CAGW speculation may have some justification and they will seek to fix it. We should show them that this science is NOT settled and it is premature to fix the CO2 “problem”. We and they need much more information before we go disrupting our entire economy and spending countless Trillions of dollars..
When Republicans are asked about their position on CAGW, they should say, “the science is not settled”. They will receive howls of outrage from the Left for saying this, but the problem for the Left is they cannot prove the science *is* settled. Then, we can get into a good, public debate. 🙂
Tom Abbott – August 21, 2019 at 8:20 am
It is of MLO that there is at least “one (1) factor that must be held equal” …….. and the aforenoted “may be no net heat increase” sounds like a CYA to me.
Anyway, the aforesaid “must be held equal” claim is as follows, to wit:
If one is going to claim that …… the average bi-yearly decrease of 6 ppm in atmospheric CO2 (as per the Keeling Curve Graph) is a direct result of photosynthesis activity by the green-growing biomass in the Northern Hemisphere ……… then one also has to claim and/or provide proof that there is a corresponding bi-yearly increase of an average 6 ppm in atmospheric O2.
Photosynthesis: converts carbon dioxide into a carbohydrate.
carbon dioxide + water + sunlight = glucose + oxygen + water
6H2O + 6CO2 → C6H12O6 + 6O2
So, if the May-September CO2 decreases by an average 6 ppm as the result of photosynthesis activity …. then the May-September O2 should increase by an average 6 ppm as the result of the same photosynthesis activity.
Iffen atmospheric oxygen isn’t “increasing” in lock-step with the May-September “decreasing” of atmospheric carbon dioxide ….. then the “green-growing” biomass in the Northern Hemisphere is not the culprit, …… the ocean waters in the Southern Hemisphere are.
Pseudo climate scientists want their cake and eat it too.
Correct-a-mundo. It’s actually impossible for all other factors to be held equal in the real world.
That said, it’s unlikely that the feedbacks are negative enough to totally wipe out the effect. And it’s almost impossible to know with any certainty what the net sensitivity is.
Dr. Curry has a great essay on what’s based on observations and what’s based on speculation… It was reposted here not too long ago.
Check this out:
http://bluemoon.ucsd.edu/publications/ralph/3_Seasonal.pdf
“At least half of the rise in atmospheric CO2 and CH4 over the past 150 years is due to the combustion of fossil fuels.
Tom Abbott
“I don’t disagree with that.
But … there is a possiblity… that there may be no net heat increase in the atmosphere due to CO2.”
Lol. Whack-a-mole.
“But … there is a possiblity… that there may be no net heat increase in the atmosphere due to CO2.”
Loydo : “Lol. Whack-a-mole.”
That’s the best you can do?
Loydo, do you contend that the “no net heat” speculation has been scientifically ruled out?
David Middleton – August 21, 2019 at 5:26 am
“YUP”, and so is Water vapor (H2O), Nitrous oxide (N2O), Ozone (O3), Chlorofluorocarbons (CFCs) and Hydrofluorocarbons (HCFCs and HFCs)
David Middleton – August 21, 2019 at 5:26 am
The above claim is little more than a “calculated” estimation that is not based in actual, factual evidence, ….. therefore it provides NO real scientific value, ….. only political value.
David Middleton – August 21, 2019 at 5:26 am
Employing the ole “bait n’ switch” trick, …….. HUH?
“Baiting” the readers via the inferred claim that CO2 and CH4 are the temperature increasing culprits ……… and then “switching” the blame for increasing temperatures to “greenhouse gases” being the culprit.
It is an absolute fact that in desert climates of extremely “low” humidity (H2O vapor), the resident quantity of CO2 and/or CH4 in the atmosphere has no measurable effect on near-surface air temperatures, ……………. and will not have any measurable effect on near-surface air temperatures as long as their ppm quantities remain less than 8,000 ppm.
The “warming” effect of atmospheric water vapor can be measured, but not precisely because its ppm is constantly changing. The aforenoted “warming” is referred to as the Heat Index.
“The Heat Index is a measure of how hot it really feels when relative humidity is factored in with the actual air temperature.”
“Loydo August 21, 2019 at 2:52 am
Releasing 1 kg of CH4 into the atmosphere is about equivalent to releasing 25 kg of CO2”
Is that right? Given the fact that the IR frequencies CH4 absorbs at are transparent to CO2 and CH4 oxidises out very quickly to CO2.
Smells like a lot of BS to me.
“the IR frequencies CH4 absorbs at are transparent to CO2”
True, but on the other hand the frequencies where CH4 absorbs are already largely blocked by H2O:
Look at that graph again. It’s not say what you are saying.
My bad. I should have used an actual TOA emission spectrum instead:
You can see how minor the 8 my absorption band is. The 3,5 my band probably even has net cooling effect since in daytime downwelling sunlight is much stronger than upwelling “earthlight” in the near infrared.
Where do you find this rubbish? Your links just show graphs, no references to sources of the data the graphs is created from.
That’s absolutely par for the course for every post he makes; as I pointed out in an earlier thread, he just dumps these graphics at his Google account and expects us to accept them. They might have come from Extinction Rebellion – or were commissioned from a nephew for all we know.
The methane graph is from the EPA’s site:
https://www.epa.gov/climate-indicators/climate-change-indicators-atmospheric-concentrations-greenhouse-gases
The greenhouse index graph is from here:
https://www.globalchange.gov/about
Both US government sites. Happy to lay it out on a silver platter for you. Now about the data, I take it you’re you disputing any of it?
Clearly you didn’t read the 5 “data sources” in the first link. And the second really goes, I dunno, nowhere!
You don’t read the information at the links you provide.
Wanted to find out who the hell globalchange.gov might be. They seem to be a sort of government environmental org, but curiously, their website is hosted by Cloudflare in San Francisco. If they’re genuine, can’t think why they haven’t been de-funded under Trump – clearly a missed opportunity.
@Loydo
Mate where do you get these most stupid graphs ever produced from 🙂
You did notice what the scale on the left is ppb not ppm like CO2 … hint what is the relationship between part per million and part per billion.
As you are clearly mathematically challenged lets put them in the same units for you and the same time frames. So in the last 20 years CO2 has gone from 350 ppm to 410ppm in the same timescale and same units Methane has gone from 1.8ppm to 1.9ppm. Lets also add another factor in methane has a persistence in atmosphere value estimated to be 12.4 years (AR5), CO2 has a persistence in atmosphere value estimated to be few hundred thousand years (high confidence) (AR5 Ch6 6.1.1.1.)
Worrying about Methane is the ultimate in turning a molehill into a mountain or much ado about nothing.
You have said some stupid things on the forum but this rates up there.
“CO2 has a persistence in atmosphere value estimated to be few hundred thousand years (high confidence) (AR5 Ch6 6.1.1.1.)”
A rather strange thing to claim, considered that historically no rise of pCO2 has ever lasted that long.
This yields one (1) Google return…
“CO2 has a persistence in atmosphere value estimated to be few hundred thousand years”
Loydo’s comment.
ROFL you want me to be responsible for the stupidity of google 🙂
You could just try reading the report hell I gave you the reference because that is ever so hard … hmm wonder where I might find it oh I know IPCC
https://www.ipcc.ch/site/assets/uploads/2018/02/WG1AR5_Chapter06_FINAL.pdf
Read the big blue box text page called BOX 6.1 on page 472
What is “Loydo’s comment” about?
I didn’t comment about CO2 residence time, but I will.
“…a significant fraction of the fossil fuel CO2, ranging in published models in the literature from 20–60%, remains airborne for a thousand years or longer. Ultimate recovery takes place on time scales of hundreds of thousands of years…”
https://link.springer.com/article/10.1007/s10584-008-9413-1
So-called skeptics like to say its 5 years but that is just dis-information. A single CO2 molcecule might on average only be airborne for 5 years, but the plume lasts for millennia… and maintains it’s warming effect for millennia.
Methane is much more reactive, mostly scrubbed out in a dozen years, but because it is a 25 times more effective GHG than CO2 it accounts for about 20% of the total GHG forcing. And of course it turns it is converted to CO2…
So Loydo understands the basic facts but like all good CAGW believers wants to make a mountain out of a molehill 🙂
Loydo:
Kindly point to a period in the past when a rise of pCO2 has actuslly lasted for “several hundred thousand years”. That IPCC thinks that this should happen is not proof.
CH4 is not “scrubbed out”, it is oxidized to CO2 + H2O. So, no Loydo does not understand the basic facts.
Incidentally the pretty noctilucent clouds we see in summer forms are formed by ice crystals from stratospheric breakdown of CH4.
“Loydo August 21, 2019 at 11:49 pm
Methane is much more reactive, mostly scrubbed out in a dozen years, but because it is a 25 times more effective GHG than CO2…”
Who says and why? One graph you posted would give you a clue.
Hmmmm…. were these “science guys” (and I use that term loosely) including the amount of methane that was produced every time someone broke wind on one of those fishing boats?
Good report, David. I wonder what the natural seepage of methane is for the area of the production platforms? Leakage is a common signal that goes into the “drill here” database. Sometimes the natural leak/discharge can be spectacular, and include crude (great name because it smell crude), gas (ditto), and failed cap rock. The Puesto Hernandez field here in Argentina is known for spontaneous discharges, even recently in spite of being a mature field with falling pressure.
The Cantarell oil field, offshore Mexico, was named after the fisherman who reported the massive natural oil seep to Pemex.
Many of the old, giant oil fields were discovered on the basis of oil & gas seeps and surface expressions of massive anticlines. It’s not so easy now.
A clue lies in this statement “they found that all the sampled offshore installations leaked even when they were not conducting operations” All were leaking?? Sounds fishy to me. Maybe they were measuring fish farts. Offshore installations become hotspots of biological activity.
That’s why they compared downwind and upwind levels.
That does not negate my objection. “Offshore installations become hotspots of biological activity.”
Mounted on small fishing boats?
Even fair weather sea swells of 1-2 feet will aim that mounted sensor over a wide vertical range. Higher swells or wind driven waves will amplify that range.
Small fishing boats are very susceptible to winds, currents and pilot adjustments.
Meaning that they are not measuring CH₄ oil platform emissions, they’re measuring CH₄ emissions over a large quadrant of ocean.
That means, these characters are claiming ocean outgassing, whale and dolphin emissions, small boat sailor emissions from bean/cabbage/onion/beer meals and perhaps a smidgen of oil platform emissions.
One wonders just what the Null test case is and whether these yahoos bothered to test the Null scenario?
I thought this bit from the paper was particularly funny on several levels.
“if emissions are higher than currently reported, additional measurements would give the industry an opportunity to identify common issues such as incomplete combustion at the flare (Fig. 2), reduce leakage, and improve the efficiency of platforms, thus potentially increasing profits from the extracted gas.”
Yeah… We’d have never thought of that without these intrepid nitwits… /SARC
They probably don’t know how “profits” are calculated.
Their analysis reminded of when in grade school while looking at an Alamanac I saw that the least number of auto deaths per year were at speeds over 120 MPH. Looking further I saw that the fewest accidents happened between 2AM and 6AM. Then I saw that less than 1/3 of the auto deaths occured as a result of DWI. Like them data showed that the safest way to drive was drunk between 2 and 6 AM
at 120 MPH while drunk.
How can any measurement with a 45% error margin be considered useful?
If indeed the plume modelers are correct and we’re generating a lot more methane than other scientists “thought” (whatever that is) .. then the obvious meaning is that the climate models are all wrong and are grossly overestimating the sensitivity of the climate to methane releases. Because the existing warming is what you get with a lot more greenhouse gas than the modelers assumed.
So now we can all relax.
That wasn’t the well. They served beans at dinner last night.
Hmm, given that I have done this kind of work (yeah 40 or so years ago), I would *not* have used a Gaussian. I would have used a Logistic curve model, if I could. Chemical kinetics would show the necessity, I’d say. Even then, 45% error bounds? Jeez.
Not to worry, methane not even on the list, it’s particulate pollution, worse than smoking. Wonder how many get so listed on death certificates.
https://www.americanscientist.org/blog/from-the-staff/air-quality-trade-offs
from their link—
https://news.uchicago.edu/story/air-pollution-reduces-global-life-expectancy-nearly-two-years
“The Air Quality Life Index establishes particulate pollution as the single greatest threat to human health globally, with its effect on life expectancy exceeding that of devastating communicable diseases such as tuberculosis and HIV/AIDS, behavioral killers like cigarette smoking, and even war.” And “Pollution linked to bipolar disorder and depression.” “Conflict and terrorism take off 22 days.” Note the black ‘carbon’ smoke. Clouds don’t look too good either.
There needs to be a way to recreate what the area around the Houston Ship Channel smelled like back when. And the windstorms blowing in from west Texas. In the medical profession there are many programs where professionals and students go to places where they are urgently needed. Do particulate pollution professionals do the same? I would hope so. I’m going outside to look for the “Fugitive Dust.”
YEEOWZA! 👏👏👏👏👏👏👏👏👏👏👏👏👏
It doesn’t look to me that the survey studied where this methane is coming from.
“In shallow oceans with water depth less than 100 m, the natural or human-induced leakages or both lead to significant sea-to-air CH4 degassing from 3.00 to 1.36 × 10⁵ μ mol m−2 d−1. To quantify the human-perturbation induced CH4 degassing, the combination of top-down modeling and bottom-up calculations is essential due to spatial and temporal variability of diffusion and ebullition at water-air interface.”
https://www.frontiersin.org/articles/10.3389/fmars.2015.00034/full
Not that I trust this article, but it appears that methane leaking from the ocean floor is widespread, and recently found in unsuspected locations. Where and how much? What percent escapes being eaten by microbes? Questions such as these would seem to be necessary before wagging fingers.
They covered that by measured all around the platforms, enhancement of up to 400ppb was only observed downwind of the platform.
“What percent escapes being eaten by microbes?”
Probably not much.
https://www.ncbi.nlm.nih.gov/pmc/articles/PMC1317418/
https://www.nature.com/articles/s41396-018-0263-1
…human-induced leakages … \
That one caught my attention.
Had a bean burrito for lunch.
Too often, “climate science” research gives The Onion a good run for the satire money.
“Secondly, the bass-ackwards world of climate “science” must be the only field in which 97% is a YUGE number ”
This was one of the many faults I pointed out in my review of AR6. The first sentence of the chapter on sensitivity and feedbacks called a less than 0.5% change in the energy balance (<2 W/m^2) a 'substantial' change that was inferred to cause catastrophic climate change. I pointed out that the average difference between perihelion and aphelion is more than 10x larger yet is not considered 'substantial' relative to its effect on the climate.
The article described in the OP is peculiar. It seems we have moved well away from conducting science and undertaking engineering for the purposes of furthering both our boundaries of knowledge and our capabilities; to the point where we are willing to assassinate the character of entities (e.g. persons, corps., ideologies, etc…) rather than discuss whether there are merits to the opposing viewpoints. We also seem to be heading into the direction where anything can be published as peer reviewed.
https://www.acsh.org/news/2019/08/20/scientific-american-says-vegetables-are-toxic-sugary-snacks-14234?fbclid=IwAR0jrNhtWlC2TgiXsVhsJUUQ-c0xHzmzFaMdA-cIfJ4uk_It4WiGZC6FbGI
I wonder how well one could use the Gaussian plume model to back-calculate whether avian particulate emissions from wind turbines are in excess of the industry-reported numbers.
What I would like to know is, what would the emissions rate be for all the wells that were emitting GHG’s and oozing oil naturally before we came along in the industrial world and capped them off?? Isn’t there a quid pro quo there somewhere?