This is a quick introduction to the 2019 paper The “Ocean Stabilization Machine” May Represent a Primary Factor Underlying the Effect of Global Warming on Climate Change by Mao et al. (pdf here). I believe many visitors here would find interest in their projected decrease (yup, decrease) in global land surface temperatures by the early 2100s and their conclusion that the recent global warming may have occurred primarily through natural factors.
Global cooling? I’m against it. Considering how cold it was outside my home this morning (about -18 deg C, or roughly 0 deg F), I’m glad I have a fossil-fuel-powered heating system. Brrrr.
A recent post New Paper: Modern Warming Was Driven By ‘Primarily Natural’ Factors. Global Cooling Has Now Begun. authored by Kenneth Richards at Pierre Gosselin’s blog NoTrickZone introduced the Mao et al 2019 paper that’s the subject of this post. Figure 3 from the paper is presented below. Some readers may find the paper interesting.

Figure 3 from Mao et al. 2019
The abstract reads:
Contemporary references to global warming pertain to the dramatic increase in monthly global land surface temperature (GLST) anomalies since 1976. In this paper, we argue that recent global warming is primarily a result of natural causes; we have established three steps that support this viewpoint. The first is to identify periodic functions that perfectly match all of the monthly anomaly data for GLST; the second is to identify monthly sea surface temperature (SST) anomalies that are located within different ocean basin domains and highly correlated with the monthly GLST anomalies; and the third is to determine whether the dramatically increasing (or dramatically decreasing) K-line diagram signals that coincide with GLST anomalies occurred in El Niño years (or La Niña years). We have identified 15,295 periodic functions that perfectly fit the monthly GLST anomalies from 1880 to 2013 and show that the monthly SST anomalies in six domains in different oceans are highly correlated with the monthly GLST anomalies. In addition, most of the annual dramatically increasing GLST anomalies occur in El Niño years; and most of the annual dramatically decreasing GLST anomalies occur in La Niña years. These findings indicate that the “ocean stabilization machine” might represent a primary factor underlying the effect of “global warming on climate change”.
Have fun in the comments below and enjoy the rest of your day.
Regards,
Anyone who claims to know what the average temperatures will be in the year 2100 is blowing smoke up your fundamental orifice …
Me, I think that climate science should get out of the long-term forecasting business until we have a firm understanding of long-term hindcasting. Why were the Roman and Medieval periods warmer? Why did we cool to the depths of the Little Ice Age? Why did the cooling stop? And why has it been warming, in fits and starts to be sure, at about half a degree per century since the LIA?
Until we have rock-solid answers to those questions, forecasting what will happen in 2025, much less 2125, is nothing but a circular wankathon …
w.
Climatology is the calculation of the probability of different kinds of weather events occurring. It involves no forecasting. Forecasting is meteorology.
Forecasting IS the calculation of probabilities. You are drawing a distinction where there is none. The difference is that in other fields, people actually lose their jobs (or funding) when their forecasts are repeatedly wrong.
Spot on WR2. AGW proponents love to point out that they now do “projections”, “not forecasts”. Sadly, both the public and policy makers globally just take the projections as firm forecasts, so, in practice, the difference doesn’t matter.
This is, of course, one forecast that matters because it can have a direct impact on the future outcome via human behaviour – and that is a financial forecast. Weather forecasts do not affect the future of the weather. Financial forecasts impact the human behaviour that is related to the financial forecasts in the first place.
how can you calculate “the probability of different kinds of weather events occurring” if you do not have a means of forecasting? Probabilities are based on the magnitude of the random / chaotic elements which you do not understand and can not model.
since the IPCC has clearly stated that climate is a non-linear chaotic system we can correctly conclude that all these predictions/projections/forecasts are a crock to spoon feed to compliant media outlets to ensure more funding and a world run by UN dictate.
OMG, it’s worse than we thought. Their so-called periodic functions is a sum of sine only, no cosine. It’s not even a valid F.A. , no phase term.
The only thing they are likely to get out of this is a triangle wave. Essentially what they have.
I guess that must be a ‘pay to play’ open access journal, with fictitious peer review.
IAN ….. that is the best post ever written to explain the connection of climate change to political policy. You should expand that into a paper. Key point:
Weather forecasts do not affect the future of the weather. Financial forecasts impact the human behaviour
All the hoopla about global warming will not change the future of climate. Nothing we do will change the future of climate. However, the CAGW meme has everything to do with economic behavior, ie, changing the fundamentals of the global economy. ….. IMO, to transfer power and wealth to the leftist elite while making equally poor peasants out of the rest of humanity.
“Spot on”, Willis, WR2 and Ian!
True financial forecasts usually include the warning’ “Past performance in not an indicator of future performance”.
Since, all forecasts are based on past performance, this warning is applicable; and triply applicable to climate forecasts as climatologists insist on using assumptions and unknowns in their “probability” calculations.
ATheoK
Financial markets are not natural. All, or almost all, the weather might be.
Meteorology is short-term forecasting of weather phenomena. Climatology is long-term forecasting of weather phenomena.
“Probability!?”
“different kinds of weather events!?”
Bafflegab, pure bafflegab.
One minute past a meteorological forecast that is based upon actual observations and climatology become climastrology based upon presumptuous “probability”.
Hi Willis, I agree, and the future is not ours to see.
When asked about the future I tell people that we have always survived and prospered.
There is a lot of stuff being published, like this one.
https://www.clim-past.net/15/25/2019/
It has an explanation of the past and I somewhat understand the neoglaciation theory but we skeptics should be providing a better view of the holocene to counter the consensus. Roman, Medieval and Victorian notions don’t satisfy people these days. Maybe have a look.
Dr Tisdale, rubbishing outliers is I suppose is fun, but I like to think about real science stuff.
Willis
I find it amazing that we pay any attention to data from 1880. I don’t believe anyone was interested in climate change, weather observations were almost exclusively a local affair or used for, say, shipping in a time when sails were commonplace.
What wasn’t so commonplace was standardisation. Stevenson screens across the world (which itself wasn’t developed until 1884) would have been maintained to different standards, protected with different paints, if painted at all. Even then there were variations “The national services developed their own variations such as the single louvered Cotton Region design in the United States.” https://en.wikipedia.org/wiki/Stevenson_screen
Not that I imagine a global roll out of these new fangled screens would have been accomplished on the stroke of midnight 1884, it would have taken 20 years to establish a network of them and get the reporting processes right. Even then they would probably have been considered local weather stations, not climate change monitors.
And in a time of virtually no communication other than by letter, how was calibration & standardisation possible between numerous screens across the globe? It’s even a problem now for Pete’s sake! I think it was Jo Nova who uncovered the Australian practice of recording temperatures every second (since digital instruments were used) instead of averaging over 60 seconds, to detect momentary temperature spikes. (that’s from memory, not sure if my description is accurate).
Tea boys would have been despatched to record measurements by the ‘scientist’ in charge, if there was one at all.
SST’s have been taken largely along well plied shipping routes. Who would regularly venture into the Southern Ocean at that time unless absolutely necessary. We can’t even get Argo buoys to agree on SST’s, what would make us imagine cabin boys or deck hands chucking a bucket over the side of the ship, to no definable depth would be any better? I mean, the Cutty Sark was still hauling cargo until 1922.
I also recall a poster on WUWT saying that there is still no international standard for ships intakes for sea temperature measurement.
Yet we can calculate SST’s and land temperatures at that time to two decimal places. Not credible.
Fully agreed. There is a webpage http://www.shipmap.org where you can watch ships sailing around the globe in May-June 2012. There essentially no ship traffic over Southern Ocean as even now there are no reasons for ships to go there, but of course same applies to Arctic Ocean, Barents Sea, Bering Sea, Okhotsk Sea… many other areas. There are even areas of little traffic in Indian Ocean and central Pacific Ocean. How was it back then in late 19th century? They didn’t even have Panama Canal, and steam engines of that period had to be quite unreliable, I don’t believe otherwise. Boiler explosions, valve sealing failures, manometers failing. And one more thing: how do they average SSTs with air temperatures? This completely blows my mind. Every half-grown knows that water may be cold while the air is warm or the other way around. How is this possible to even attempt this? Winds (and also sea currents to some extent) change. You can never know which way was the wind blowing unless you record it. This has a huge impact on air temperature. Essentially, I feel even today’s surface measurements could be biased in a way escaping detection. And this huge hole over Antarctica and its waters, where they had no measurements until at least 1930s… you can’t average this out using Patagonia, South Africa and Australia. Same applies to Arctic Ocean with Greenland and Canadian Archipelago – stations were only in the south and only along shores. No way to get the proper average.
Hotscot. Your last sentence reminds me of the scene in Animal House where John Belshui uses a tape measure to measure the windshield then just smashes it with a hammer.
Willis, you overlooked the early warming period of the 20th century (from the 1910s to the 1940s). The CIMP5 models don’t properly simulate the rate of warming during period either. In other words, we don’t have to go back so far.
Regards,
Bob
That temperature graph is taken from fake Hadcrut data.
Yeah, but Bob, they’ve pushed that warming period down to better fit the agenda. In actuality, all the global warming up to 2010, took place before the early nineteen forties. Recall that 1998, to the chagrin of GISS and NOAA was ~1 F° lower than that of 1937. The modern global warming invention was really the climb up out of the precipitous cooling that the clime syndicate argues never happened. I was born in the late thirties, and all my parents, family and friends talked about the dustbowl and heatwaves for a couple of decades afterwards. I of course remember the cooling and the hype about it. I was a graduate student in geology in the late 1960s and it was a big topic (Winnipeg is on the floor of former Lake Agassiz and the students from there were foremost specialists in quaternary geology of the Ice Age). Academics were concerned our time was up!
The big temperature decline and the recovery from it are just the type of “discontinuity” that BEST and the rest have algorithms for correcting out of existence
Agreed. It is good to see that non-alarmist BS can now get published as well as alarmist BS but it’s still BS.
So it seems that this is just some kind of Fourier analysis, which has no predictive ability unless you have a physical reason for the periodic functions. Fourier analysis is a form of analysis, not a basis for extrapolation.
I would have thought that 15,000 periodic functions would have been sufficient, with noise maybe 4 or 5.
Oh well, we can always reverse that Na battery to warm things up.
Yeah. Let’s see if this model, unlike the IPCC computer games, actually yields good forecasts.
Now the science is settled.
.
Accurate long term (before any training/tuning epochs) hindcasting is really the only way to judge such models.
Does anyone know if any of the GCMs have been run with negative time steps back beyond the instrumental record? I can’t think of any reason that the state transition integrations would only work in one direction.
Especially when they predict the temperature anomaly will be −0.49456 ̊C in November, 2127, and then go on to say that actually they have a lag of 16 years and underestimates by −0.11054ºC so actually it will be −0.6051 ̊C in 2111. That’s based on comparison between measurements made in 1892 and the prediction of their function for 1908! Total garbage!
Supposed to be a response to Willis’s original post, don’t know how it ended up here.
willis, I am surpised you did not pick this up:
“We have identified 15,295 periodic functions that perfectly fit the monthly GLST anomalies from 1880 to 2013 and show that the monthly SST anomalies in six domains in different oceans are highly correlated with the monthly GLST anomalies. ”
Some years ago I did this one with only 6 periodic functions
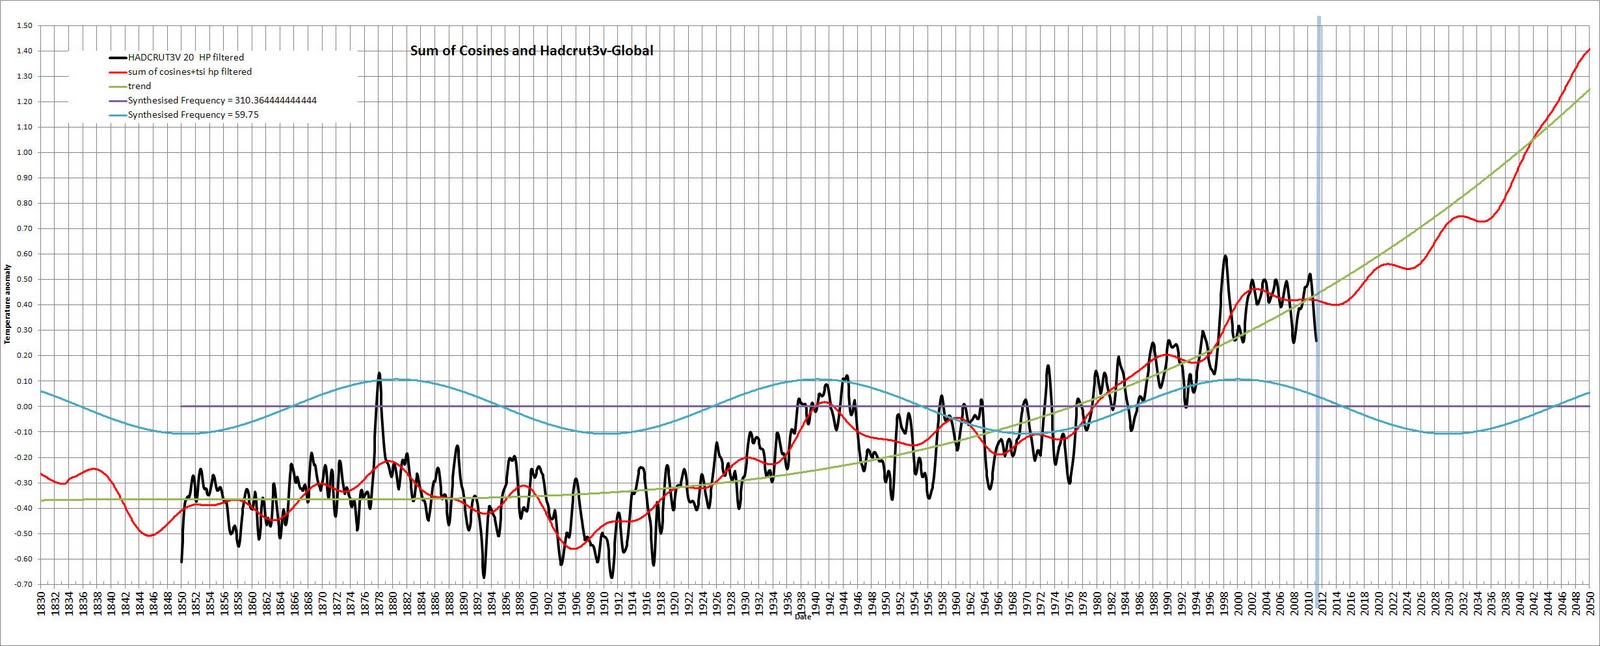
or perhaps
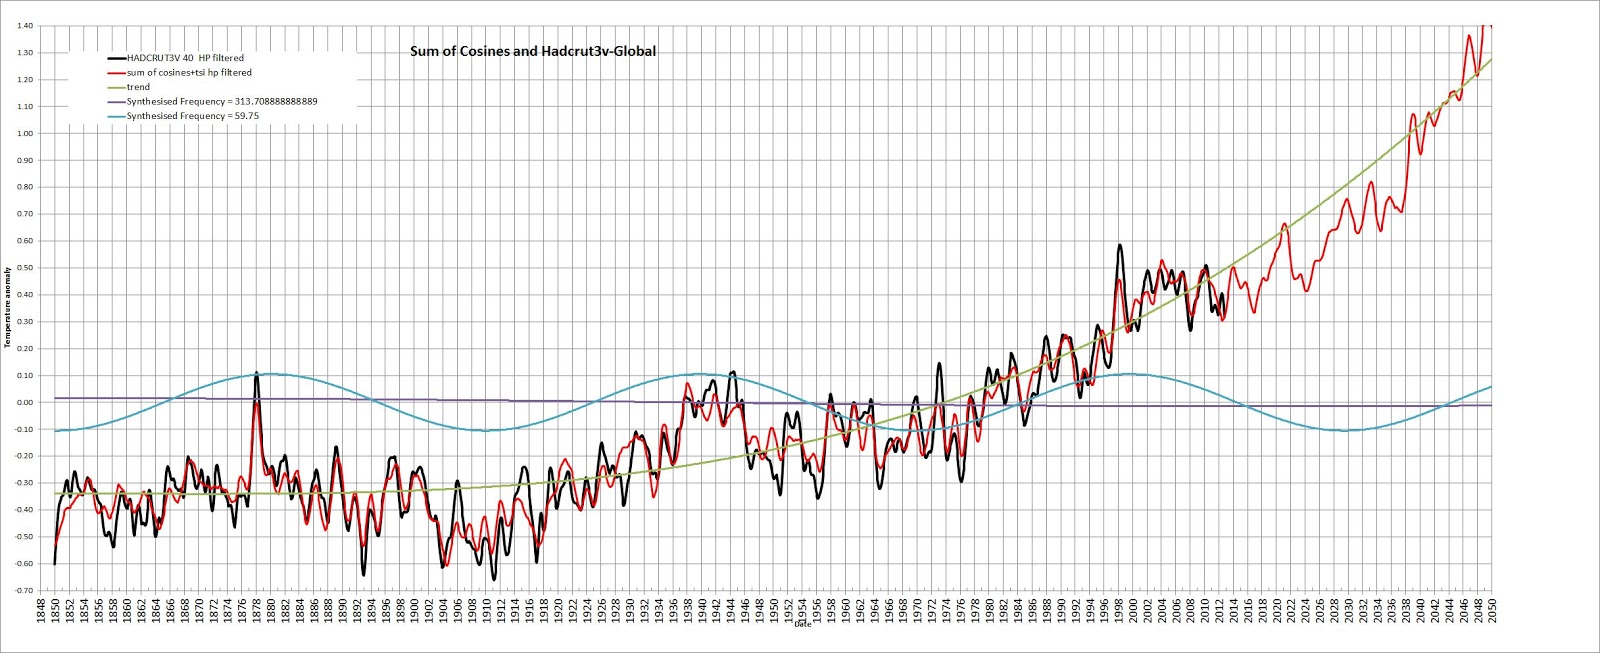
1.4° by 2050! and only 38 periodic functions
Absolute tosh in my opinion!
Willis Eschenbach
you have this climate change stuff
all bassackwards !
The future climate
is known with great precision.
To several decimal places
With high confidence
— 103% confidence in last survey**
** some scientists may have voted twice.
It’s the past climate that is a mystery!
Always being revised.
The 1930’s used to be hot in the US.
Called the Dust Bowl.
Not any more.
Now 1998 is hotter than the 1930’s.
Maybe next year 2016
will be the hotter than 1998.
This constant changing
of the hysterical (historical)
temperature data
is called “climate change”.
Based on past predictions,
any new predictions of the
future climate should be ignored.
Unless they include three decimal places.
Three decimal places is real science!
I learned that in science school.
Willis,
All of that is interesting coming from you. You constantly claim to be able to model the climate as a
thermo-regulatory engine that controls the temperature and keeps the climate stable about some fixed point. Now you are claiming that all of that is a “circular wankathon” and “blowing smoke”.
So my questions would be can your “thermo-regulatory engine” explain the little ice age? Can it explain the Roman warm period? If not you should follow your own advice and stop making claims about the climate.
Percy what predictions of precise temperatures for the year 2100 has Willis ever made? Forecasting decades into the future is not the same thing as theorizing about how the climate self-regulates. That you would attempt to conflate the two only shows how willfully disingenuous you are.
John,
Willis claims that the climate is self-regulating which explains its remarkable stability in the 20th Century. This is a model for the climate and as such can be make predictions about the future or the past. And even if Willis hasn’t explicitly done this is it simple to do with his model — i.e. the climate never changes since it is self-regulating and so the past and future temperatures must be the same as now. Using his analogy of cruise control if you know that cruise control is on and that the speed is 70 kph then the implication is that you will be travelling at 70 kph in the future and you were travelling at 70 kph in the past.
But Percy models don’t make predictions, only projections just ask Mosh 😉
Percy
Willis did produce a model for a particular temperature control function in the tropical ocean regions. To a certain extent his model (of a mechanism) can be said to have been validated. Certainly it has not been invalidated.
This is not the case for general circulation climate models, save one (Russia).
Validated models can make predictions. Speculative models can make projections on the basis of “if the past was like this then the future could be like that too.”
Models are widely used in engineering and physics. They work. Models are widely used in “climatology” and generally speaking, they don’t work.
The paper falls into the category of data analysis with a generated set of frequencies that sum to match the past temperature set. It is quite possible that the temperature set is inaccurate. If it was to be corrected, the analysis (which is a method) could be repeated and a new set of frequencies reported. The paper reports a method for doing that.
Having “matched” the data set with a set of frequencies, the frequencies can be run ahead to sett what might happen. The quality of the projection is as good as the quality of the data set used to inform the analysis and the quality of the analysis method.
I see no reason to dismiss the effort. Objections that the authors “so not know” the temperature in the year 2100 are correct – no one knows any such thing, but that doesn’t invalidate the analysis nor the projection, because there exists no knowledge that it is incorrect either. Willis’ claim that no one knows the temperature of the world in 2100 is trivially true. Of course they don’t. They didn’t claim they do.
Even if the period 1880-1930 was uncertain as to temperature, enough time passed since then to identify frequencies up to 80 years long. If the method replicates the recent 40 years, then it might be very good at projecting the next 20. As time passes it can be continuously refined. Each time that happens, it will be “better” or “more skilled” at predicting future temperatures farther out than 20 years.
There is nothing wrong with making such attempts. I don’t see how it could be worse than claiming that AG CO2 and volcano dust control everything – which is from the “eye of newt and wing of bat” (ENWB) school of natural philosophy where beliefs trump observations.
” We have identified 15,295 periodic functions that perfectly fit the monthly GLST anomalies from 1880 to 2013″
It’s one of these silly papers that fits periodic functions, and then, presto, predicts cooling. Of course. If you fit periodic functions, then what goes up must come down. Apparently their K-line technique comes from charting stocks.
I note that this appears in a SCIRP Journal, not noted for careful review. Sometimes reckoned a vanity publisher.
A published paper is a published paper. I’ll bet you wouldn’t be so fussy about where a paper was published if it was authored by a climate doomster.
This paper is such a crock it would never have got past a first reading in any journal which actually did any peer review.
Instead of trying guess what Nick may/would have said in some arbitrary other case, check out the journal. I can tell you now , it must be pay to play fake science journal. They probably had to shell out fair chuck of money for the pretense that this was a “published paper” in the PR sense.
They use 15,295 functions with two parameters each to model 1596 data points !! And look at how crap the fit is. It says something for the power of their K-lines method that it manages to degrade the fit to that point.
What a mess.
39 parameters, not 30000.
They found 15,295 functions out of 173,000 which had a better than 0.9 correlation coefficient with an unspecified number of terms. The best fit was achieved using 39 parameters which gave a “correlated coefficient of the best function is 0.9034706; the RMSE is 0.03”. Based on their graph the RSME is impossible and is presumably a misprint for 0.173.
From the part that you cite I have a more fundamental question. If the paper is from 2019, why does it only use temperature anomalies up to 2013? What would happen to that nice-looking graphic if it incorporated the significant warming experienced post-2013?
That shouldn’t matter much. First that is too few years to make a difference.
And second: the more recent data is more trustworthy, but we know that the earlier data has been tweaked to give the impression of more warming, By cooling the past and warming the present.
So the data used is used is already quite questionable. Same issue for the CIMP5 models.
But third, and most important, is that: when doing such fitting somewhat properly the available data is split into a few groups, at least two. The last bit is used as confirmation test but may not be used for fitting, neither directly nor indirectly.
So the function set is fit to the first 2/3 of the available data and once that is done the last 1/3 is used to test how good the fit is. In case that fit is not so good then there the story ends, you may not then use that knowledge to refit the first 2/3’s again, otherwise you are already over-fitting.
And then it does not really matter when the data ends, the increase after 2013 was only an ENSO effect and that is semi-regular, so any prediction after (say) 1968 (based on data before that date) would (could) never get the exact timing right, but should have several ENSO events (every so many years).
“So the data used is already quite questionable. Same issue for the CIMP5 models.”
Yes, the ascending part of that graph looks just like a modern period Hockey Stick graph (the 1930’s showing to be cooler than the 21st century).
“If the paper is from 2019, why does it only use temperature anomalies up to 2013? “
Because the paper appears to have been prepared around 2015, judging from the reference dates at the end of the paper.
Also reference [13], suggests that the idea of using K-line techniques was introduced in 2015 by J. Tan, who appears to be a student researcher. So perhaps this paper reflects some data and research done earlier with other techniques, then rehashed using the K-line ideas.
Probably took then 5 years to find a journal to publish this junk, or more likely to sell lottery tickets to pay a fake journal to publish it.
Agree. It’s curve fitting. Here’s a link to an XKCD cartoon. It makes the same point with regard to technical analysis.
You can always fit a curve. link The fact that you can do so doesn’t allow you to extrapolate.
You are correct. The same goes for fitting a linear trend. 😉
Or fitting several linear trends one after the other over shorter periods, to make an upward curve…
So what? Is it wrong?
Or have you not been paying attention to the crisis in science caused by so many peer-reviewed paper in proper journals failing to be reproducible?
Except of course in Climate Science – every other area of science has fraud, mistakes, errors in methodology, egos, publication bias, and all the rest, but not Climate Science.
15k periodic functions .. how many elephants’ trunks could you wiggle with that lot?
All of them.
This might not be better, but is also not really much worse than any of the existing CIMP5 models. Well perhaps a few are more serious than this.
But the level of overfitting of those models is quite similar to what these people do. And with as good as random functions.
When you try enough functions with enough parameters long enough, you can fit any dataset. It will be meaningless, but boy will it fit.
Another prediction of long term cooling from the Ocean Cycles/Solar Cycles crowd. This crowd, with their predictions of cooling, have been just as wrong as their alarmist counterparts predicting Catastrophic Warming, Tipping Points, and The End Of The World.
But the cooling cycles crowd has one thing going for them. If they keep it up long enough, eventually they will be right, even if only for a little while. Then there will be no end to the “I Told You So” stuff.
At least they do not rely on CO2 emissions-that is a plus.
Planets are rotating and so are ocean currents.
That gives the fundamentals for periodicity.
Fig. 3 from Mao et al is speculative nonsense.
Oh come on Bob, that Mao et al paper is complete nonsense. It assumes in equation (1) that the temperature is periodic with no long-term warming. Obviously, if you assume that, you are going to predict cooling. You’re a smart guy, why are you promoting this rubbish?
Paul, where in the post does it say I’m promoting it? The comments so far are exactly what I expected, especially the one from Willis at the start.
Cheers,
Bob
>> with no long-term warming. Obviously, if you assume that, you are going to predict cooling.
Nope. Then you may also predict no chance (neither warming nor cooling).
Plus their fitted function would go where ever it pleases.
And the basic trend in the data set that they used has the warming trend baked in, so it is rather unavoidable that they would get a warming trend as well.
They just do not assume a warming trend in that they do not force their functions to behave like that.
Their approach is simply questionable on a fundamental level, but the exact same is true for the CIMP models.
The CIMP models may have a slightly more complex set of functions (or not). But the rest is similar: the functions are questionable but complex enough to be able to fit almost anything. And they also have used historic data to curve-fit their models. That is usually done badly (e.g. using all data for the fit), and de facto just as meaningless as this exercise.
“Plus their fitted function would go where ever it pleases.”
No it could not. They only used sine terms and fitting that to a basically rising dataset will result in a triangular waveform. It’s a crock.
The result is guaranteed by their choice of method. ( Like most of climatology ).
Basically it’s a Fourier series minus the cos terms so it is limited in how well it can fit the data.
Re: the ocean stabilization machine.
The mid miocene warming, generally thought to be a textbook example of the wmghg effect of co2, is an interesting case study because this view is contradicted by gross anomalies in the data. It has an alternate explanation in the literature in terms of deep ocean circulation. Pls see
https://tambonthongchai.com/2019/01/17/miocene/
I just have to say that I like Willis Eschenbach‘s comment. Prove to me that you actually understand what has already happened before you claim that you understand everything well enough to tell me how to run my life so as to prevent what you tell me is going to happen in a few years or a hundred years for that matter.
It is tautological that you cannot resolve a frequency in a series with any confidence without having at least one full cycle of the frequency. Even then, with just one cycle, it is excruciatingly difficult to demonstrate that the cycle can be distinguished from autocorrelated excursion aka autocorrelated noise. Mao uses data from 1879 which gives him 140 years of data. At a stretch then, he could argue that the data can yield useful information about a cycle with a maximum periodicity of 140 years.
The last six terms of his final temperature fit have periodicities ranging from 172 years up to 1,594 years. These are the terms which define the overall long-term shape of his forecast.
Complete nonsense.
Any paper which uses an equation with terms like the following one should automatically be consigned to the trash can!
F(t) ≡ −0.030001106sin(π t/2)+0.029999448sin(π t/5)+0.039999448sin(π t/8)………
Coefficients quoted to better than 1 part per billion!
The same elementary high school error is shown here:
“Thus, we amend our prediction as it will reach −0.6051 ̊C in 2111.”
They claim:
” Until now, no one claims that he can fit perfectly the observed monthly anomaly of GLST from 1880 to now as we do.”
Looking at the graph reproduced here it hardly looks ‘perfect’.
They also claim that their method has a 16 year lag and underestimates by −0.11054ºC but don’t plot the lagged function, crazy. Of course if they did that they would show a minimum in the 1940s where the measurements show a maximum.
I found it a rather entertaining read. But then I like Science Fiction. At least they kept true to traditional Chinese views of Yin and Yang duality. 陰陽.☯️
There is a big difference between a regression model and a prediction model. That difference is increasingly being lost in this world of data flooding and powerful computers for analysis of massive data sets.
In longer periods of low solar wind the polar vortex is weak. A large amount of ozone accumulates in winter over the polar circle. This will decrease the temperature in medium latitudes. Extreme temperatures in winter and summer result from a smaller amount of water vapor in the atmosphere and occur during the periods of La Nina (in summer) and weak polar vortices (in winter).


Circulation in the Pacific still does not indicate the effect of El Nino. SOI remains neutral.
https://www.longpaddock.qld.gov.au/soi/
http://tropic.ssec.wisc.edu/real-time/mtpw2/product.php?color_type=tpw_nrl_colors&prod=global2×pan=24hrs&anim=html5
This winter, the lack of circulation compatible with El Nino and low solar activity will cause further weakening of the stratospheric polar vortex and a drop in temperature in Europe and in the east of North America.

The tropospheric circulation at the level of 500 hPa is compatible with the polar vortex in the lower stratosphere.
https://earth.nullschool.net/#2019/01/22/0900Z/wind/isobaric/70hPa/orthographic=-63.79,91.50,340
https://earth.nullschool.net/#2019/01/22/0900Z/wind/isobaric/500hPa/orthographic=-63.79,91.50,340
Sometimes climatology papers make me feel smarter while actually they are making me more stupid.
Current temperatures (F) in the east of the US.

Extreme cold in the NE, as I (we) correctly PREDICTED in mid-November at
https://wattsupwiththat.com/2018/11/17/will-the-snowiest-decade-continue/#comment-2521702
https://weather.com/maps/ustemperaturemap
The secret to having a record of successful predictions is to have extremely competent friends. 🙂
Extreme snow and cold caused the Montreal “Festival of Snow” to be cancelled.
The official announcement read: “Tabarnouche il fait trop froid, mon esti de sacréfice.” 🙂
Look at the forecast of the polar vortex on 1 February 2019.
https://www.netweather.tv/charts-and-data/stratosphere
Extreme cold in the NE, as I (we) correctly PREDICTED in mid-November at
https://wattsupwiththat.com/2018/11/17/will-the-snowiest-decade-continue/#comment-2521702
Actually you didn’t, you said “I’m calling down another very hard winter on the US Northeast, extending up into Canada” and you did it out of spite.
Two cold days don’t constitute ‘a very hard winter’, in Boston it will be up to 44ºF tomorrow and 55ºF on thursday
You’re wrong.

Wrong about what?
The frost in the northeast of the US and eastern Canada will last for many days this winter. Also in February.
So you don’t think that the temperature in Boston will reach 44ºF tomorrow and 55ºF on thursday, above the average of 36ºF?
That’s how I forecast. Circulation slowed down. Lows in the south are weak.
Currently 33ºF in Boston.
Now 44ºF probably another couple of degrees by midnight, looks like I underestimated.
Looks like I got it right since Boston is currently 57ºF and raining (20ºF above average), if anything I underestimated.
I’ll wager there are more than two cold days in Boston this winter.
I’m sure there will be, but Allan is claiming that these two cold days are proof of his ‘prediction’ of a very hard winter. He also ignores that the next two days are likely to be on average about 10ºF above average, that of course isn’t an indication of a ‘mild winter’.
Phil – your fake straw-man argument is exposed. – I predicted the winter would be colder than average – not just two cold days. December was cold with lots of snow – now the NE is into another cold period in January.
– I predicted the winter would be colder than average – not just two cold days.
You didn’t predict anything you said “I’m calling down another very hard winter on the US Northeast, extending up into Canada. The reason I’m doing this is that you deserve it.”
That’s wishful thinking, not a prediction.
You also claimed that “Extreme cold in the NE” today was something that you correctly predicted, well that extreme cold will last about two days followed by two days of ~10ºF above average for Boston and the remainder of the week being about average. So far not looking like a “very hard winter”.
December was cold with lots of snow – now the NE is into another cold period in January.
I don’t recall December being exceptional, other than the record high of 63ºF on Dec 21st. If anything the month was mild and rainy. To fulfill your prediction of a “very hard winter” February will have to be brutal.
Phil, some people are better at prediction than others. For weather, I rely on Joe d’Aleo and the good people at WeatherBell. Their track record is excellent. BTW, so is mine.
The USA averages about 100,000 Excess Winter Deaths per year. That is the equivalent of two 9-11’s per week for 17 weeks EVERY YEAR. Cold and cool weather kills twenty times more people globally than warm and hot weather.
Joe and I wrote a paper about Excess Winter Deaths here:
https://friendsofsciencecalgary.files.wordpress.com/2015/09/cold-weather-kills-macrae-daleo-4sept2015-final.pdf
Here is one of our recent predictive successes:
https://wattsupwiththat.com/2018/11/17/will-the-snowiest-decade-continue/#comment-2521694
Prior to the record snowfall in the winter of 2014–15, Joe d’Aleo and I sent a written warning to my friend at the US Energy Information Administration (EIA), stating that the NWS weather forecast that EIA used was extremely in error, and warning of a very cold and snowy winter to come, especially for the Northeast Coast.
The EIA reran their lower 48 USA energy demand for that winter using Joe’s forecast and calculated an additional 11% total energy required for the winter months. The actual energy consumption were one percent lower than Joe’s forecast and 10% higher in the NWS forecast. That is a huge amount of energy.
I do not know what contingency the EIA uses, so I don’t know if we saved any lives. Nevertheless, I believe we did a good deed and we may have indeed significantly reduced human suffering.
You claimed that the following statement constituted an accurate prediction of “Extreme cold in the NE, as I (we) correctly PREDICTED in mid-November”.
I’m calling down another very hard winter on the US Northeast, extending up into Canada.
The reason I’m doing this is that you deserve it.
Well a couple of cold days does not constitute a very hard winter, and your statement hardly constitutes a ‘PREDICTION”.
Phil see the forecast of stratospheric intrusion.

It will be another cold night in Boston.

It will be another cold night in Boston.
Yeah about 18ºF, a few degrees below average, tomorrow it will reach mid 40s about 10 degrees above average.
The front stopped over Pennsylvania. Still frost in the northeast of the US.

Phil – If I have to choose between your uninformed opinion based on NO predictive track record, and the very credible predictive track record of Joe d’Aleo and his colleagues at WeatherBell, I’m going with my friend Joe. You should hang out with better people. 🙂
Bundle up – it’s going to get colder out there.
Regarding the past, here is my earlier predictive track record. At that time, these now-clearly-valid opinions were considered heresy. Told you so, 17 years ago.
In a debate in 2002 with the leftist Pembina Institute, we wrote:
“Climate science does not support the theory of catastrophic human-made global warming – the alleged warming crisis does not exist.”
“The ultimate agenda of pro-Kyoto advocates is to eliminate fossil fuels, but this would result in a catastrophic shortfall in global energy supply – the wasteful, inefficient energy solutions proposed by Kyoto advocates simply cannot replace fossil fuels.”
Past decades of actual global observations adequately prove that these two statements are correct to date. There is no runaway or dangerous global warming, nor is there wilder weather, or any of the other false alarmist claims by the warmist camp. Green energy schemes have been costly and destructive failures, due primarily to intermittency.
Phil – If I have to choose between your uninformed opinion based on NO predictive track record, and the very credible predictive track record of Joe d’Aleo and his colleagues at WeatherBell, I’m going with my friend Joe. You should hang out with better people. 🙂
Well we’ll keep a track of your prediction, so far halfway through the winter it’s certainly not been “very hard winter on the US Northeast”, rather mild in fact.
Bundle up – it’s going to get colder out there.
About a week before it drops significantly below average according to my source.
Well temperature in Boston is now 36ºF, average for the day, so I’m not wrong on my statement about today ren.
It was a very useful act to have a total waste article published, because it has provoked the experts to comment on it. Keep it up.
I don’t know about this specific paper, which MAY be curve fitting, but in GENERAL, it takes about 1000 years for a transit cycle in ocean currents,
https://en.wikipedia.org/wiki/Thermohaline_circulation
so temperatures could reasonably fluctuate over that 1000 year cycle. Look back 1000 years and we have the Medieval Warming Period, with Eric the Red settling in Greenland. Much of the CURRENT warming could be due to the oceans releasing some of the extra heat they picked up 1000 years ago while on the sea surface.
Judith Curry’s blog
https://judithcurry.com/2019/01/14/ocean-heat-content-surprises/
had a link to THIS story:
http://science.sciencemag.org/content/363/6422/70
““The ocean has a long memory. When the water in today’s deep Pacific Ocean last saw sunlight, Charlemagne was the Holy Roman Emperor, the Song Dynasty ruled China and Oxford University had just held its very first class. During that time, between the 9th and 12th centuries, the earth’s climate was generally warmer before the cold of the Little Ice Age settled in around the 16th century. Now ocean surface temperatures are back on the rise but the question is, do the deepest parts of the ocean know that?”
Judith Curry concluded with
“The NASA GISS crowd (including Gavin) is addicted to the ‘CO2 as climate control knob’ idea. I have argued that CO2 is NOT a climate control knob on sub millennial time scales, owing to the long time scales of the deep ocean circulations.
A talking point for ‘skeptics’ has been ‘the warming is caused by coming out of the Little Ice Age.’ The control knob afficionadoes then respond ‘but what’s the forcing.’ No forcing necessary; just the deep ocean circulation doing its job. Yes, additional CO2 will result in warmer surface temperatures, but arguing that 100% (or more) of the warming since 1950 is caused by AGW completely neglects what is going on in the oceans.”
So a lot of the flux could be due to the OCEANS being warmer, and releasing some of the excess heat they picked up 1000 years ago.
IF the recent warming were due mostly to greenhouse gases warming up the earth, THEN the outgoing longwave flux should be decreasing, or at BEST remaining constant as the earth’s surface heats up.
IF the recent warming were due mostly to a warmer ocean releasing more heat, then greenhouse gases blocking an increasing amount of radiation would NOT apply, and outgoing long wave radiation due to increased surface temperatures should INCREASE, to release that additional increase in radiation on the surface of the earth.
Michael Hammer posted in 2013
https://jennifermarohasy.com/2013/12/agw-falsified-noaa-long-wave-radiation-data-incompatible-with-the-theory-of-anthropogenic-global-warming-2/
1. Earth can only warm if the rate of energy input exceeds the rate of energy loss;
2. Thus earth would warm if energy absorbed from the sun increased or energy loss to space (outgoing longwave radiation or OLR for short) decreased – or of course both;
3. The theory of AGW claims that Earth is warming because rising CO2 is reducing the energy loss to space i.e. is causing OLR to decrease;
4. Thirty years of experimental data published by NOAA (one of the prime AGW reference sites) shows OLR has been rising progressively between 1980 and 2010 and is now 2.5 watt/sqM higher than in 1980; and
5. The period between 1980 and 2010 is when almost all the CO2 induced warming is supposed to have taken place.
“If the corner stone of AGW theory says earth is warming because outgoing long wave radiation is decreasing yet 30 years of experimental data shows OLR is rising (remember 30 years is the time AGW proponents claim is the interval necessary to separate climate from weather) it would seem the theory of AGW is as a minimum extremely seriously compromised.”
Michael Hammer couldn’t give SPECIFICS as to why the earth heated up over the late 20th century. It NOW looks like it was due to the ocean.
I think Eschenbach ‘s attack was rather harsh. True, we cannot make completely accurate predictions about the future, but we CAN be reasonably sure that average temperatures in July in the northern temperate zone will exceed average temperatures in January in the same area. Likewise, depending on the general thermohaline circulation rate, there might be a roughly 1000 year periodicity in earth’s warming/cooling thanks to that ocean feedback effect.
Last Peak Holocene Optimum: ~5 Ka
Peak Egyptian Warm Period: ~4 Ka
Peak Minoan Warm Period: ~3 Ka
Peak Roman Warm Period: ~2 Ka
Peak Medieval Warm Period: ~1 Ka
Peak* Modern Warm Period: ~Now
*To date.
Intervening cool periods, like the LIA, are intervals with more solar minima than average. For example, four from AD 1280 to 1830, but only one weak one during the Medieval WP and none at all since the end of the Dalton, AD 1790-1830.
Same pattern observed in prior interglacials as well.
Thank you John and others for your posts.
I have no opinion on the Mao paper, having not read it. Others such as engineer Dan Pangburn have developed similar but much simpler relationships and similar results.
The historical temperature record is indeed shaky in detail, but probably not that bad in general – that is, before all the fraudulent temperature “adjustments” in recent years. There are a few long surface-temperature records, such as the Central England Temperatures (CET). Then there are some good longer-term proxies (but not tree rings).
We also have historical record, for example the grapes grown in Britain in Roman times and the Norse settlements in Greenland during the Medieval Warm Period. There were the ice fairs on the Thames, and the huge death toll from starvation and exposure during the Little Ice Age, and the torture and burning of thousands of witches for alleged weather sorcery (which did not provide much heat and did not solve the cold crisis).
In general, past warm periods coincided with higher solar activity, and colder periods coincided with low solar activity and few or no sunspots. Based on that general correlation, and the current crash in solar activity, Earth will probably cool moderately, starting anytime soon.
Regarding predictions, I wrote in an article published 1Sept2002 in the Calgary Herald:
“If [as we believe] solar activity is the main driver of surface temperature rather than CO2, we should begin the next cooling period by 2020 to 2030.”
I will stand with this prediction – for moderate, natural cooling, similar to that which occurred from ~1940 to the Great Pacific Climate Shift of 1977, despite increasing atmospheric CO2. As stated previously, I hope to be wrong, because humanity and the environment suffer during cold periods.
Regards, Allan
Judith Curry has an interesting blog post on ocean heat here:
https://judithcurry.com/2019/01/14/ocean-heat-content-surprises/
From the series of papers she reviews, it appears the the ocean DOES have a memory, thanks to the roughly 1000 years it takes to complete a cycle in thermohaline circulation. Curry concludes with
“The NASA GISS crowd (including Gavin) is addicted to the ‘CO2 as climate control knob’ idea. I have argued that CO2 is NOT a climate control knob on sub millennial time scales, owing to the long time scales of the deep ocean circulations.
A talking point for ‘skeptics’ has been ‘the warming is caused by coming out of the Little Ice Age.’ The control knob afficionadoes then respond ‘but what’s the forcing.’ No forcing necessary; just the deep ocean circulation doing its job. Yes, additional CO2 will result in warmer surface temperatures, but arguing that 100% (or more) of the warming since 1950 is caused by AGW completely neglects what is going on in the oceans.”
About 1000 years ago, the vikings were settling in Greenland, during the Medieval Warm Period. The ocean currents absorbed additional heat at that time and are now releasing it, adding current warming. Looking back, there was gradual cooling over the next three or four centuries, and over the NEXT three or four centuries, that colder water will be coming to the surface, possibly cooling the earth off.
The specific paper by Mao et.al. MAY be curve fitting, but general predictions about future temperature trends CAN be made. It can be stated with confidence that temperatures in northern temperate latitudes will average warmer in July than in January.
IF the global warmers were correct, and the warming were due to greenhouse gases, outgoing longwave radiation would be reduced, or at best stay constant with additional warming.
IF the warming was due to the OCEANS releasing heat, and had nothing to DO with greenhouse gases, then outgoing longwave radiation should increase along with increasing surface warming. Which is it?
Michaal Hammer had the answer in a 2013 guest post on Jennifer Marohasy’s blog:
https://jennifermarohasy.com/2013/12/agw-falsified-noaa-long-wave-radiation-data-incompatible-with-the-theory-of-anthropogenic-global-warming-2/
“1. Earth can only warm if the rate of energy input exceeds the rate of energy loss;
2. Thus earth would warm if energy absorbed from the sun increased or energy loss to space (outgoing longwave radiation or OLR for short) decreased – or of course both;
3. The theory of AGW claims that Earth is warming because rising CO2 is reducing the energy loss to space i.e. is causing OLR to decrease;
4. Thirty years of experimental data published by NOAA (one of the prime AGW reference sites) shows OLR has been rising progressively between 1980 and 2010 and is now 2.5 watt/sqM higher than in 1980; and
5. The period between 1980 and 2010 is when almost all the CO2 induced warming is supposed to have taken place.
“If the corner stone of AGW theory says earth is warming because outgoing long wave radiation is decreasing yet 30 years of experimental data shows OLR is rising (remember 30 years is the time AGW proponents claim is the interval necessary to separate climate from weather) it would seem the theory of AGW is as a minimum extremely seriously compromised”
The specific Mao et al. paper MAY be curve fitting, but it is reasonable to believe that the 1000 year rough periodicity in ocean thermohaline circulation would affect climate. Eric the Red settled in Greenland during the medieval warm period 1000 years ago. The oceans which warmed at that time are returning to the surface and releasing their extra heat. As I recall, the world cooled over the next 3 or 4 hundred years, and it would not be too surprising if, 1000 years later, that colder water returning to the surface had an effect on earth’s climate.
Donald Kasper January 22, 2019 at 12:12 am
Climatology is the calculation of the probability of different kinds of weather events occurring. It involves no forecasting. Forecasting is meteorology.
__________________________________________________
short trip to meteorology:
https://www.google.com/search?q=meteorology+etymology&oq=meteorology+ety&aqs=chrome.
“what happens above, what comes from above.”
at archaeological excavations in Rome, Italy or Athens, Hellas you can see that antique streets are 6-8 meters below contemporary street levels.
the earth is gaining mass: 6-8 meters in ~ 2,000.- years. Where does that mass stem from:
a steady shower of STARDUST.
And if we don’t go everyday over a contemporary street with a broom then our contemporary streets will gain height too.
Don’t let me be misunderstood: the dust in your flat, in your living room is the same as the dust in the streets.
and that dust is natural radioactive because it stems from the explosion of supernovae.
That much about catastrophic anthropogenic made particular matter PM2.5
Shucks!
Regards – Hans
/ hope there’s not to much ‘support’ from ‘spell check’ in my text /
Projecting? Hmmmm. Didn’t Freud or someone talk about projecting your thoughts and emotions onto someone or something else? Is that what is going on with the models?ji
It probably underestimates the cooling that will occur by 2040.
Allow me to summarize this once more.
1) 288 K – 255 K = 33 C warmer with atmosphere is rubbish. The 288 K is a WAG pulled from WMO’s butt. NOAA/Trenberth use 289 K. The 255 K is a theoretical S-B temperature calculation for a 240 W/m^2 ToA ASR/OLR balance (1,368/4 *.7) based on a 30% albedo. By definition no atmosphere includes no clouds, no water vapor, no oceans, no vegetation, no ice, no snow an albedo perhaps much like the moon’s 0.15. 60% of the lit side would be above freezing, over the year 100 % due to the seasonal tilt, not that it matters since there will be no water to freeze. Without the atmosphere the earth will get 20% to 40% more kJ/h depending on its naked albedo. That means hotter w/o not colder. The atmosphere is like that reflective panel behind a car’s windshield.
https://www.linkedin.com/feed/update/urn:li:activity:6473732020483743744
2) 333 W/m^2 up/down/”back” GHG energy loop is thermodynamic nonsense, i.e. energy appearing out of nowhere, a 100% efficient perpetual energy loop, energy from cold to hot without work. “Net” radiation is total BS.
https://www.linkedin.com/feed/update/urn:li:activity:6457980707988922368
3) 396 W/m^2 upwelling ideal BB LWIR that powers 1) & 2) is, as demonstrated by experiment, not possible. If this upwelling energy does not work – none of it works.
https://principia-scientific.org/debunking-the-greenhouse-gas-theory-with-a-boiling-water-pot/
1) + 2) + 3) = 0 GHE & 0 GHG warming & 0 man caused climate change.
In the hope that “there are no stupid questions” holds true here…
I’ve recently been reading a lot from both sides of the debate, and have been consistently struck by how graphs showing model projections matching (or otherwise) global temperature change always seem to have start dates in the mid- to late 19th century.
Since it would seem obvious that a plausibly effective model would first need to account for variability driven by natural forces — in order to then flag up what additional change (or otherwise) human activities are producing — surely these models must have been back-tested to produce hind-casts of temperature for at least several centuries or, preferably, several millennia?
As Google has failed to turn up details of longer-term hind-casting for me, could anyone here provide links to research showing how well today’s GCMs have matched past temperatures over the last few centuries? Thank you.
I would just like to point out that there are huge differences between Warmunist “science”, which blithely assumes that A) our “current warming” (which is dependent on cherry-picking) is “overwhelmingly” manmade, and that B) the “current warming” will continue because of “carbon emissions”, and that presented by this paper on cooling. Even if you reject the science presented, call it “shoddy” or what-have-you, it is a thousand times better than what the Warmunists present. And, we are still left with the default climate theory, which is that climate is primarily (if not overwhelmingly) driven by natural forces.
Yesterday I shook my head when I read “15,295 periodic functions”. What a joke!
I’m getting tired of all these sub-par solar papers and their pronouncements, including this one.
Don’t get me wrong, I absolutely agree with the conclusions that the sun not CO2 drives the climate, but these people’s papers aren’t cutting it and are actually making things worse for everyone.
The way to the truth is narrow. It doesn’t take over 15K periodicities to understand climate change, and it’s not how solar climate forcing should be done.
Furthermore, to claim the sun is wholly responsible for forcing and then to make a 100+ year forecast to the fourth decimal place without knowing what the actual solar forcing will be is absolutely the height of irresponsibility and ignorance.
The best anyone can do is one solar cycle ahead, and even that is really an unknown except for the estimation of the next cycle’s magnitude, pioneered by Leif Svalgaard, and lately forecasted by many others too.
The IPCC is guilty of the same, ie, thinking we know what solar forcing will be out to 2100.
The RCP8.5 scenario is just as bad.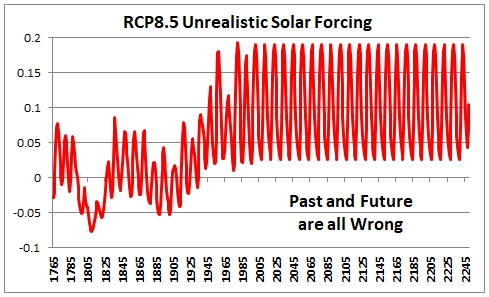
They tacked on another modern maximum in solar activity – of course that will drive more warming, but the IPCC people are dishonest and dumb, they again falsely attribute model warming to CO2 instead of more high solar activity.
Overall, this paper is Good News! It shows that at least some climate scientists are willing to begin looking outside the enforced CO2-AGW box, and propose radically different causes for the temperature record. Nikolov and Zeller did the same.
In both cases, much more work is needed to see if these radical proposals have merit and whether they will hold upon close (very close) review and deep digging.
It is odd to see here — at WUWT, a mainstay of the skeptical viewpoint on IPPC-AGW — these brave new hypotheses being summarily dismissed at a brief glance.
I suspect that the most scornful comments here come from those who didn’t even bother to download and read the original paper — which is probably the same reaction the paper gets from the Climate Rapid Response Team.
Thus we get a peek at the dirty underwear of the climate skeptic world — some here are as attached to their own little skeptical angle as the IPPCers are to theirs. And just as willing to thrown mockery, scorn and condemnation at new ideas as the worst of the Climate Team.
Thus we get a peek at the dirty underwear of the climate skeptic world — some here are as attached to their own little skeptical angle as the IPPCers are to theirs.
I don’t agree Kip for the reasons I stated above. We shouldn’t accept bad science even if it sounds good and supports the opposite of the IPCC. The path to the truth is narrow.
The RCP8.5 is actually consistently higher solar forcing than the modern maximum. When have we ever seen solar activity repeat exactly the same way for dozens of solar cycles? Never. So why do they do this? Where is Svalgaard on this, why isn’t he railing against their phony RCP8.5 solar forecasting?
Bob ==> I don’t quite get your point.
Have you read the Mao et al paper? It is pretty interesting and uses a novel approach — k-lines (brought over from the world of stock market analysis) — and applies it to the Global Land Surface Temperature record then compares the k-line record to the ENSO record. (There is no hint of solar forcing in the paper — they are looking at ENSO.)
Now that may be a nutty thing to do — but it may also be a novel and insightful thing to do. They present a compelling story.
At least they are using their minds to look at other possibilities and other approaches to the climate system.
Note: When reading the paper, it is important to realize that these scientists do not have English as their first language — and there are some problems from that — but not very many of us speak, read, and write Chinese either.
From my viewpoint, this is definitely NOT “bad science” — it is innovative and worthwhile even if they are wrong. And even if wrong — it may lead them or someone else to a new and better approach — that’s how science really works.
How science doesn’t work is summarily brushing off every new idea as “trash” or “bad science”.
… compares the k-line record to the ENSO record. (There is no hint of solar forcing in the paper — they are looking at ENSO.)
Now that may be a nutty thing to do — but it may also be a novel and insightful thing to do. They present a compelling story.
Kip, to be fair I just read a bit on K-line theory, which is a market-based approach to trend forecasting based on a few simple rules garnered from recent activity, and just looked through Mao etal’s paper.
I see the K-line as similar to simple statistical trend forecasting. I tried using statistical forecasting for a while but found it’s only so good, as in not very.
I learned about solar activity partly by keeping up with daily data and the US Air Force daily 45 day ap and F10.7cm flux forecast from NOAA. They change their 45d forecast during times of solar activity changes quite often over time as new sunspots emerge and old ones dissipate. They’ll show a decline in the forecast until all of a sudden a new sunspot emerges, making them change their last statistically based trend to positive. So they get it wrong a fair portion of the time, so no one should count on climate or solar forecasting 100 years forward.
That Mao etal didn’t use solar data while claiming ENSO K-lines can do the job indicates they are having some of the same difficulties understanding the solar-energy origin of the ENSO as many of our skeptic friends as well as warmists who are unclear that the ENSO itself is not a forcing, not merely a pattern in the data, nor a real oscillation, but a reaction to variable solar forcing.
Their method sounds like they assume past climate drives future climate, ie climate change causes climate change. Does that sound like science to you?
Everyone can tell a compelling story… but does the story check out?
Bob ==> Mao et al don’t speculate on the cause of ENSO. As I understand it, they use ENSO in this:
“most of the annual dramatically increasing GLST anomalies occur in El Niño years; and most of the annual dramatically decreasing GLST anomalies occur in La Niña years. These findings indicate that the “ocean stabilization machine” might represent a primary factor underlying the effect of “global warming on climate change”.” They end up proposing their “Ocean Stabilization Machine” hypothesis as driving climate warming and cooling, stating “These findings have effectively supported the OSM viewpoint: the oceans on this planet can be vividly called “ocean stabilization machines” (OSM). When some part of an OSM loses control for unknown reasons, other parts of the OSM stabilize the atmospheric circulation. As a result, El Niño or La Niña events occur.”
Dr. Curry and Wyatt proposed the Stadium Wave hypothesis. Nikolov and Zeller proposed their Pressure-Insolation theory; Mao et al propose the OSM.
Climate Science is finally getting some new bright ideas …. and some of them may well play out …. replacing or over-riding the CO2-AGW hypothesis.
You are perfectly welcome to stick to your view — you may be right. I’d like to read the papers that conclude that ENSO is “reaction to variable solar forcing.”
You are perfectly welcome to stick to your view — you may be right. I’d like to read the papers that conclude that ENSO is “reaction to variable solar forcing.”
I will, I am right, and I’m glad you’re looking forward to reading my paper.
Long before Mao etal published I figured out the sun drives the climate via the ocean – you’ve probably seen parts of my work here. I’m glad you’re on board with the ocean stabilizing the climate part, as I am too, it moderates short to long duration low solar activity periods, but imo the Stadium Wave is in the category of ‘the climate drives the climate’.
Kip,
The paper is nonsense. For instance they claim that their fit shows that temperatures will reach their “lowest point in November, 2127, which is −0.49456˚C. According to the error in previous time, for example, it reached the lowest point in January,1908, which was minus 0.61946˚C (in fact, it was in October, 1892, when the anomaly is −0.73˚C). The prediction using the function had 16 years lag ,and −0.11054˚C underestimated. Thus, we amend our prediction as it will reach −0.6051˚C in 2111.
Now they appear to be claiming that they have fitted the temperature data with 15000 periodic functions and it is the best fit ever. But there is still a 16 year time lag and an offset of 0.11 degrees
that have to be added to any prediction made using it. All of which is nonsense since the temperature minimum is just one month in 1892 and there is no reason to think that because October 1892 was very cold then over 200 years later there will be another anomalously cold month exactly 16 years after their prediction.
In addition there is no physical mechanism suggested in this paper it is just playing around with periodic functions. Which again is why it was published in a predatory journal with zero standards.
Percy ==> Their hypothesis may be nonsense — and it may not be.
Tan’s earlier work on k-lines was published by the Royal Meteorological Society….and this new work is a continuation of that. I wouldn’t place too much value on what journal is was published. BEST “published” their first paper in a junk journal that had never before published any papers at all.
Of course, they are not the first group to notice that surface temperatures have been stepping up in time with El Ninos.
I am not particularly invested in their hypothesis, only in the fact that they have taken a novel approach (k-lines on ENSO) and used it to back-forecast surface temperature fairly closely — both in time (16 years is not particularly large) and 0.1 degree c is pretty close over 150 years. (better than current models, I think).
Ignoring the details and focusing on the concept of ““ocean stabilization machines” (OSM).” is, if nothing else, extremely interesting.
I’m happy to be in agreement with you on this awful work.
Percy, I was referring to your assessment of this cyclomania.
Give me a break!
We shouldn’t even be discussing this example of shameful trash science.
Too many people working in science in the world. Too few of them real scientists correctly using the scientific method and producing quality science. The result is mountains of scientific articles being published every month that nobody reads.
My only complain about Kenneth Richards is that he should discriminate a little bit more. You damage your standing by picking articles like this one. It means you have no quality criteria whatsoever.
All of this just shows that the future isn’t what it used to be!
My future used to feature flying cars and rocket packs… Instead I got a PC and Smartphone… 😉
Perhaps the paper has a use as a citation to President Trump’s often cited statement that global warming is a hoax perpetrated by the Chinese.
One of the authors, Jiqing Tan, developed the k-line idea with ENSO back in 2015. The paper presented here builds on that work.
It’s a silly piece of work, but that’s climate science for you. Hey, it’s a “novel approach.”
Extrapolation of a curve fitting of an incomplete curve
Next.
Sounds like it’s time to go in search of the coming ice age again. Only who will take over for the Late Leonard Nimoy?
So Mao et al claim to have found 15,000 periodic oscillations that “perfectly” fit the temperature record of the past 170yrs and explain all the warming and cooling! Sceptic or phlogistonian mainstream – neither gets away with this level of hyperbole on this site.
Explains why the Tremometers guys who moved, after hide the decline, moved to air temps now find a zeal for ocean heat content. A ignore the decline.
Global warming ended in 2016. See these two posts, 10,000 reads in the last 4 days, by an actual geologist …
https://www.iceagenow.info/geologist-the-sun-not-co2-drives-earths-climate/
https://www.iceagenow.info/ipcc-fatal-error-neglecting-ocean-thermal-inertia/