Guest Post by Javier Vinós
No minimally informed person denies that climate changes. The climate has always changed. Since 1860 the predominant climate change has been warming, which is fortunate because if we had a winter like those of 1800-1850, we would be in for a shock. No one has been able to prove that global warming is primarily a consequence of our emissions. It is reasonable to assume that increased CO2 has contributed to warming since the mid-20th century when our CO2 emissions increased significantly, but no one knows how much they have contributed, no matter how much the Intergovernmental Panel on Climate Change (IPCC) insists that “humans are the dominant cause of observed global warming over recent decades.” (IPCC AR6, page 515).
There is no evidence for this statement. I know this because I have read thousands of scientific papers looking for it. And no, computer models are not evidence of anything but the programming skills of their authors. Models and their predictions are constantly changing and when our knowledge of climate changes, they must be redone.
The absolute lack of evidence contrasts sharply with the decision to cut our CO2 emissions to zero by completely changing our fossil fuel-based energy system and calling CO2 a pollutant—when it is as essential to life as oxygen. All this while most of the world doesn’t give a damn about emissions and many are only on board for the promised money.
To get to the good news about global warming we need to look at variations in the rate of global warming, i.e., the speed of warming. Today we are going to use satellite-calculated global temperature data from the University of Alabama in Huntsville, UAH 6.0. They are plotted in Figure 1.
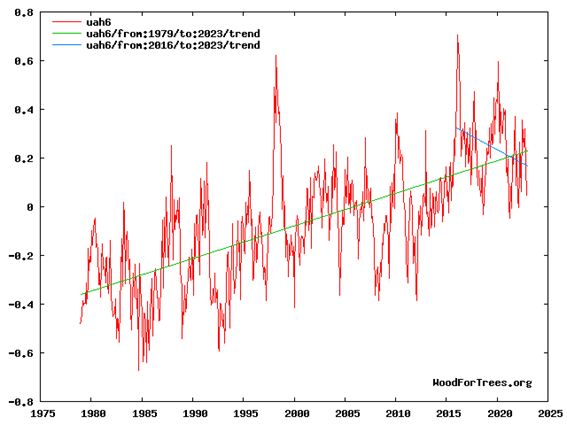
As we can see, the temperature trend decreases since 2016, so 2022 is the seventh warmest year. For 7 years the planet has been cooling. Does that mean that warming is over? No, periods of 7 years of cooling are frequent in the record, there being 8 of them since 1979, and the warming continues. But there is only one period of more than 15 years of cooling, from 1998 to 2014, that appears in the record for the last 45 years. It is known as the “Pause.”
To analyze the evolution of the warming rate, we subtract from each monthly data the previous one to calculate the monthly increase. We then deseasonalize the monthly increase by finding the 12-month moving average to remove a lot of the noise. Finally, we calculate the 15-year average warming rate in °C/decade by calculating the 180-month moving average and multiplying the resulting data by 120.

Each point on the curve in Figure 2 is the warming rate for the 15 years before that month. The Pause shows up prominently as the only period with a negative rate. For the current cooling period to appear on that graph with a negative rate would require the global temperature to remain below the 2016 level at the end of 2030.
But the good news that no one is telling us is that global warming is slowing down. The 15-year rate was very high from the mid-1980s to the late 1990s, reaching 0.35 °C/decade. The average over the entire period of satellite records is 1.3 °C per century or 0.13 °C/decade, but the long-term trend has fallen from 1.6 °C/century to 1 °C/century today. The current cooling period is contributing to this decline in the long-term warming rate.
This good news is not told to us, firstly, because it has been achieved without doing anything to reduce our global CO2 emissions, which calls into question the peremptory need to make a major effort to reduce them.
Second, we are not told this “good” news because the reduction in the rate of warming has taken place while rate of increase of atmospheric CO2 is accelerating, as shown in Figure 3. The data from NOAA has already been deseasonalized, so we skipped this step. We follow the same process for the same period (1979-2022) as for the graph in Figure 2.

The problem with the theory of anthropogenic warming is that while the rate of warming is slowing down, the rate of change of atmospheric CO2 is steadily increasing, and in the same period it has gone from growing 14 parts per million (ppm) per decade to 23.5 ppm/decade. In other words, its growth rate has almost doubled.
According to the greenhouse gas climate change theory, it is not possible for warming to slow down while CO2 is strongly accelerating. The consequence of the CO2 increase on the greenhouse effect is well known. Each additional molecule intercepts infrared radiation, raising the average height of emission from the atmosphere and requiring an increase in surface temperature for the planet to maintain its radiative balance, that is, to radiate an energy equivalent to that which it receives from solar radiation. The theory does not allow global warming to slow with accelerating CO2 emissions. The theory is wrong or incomplete. There are fundamental things about climate change that we do not understand, that are capable of offsetting, canceling, and even reversing the effect of the CO2 increase on temperature. I have already proposed an alternative, which is not considered by the IPCC, in the Winter Gatekeeper hypothesis, based on changes in poleward energy transport.
Thirdly, we are not bombarded daily with the good news that global warming is slowing down because the models predict just the opposite, which indicates that despite costing a fortune these models are useless. The 5th Coupled Model Intercomparison Project (CMIP5) was already projecting greater warming for the period 2006-2022 than has been observed. To the dismay of climatologists (Voosen 2022), the changes introduced in the CMIP6 models cause much more warming to be projected, so they have decided that, instead of averaging all models as was done in CMIP5, only the coolest ones should be averaged. Even so, the deviation between models and reality becomes more unbearable with each passing year (Figure 4).

Other good climate news
2022 has been full of more good climate news that we haven’t heard about.
In September, sea ice reached a minimum extent of 4.87 million square kilometers in the Arctic. This is higher than the extent in 2007, which means the Arctic summer sea ice trend is zero for the past 16 years (Figure 5). We were told ad nauseam that the Arctic was melting, and Greenpeace used it to raise money from the unwary. Well-intentioned money which it used, among other things, to maintain the high lifestyle of its executives. The Arctic melted significantly between 1990 and 2007, but it has not done so for the past 16 years, and I don’t think it is because of the money given to Greenpeace.

With data available till September, sea level has risen only 2 millimeters in the first 9 months of the year. The decreasing sea level rise trend over the last 10 years continues (Figure 6). This indicates that sea level rise is probably linked to temperature rise, which is logical. Therefore, sea level rise models are at least as wrong as the temperature models, and those sea level rise figures of one meter or more that the media are trying to scare us with are ridiculous.

It must be said that satellites measure a rate of sea level rise that is about twice that recorded by coastal tide gauges. Either the sea is rising more in the center than on the coasts, or there is a problem in measuring sea level rise to the center of the Earth that does not take into account what is happening at the bottom of the oceans.
In any case, the ridiculous sea level rise is only a problem in areas where there is subsidence by human action, due to groundwater extraction or excessive coastal construction. As an example of the non-existence of a serious problem here are two photos separated by 45 years of the same building located just 10 meters from the shore of the Mediterranean Sea, where I spend my vacations (figure 7). Coastal erosion has affected the profile somewhat, but the sea level does not appear to have risen detectably. The local Alicante II tide gauge shows a sea level rise of about 10 cm in 60 years or one-and-a-half millimeters per year.

Despite all the continuous claims that climate change is making extreme events more intense and frequent, there is no data to support this, which is why the data are never presented. The IPCC reports do not conclude that extreme events are getting worse, except heat waves, which are definition dependent.
2022 has been a very quiet year in terms of hurricanes, continuing the downward trend since the mid-1990s in both frequency and energy (Figure 8).

I have already mentioned on occasions that in a warmer world, the temperature gradient between the equator and the poles is smaller, reducing the amount of energy to be transported and the intensity of atmospheric circulation, so we should not expect warming to increase the frequency of extreme events, just as we should not expect the global precipitation level to decrease.
Conclusion
2022 has been a good year in terms of climate, and it also reaffirms the positive trends toward a reduction in the intensity of climate change in many of the main indicators: temperature, Arctic sea-ice extent, sea level, and extreme phenomena. Let us not be fooled by those supported by our taxes. We have nothing to fear from climate change now or in the foreseeable future. Richard Feynman, one of the best physicists of the 20th century, said in 1966 that “science is the belief in the ignorance of the experts”, and Stuart Firestein teaches us that ignorance is the fuel that makes science advance. Those who believe they know what is wrong with the climate, who refuse to accept their ignorance, are not advancing science, but hindering its progress by slowing it down. They do not deserve to be called scientists because they do not serve the cause of science, which is to increase knowledge. They are only trying to line their pockets by defending an orthodoxy of clear political interest. It is clear why the climate panel is called “intergovernmental.”
Lightly edited by Andy May
Despite Michael Mann’s proxy games, we are coming out of the Little Ice Age, which was known for war, plague, and famine. Warming from that point has been a net good, thus far.
Very O/T so tip rather than comment for here
Have a look at the first set of photos here
https://sfstandard.com/technology/these-doctors-pushed-masking-covid-lockdowns-on-twitter-turns-out-they-dont-exist/
Via http://www.smalldeadanimals.com/2023/01/06/on-the-internet-nobody-knows-youre-a-dog/
Where I got in a mention of Anthony’s dog and membership of the Union of Concerned Scientists
Fakers all over.
Climatereanalyzer has global warming now at +0.63K, vs 1979-2000 basis. And that consists of..
+1.34K NH
-0.08K SH
https://climatereanalyzer.org/wx/todays-weather/?var_id=t2anom&ortho=1&wt=1
This is insane if you think about it. We have NH warming, but none or barely any in the SH. And as the scissor opens up ever more, it is about time to ask some serious questions. GHG driven warming should be global after all.
Instead if we take a step back and look at the bigger picture, things only become worse.The north-south divide is only more solid when we compare the first vs. the last 20 years of the GISTEMP v4 record.
Aerosols are conveniently used to explain why the warming in NH has sped up so much. Still, according to the IPCC they cancel about 1/3 of GHG forcing. And they were at very low levels in the late 19th century. By comparison aerosols (or pollution) should have cancelled all GHG forcing in mid NH latitudes over the whole period. Instead it is there where we have most warming. Reality is exactly the opposite of what the orthodoxy theorizes..
https://greenhousedefect.com/contrails/aerosols-in-climate-science
I looked at that a couple of days back and thought the exact same thing. But I don’t think anyone is going to get a satisfactory answer, because all they want to do is blame humans.
Blaming humans is the means. The end is playing grownup.
I knew an astrologer who was really smart, too smart to be a good student, and had wanted to be an engineer or scientist or something. But she flunked out of college in her quest to learn too much all at once, and discovered astrology had all those books and formulas and data to research, and it was off to the races. She admitted she could give better readings face-to-face without knowing a birth date than blind with accurate birth date and time and location; in her heart of hearts, she know it was all bunk. But it had all the trappings of being an engineer or scientist, and that was all that mattered.
Same with all these bureaucrats, which is what climate alarmunists ultimately are. They see Hollywood depictions of businessmen barking orders, firing and hiring, threatening, and they think that is how actual business is conducted. Forget all the paper plowing that is really required, just yell a lot.
They just want to play grownup. Have some pity on the poor fools.
The oceans really show this effect and how it has increased.
https://woodfortrees.org/graph/hadsst3nh/from:1990/to/plot/hadsst3sh/from:1990/to/plot/hadsst3sh/from:2001/to/trend/plot/hadsst3nh/from:2001/to/trend
. “GHG driven warming should be global after all.”
Not even close to being true.
GHG strongly affects the colder northern half of the Northern Hemisphere, especially the Arctic
GHG least affects the tropics
GHG face more thermal inertia from oceans in the Southern Hemisphere than in the Northern Hemisphere
Greenhouse gases can not warm Antarctica:
Rising atmospheric carbon dioxide actually cools most of Antarctica
“Local weather conditions, altitude to blame for counterintuitive trend
In a world where most regions are warming because of increasing concentrations of atmospheric carbon dioxide (CO2), central Antarctica has been cooling slightly in recent years. Greenhouse gases such as CO2 typically trap heat radiated back toward space from the planet’s surface, but large swaths of the East Antarctic Ice Sheet (the broad pink mass on the right side of the image) are, on average, actually colder than the upper layers of the atmosphere for much of the year—the only place on Earth where that’s true. When the team looked at the overall balance between the radiation upward from the surface of the ice sheet and the radiation both upward and downward from the upper levels of the atmosphere across all infrared wavelengths over the course of a year, they found that in central Antarctica the surface and lower atmosphere, against expectation, actually lose more energy to space if the air contains greenhouse gases, the researchers report online and in a forthcoming Geophysical Research Letters. And adding more CO2 to the atmosphere in the short-term triggered even more energy loss from the surface and lower atmosphere there, the team’s climate simulations suggest. The topsy-turvy temperature trend stems, in part, from the region’s high elevation; much of the surface of the ice sheet smothering East Antarctica lies above an elevation of 3000 meters, so it is much colder than it would be at lower altitudes. Moreover, that region often experiences what meteorologists call a temperature inversion, where temperatures in the lowest levels of the atmosphere are cooler than those higher up. For the lower-altitude fringes of the icy continent, and for the rest of the world (even Siberia and Greenland), the greenhouse effect still works as expected.”
SOURCE OF QUOTE:
“Rising atmospheric carbon dioxide actually cools part of Antarctica | Science | AAAS
Amazing, every word of what you just said was wrong
The GHE is the strongest in the tropics and the smallest at the poles. In fact it even turns negative in Antarctic winter. What you confuse with the GHE, which is only about the reduction in emissions, is the total energy budget. It is true that relative to solar input the tropics are cold and the poles are very warm, especially in winter. This is of course because of the meridional heat transport, which however has nothing to do with the GHE per se.
What is true for the GHE, is also true for any enhanced GHE. So forcings and feedbacks are again the strongest in the tropics, and the weakest at the poles. And that is also the theoretic foundation to claim increases in CO2 would not heat Antarctica. Not to mention the obvious contradiction in your arguments, that you should have noticed yourself.
Anyway, Antarctica and the Arctic are not so different after all in this regard. In both instances CO2 should barely cause any warming there, especially not in winter. And while the south pole indeed does not warm, the north pole is heating intensely, and that is in winter, not summer.
The closer we look, the more trouble the orthodox theory runs into.
Your insults aside, I am trying to explain observations of climate change measured by satellites since the 1970s. You are making seemingly random off topic claims, and claims about CO2 effects that do not match observations. That is not science.
You attack the consensus science but offer no alternative.
It is much easier to be critical than it is to be correct.
I was not talking about the total greenhouse effect.
I was talking about a CHANGE in the greenhouse effect from added greenhouse gases added in the post-1975 period.
I have compared the expected pattern and timing of warming from added CO2 with the actual pattern and timing of warming observed since 1975.
I find the expectations are similar enough to what was expected from adding CO2 to the troposphere, as to be evidence that added CO2 is causing some portion of the warming since 1975. I have no idea how much. Nor do you.
If forcings and feedbacks are strongest in the tropics, then you must explain why the tropics have so much less global warming than the Arctic since 1975.
By your “logic” the tropics should have the largest increase of warming since 1975. That did not happen. Maybe it did in your mind, but not in reality.
The global atmospheric system is a natural system that acts to reduce the extreme heat difference between the equator and the poles. As the air is moved around, it prevents the equator becoming increasingly hotter.
Climate change has triggered a rapid loss in sea ice in the Arctic region, which in turn has amplified global warming. Bright white sea ice reflects solar energy back to space, but when it melts, the dark ocean absorbs that heat. This stromg amplification effect has not happened in the Southern Hemisphere.
You claim added CO2 should barely cause any warming in the Arctic. But the Arctic has had a lot of warming since 1975.
What is YOUR explanation for that actual Arctic warming, that does NOT include added CO2 ?
The exact amount of global climate change from the change in the greenhouse effect is a mystery to everyone.
But the expected pattern and timing from such a change is not mystery, and is similar to the actual pattern and timing of warming since 1975.
Is that just a coincidence?
Let’s hear your answer, Mr. Smarty Pants.
The CHANGE in the greenhouse effect from more CO2 should be strongest where the atmosphere is colder, and drier, and weakest where the atmosphere is warmer, and therefore holds more water vapor.
That is because CO2 competes with water vapor as a greenhouse gas. (Methane competes even more with water vapor).
That’s why the added CO2 should, and does, most affect the northern half of the Northern Hemisphere, mainly in the colder months of the year, mainly at night (TMIN). It is cold and dry then.
And that’s why the added greenhouse gases can not affect the tropics much mainly during the warmer months of the year, mainly in afternoons. It is too hot and humid then.
Because there are more oceans in the SH hemisphere (80% versus 60% in the NH), the SH has more thermal inertia and therefore warms slower than the NH.
In addition, there is the permanent temperature inversion over most of Antarctica, which has prevented any warming from greenhouse gases since the 1970s, That was discussed in the long quote in my last comment.
Have a nice day.
And the reason infrared spectroscopy of CO2 is done with artificially dried air, is that water vapor and CO2 have some overlapping absorption wavelengths. That is even more true of methane and water vapor.
An even simpler argument, at your level, is that CO2 is one of MANY climate change variables.
Those variables are global regional and local.
Climate change is the net total of ALL climate change variables.
That means CO2 does NOT control the global average temperature — it is just one of many climate change variables.
As a result, there is no reason CO2 changes MUST be accompanied by similar temperature changes all over the globe.
Finally you hit home. The part about Simple arguments for the public school dumbed down masses and the army the left brainwashes with government funded college indoc…ahh educations, e.g. if we just control the masses life style we can control the output of CO2 (AND OTHER VARIABLES) and ergo control the climate. All will be well with the world, i.e. no warming, no cooling, no hurricanes, no tornadoes. and if real scientists push back we will call them deniers and then deny that we ever claimed that weather (hurricanes et al.) could be conflated with climate. We will control the narrative with a big old helping hand from the barking dogs in the legacy media who will bark on demand and be quiet on command.
Every time someone points out the asymmetry in NH/ SH I ask the same question: When last did anybody actually measure the ant/arctic circles? The simplest, most logical explanation for the asymmetry would be an earth dipping below the solar meridian. This would contract the arctic circle, and expand the antarctic circle. This would make it warmer in the north, colder in the south.
I do not pretend at professional journalism or sciencery, but before I discovered WUWT, I had to rely on my own logic only. Add the fact that I was still figuring out how my website works, and a total lack of graphics software, necessitating drawing pictures in MSWord, please forgive the childish presentation of the following:
https://www.greenpets.co.za/index.php/en/2-greenpets-natural-happiness/136-climate-change
“This would contract the arctic circle, and expand the antarctic circle”
There is a reason why both polar circles are at the same respective latitudes. It is not an incident. Earth can not dip below (or above) the solar meridian!! That would be a violation of basic gravitational physics.
As far as your own logic goes, I would not rely too much on it 😉
I am but a simple man, always accepting correction. So you teach me that there is some universal divine command that every planet orbits in exactly the same plane as every other? My own, faulty logic has led me to believe there is some variation.
Next, you will tell me the sun spins absolutely still at the centre of the universally flat solar system in its allotted orbit around the galactic centre,so I will leave before you burst that bubble for me too.
But I admit to editing that post until I got the differences absolutely wrong…
These are two different things. Orbits can be different, although all 8(!) planets of our solar system are on the same (akkretion-) plane. With Pluto already that is a different story, not to name numerous other objects like comets.
But returning to your initial argument, all these orbits have the sun in their center. The sun is neither above, nor below their orbital plane. And I am sorry, but this kills your argument.
Meridional transport of energy is very asymmetric on Earth. This is due in part to Antarctica’s isolation by the Antarctic Circumpolar Current and the Southern Annular Mode; and in part to the irregular distribution of continents and mountain ranges, with most of them in the NH.
As the planet warms we see more energy being transported to the Arctic, where anomalies can be crazy, of dozens of degrees, dominating the record, particularly during the NH winter. This is funny because that energy is leaving the planet, being radiated to space in the long polar night. Another one of the many negative feedbacks that dominate the planet’s thermal homeostasis and make the idea of dangerous global warming ridiculous.
CO2 changes cannot explain hemispheric differences. If we put meridional transport of energy into the equation hemispheric differences can be easily explained.
Aviation induced cirrus are still are far more better explanation.
Along with the aviation flights comes more CO2, which further enhances cooling. The CO2 will linger much longer than the circus.
You attack my comment and then become a contrails conspiracy nut? I can’t stop laughing.
Contrails are composed primarily of water (in the form of ice crystals) and do not pose health risks to humans. They do affect the cloudiness of the Earth’s atmosphere, however, and therefore might affect atmospheric temperature and climate.
Contrails that are present during the day generally reflect more solar radiation, essentially acting as a shield for the planet. That has a net cooling effect. Those same contrails, however, could lead to warming a few hours later at night, when that solar radiation is absent.
New research out of the UK has found two silver linings in the cloudy conundrum. The first is that just 2.2 percent of flights create 80 percent of contrail-related warming. According to a January paper in the journal Environmental Science & Technology, the troublemakers are mostly flights that take off in the late afternoon and early evening, whose contrails live mostly during the night—when they still trap some heat but can’t deflect any sunshine (which can balance out their impact). “The effects at night are purely warming,” says Marc Stettler, the lead author on the paper, Mitigating the Climate Forcing of Aircraft Contrails by Small-Scale Diversions and Technology Adoption.
How important are contrails?
1940 to 1975 — contrails up and temperature down
1975 to 2015 — contrails up and temperature up
2015 to 2023 — contrails up and temperature steady (UAH)
Answer: Contrails are not very important as a climate change variable
Javier – yes, the northern and southern hemispheres are hugely different in surface properties given that most of the planet’s land area is in the north.
A lot of people seem to get confused when it comes to differentiating thermal energy content and measured temperature. Water has a specific heat content of over 4 kj/kg deg C, about 4 times that of land at under 1 kj/kg deg C. Land is more dense than water by a factor of about 2.5, but green vegetation which covers most of the land is only slightly more dense than water and has about the same specific heat as land. Land covered by snow and ice has the same specific heat capacity as liquid water.
The net effect is that on water surfaces the surface temperature varies with thermal energy input or output at about 1/4 the rate of land, with the exceptions being bare rock or soil and urban development (the urban heat island effect). The solar thermal energy inputs in north and south may be the same on an annual basis, but the rates of surficial temperature change due to solar energy inputs are much less in the south than the north.
Of course as you pointed out there also are large differences in ocean currents and thus in meridional energy transfer, plus of course differences in vegetative cover and albedo between north and south. The global climate system is really just the sum total of regional climate systems, all of which are extremely complex and only barely understood. The silly notion that one minor atmospheric trace gas is the temperature control knob for the entire planet is laughable and certainly not proven with any dataset known to mankind. It is simplistic thinking to believe that.
“but the rates of surficial temperature change due to solar energy inputs are much less in the south than the north.:
But solar energy is not increasing, as measured at TOA, by NASA satellites since the 1970s.
Also, the NH is 60% oceans and SH is 80% oceans — is that enough to explain the large +1.5 degreed C. difference in absolute average temperatures of the two hemispheres?
At the surface, it seems to be,…https://phzoe.com/2022/06/24/7-decades-of-net-solar-radiation/
That could only be caused by changes in cloudiness and changes in atmospheric aerosols (pollution)
Yes, so more sw radiation could be causing the warming due to changes in cloudiness, not ghg
“CO2 changes cannot explain hemispheric differences. If we put meridional transport of energy into the equation hemispheric differences can be easily explained.”
But meridional transport is not new, and is just redistributing heat.
It is not creating heat like the sun does
It is not impeding cooling, like greenhouse gases do.
CO2 emissions are large since the 1970s,
Global warming is large since the 1970s.
Can you explain the increase of global warming without including increasing CO2 as one likely cause.
I think not.
There’s been global warming before, leading to the Roman Climate Optimum and the Medieval Climate Optimum. Before Modern Global Warming we had the Little Ice Age, which was the coldest period in 11,000 years. Modern Global Warming started at the coldest point of the LIA in the mid-1700s so it cannot have had much contribution from CO2 for 200 years. And there is no reason why natural warming must have stopped.
The fact that the stupendous CO2 increase over the last 50 years has not greatly accelerated climate change suggests that the CO2 role is overstated.
Meridional transport does not just redistribute heat. It takes energy from a part of the planet where the GHE is very strong, the tropics full of water vapor, to a part of the planet where the GHE is very weak, the pole in winter where there’s almost no water vapor and the surface is so cold that an increase in warmer CO2 molecules actually favors energy radiation to space.
It is like transporting energy from a planet with a strong GHE to a planet with a weak GHE. The more energy you transport the more energy the system loses and the more it cools down.
‘It is like transporting energy from a planet with a strong GHE to a planet with a weak GHE.’
Excellent analogy, sir.
While the average temperature does vary, all claims of global warming periods since the Holocene Climate Optimum ended 5,000 years ago are too small to be proven with averages of local climate proxies.
We know the Mann hockey stick is wrong but do not have accurate global average temperature compilations to prove it is wrong. That is just a very reasonable assumption.
Those local proxy averages result in temperature variations typically in a +/- 0.5 degree temperature range, which is certainly smaller than the margins of error for any of the individual local climate proxies.
Meridional transport (MT) is not new.
We have had global cooling with MT (1940 to 1975), global warming with MT (1975 to 2015, and a flat temperature trend with MT (2015 to 2023).
How could changes in MT have cause three DIFFERENT global average temperature trends in the past 83 years? (1940 to 2023)
True! That is unless you know about a) the flaws in calculating climate sensitivity (to CO2) and b) other far more potent climate drivers, that c) perfectly fit the warming pattern.
“The potential effects of contrails on global climate were simulated with a GCM that introduced additional cirrus cover with the same optical properties as natural cirrus in air traffic regions with large fuel consumption (Ponater et al., 1996). The induced temperature change was more than 1 K at the Earth’s surface in Northern mid-latitudes for 5% additional cirrus cloud cover in the main traffic regions.”
https://archive.ipcc.ch/ipccreports/sres/aviation/index.php?idp=40
“This result shows the increased cirrus coverage, attributable to air traffic, could account for nearly all of the warming observed over the United States for nearly 20 years starting in 1975.:”
https://www.nasa.gov/centers/langley/news/releases/2004/04-140.html
More contrails means more CO2, which means more cooling aloft. Contrails fade away, while CO2 lingers much longer and continues to cool. Those NASA & IPCC models are just that, models of toys which people play with.
No
And just like when you introduce more CO2 into the wintertime polar regions, it also cools the earth faster. CO2 is clearly a cooling gas also … https://www.youtube.com/watch?v=ztX0Lso6lBE
And don’t forget that more CO2 is helping the lower stratosphere to cool too, whether the CO2 comes from earth or contrails or maybe even flying saucers. Either way, the extra CO2 is welcome, because we are in a CO2 famine … https://www.youtube.com/watch?v=RLnQo8l-BHc
Average temperatures prior to 1920 are not fit for any analysis.
There were very few Southern Hemisphere measurements and even the NH was sparsely covered with weather stations.
Ocean measurements were even worse — mainly in NH shipping lanes.
At best pre-1920 is very rough estimates of the Northern Hemisphere, NOT an accurate global average temperature … which is only possible with weather satellites, post-1979.
There is more infilling pre-1920 than actual measurements.
Therefore, your chart is totally WORTHLESS.
Agreed Javier. I think that after the El Niño next year, the temperature will end up linking with the old pause. The tropics and the SH have gotten there; only NH remains warmer.
And no, computer models are not evidence of anything but the programming skills of their authors.
They are unverified hypotheses. No better, until the records of their whole time span is in hand and actually confirm their predictions.
That’s crazy, denialist talk. The climate models are the truth, the whole truth, and nothing but the truth for the Holy Church of Climate Apocalypse and their acolytes. It’s their holy sacrament. Observations and measurements are heretical. Galileo would recognize this century’s inquisitors.
The Inquisitors of the Holy Church of the Climate Apocalypse:
The computer games are deliberate climate scaremongering propaganda
The high ECS’s have been wrong since the 1979 Charney Report
If accuracy was a goal, the accuracy would have improved in the past 40 years, rather than getting worse., And the Russian INM model, which is the least inaccurate, would have received 99% of the attention, rather than 1%.
Shouldn’t that be “the programming skills of their authors – and their biases”?
Their unstated and unexamined assumptions.
Sincere question:
Has there been a full release to the public of every single line of code of any of the major GCMs or ECS models?
Well researched, documented and written—thank you Javier. The climate crisis house of cards is collapsing.
” …. house of cards is collapsing.”
I wish. The collapsing will only start when the MSM and the Politicos start to read papers like Javier’s and then report / act on them. Not much sign of that happening so far because at present the Bandar-log are still in charge.
It is getting out, albeit slowly, but without the Marxstream Media** involved. More and more people are voting with their feet and tuning out.
**thnx to Christopher Monckton for this one.
Nonetheless, it is collapsing.
Alarmists are getting more and more shrill in their religious bleating. Climate change is now responsible for every kind of weather imaginable from cold through hot, wet through dry, zephyrs through hurricane winds.
Ordinary people include nods towards “global warming” in their most ordinary of pursuits, everyday.
More and more of those people say “climate change” or “global warming” to see if someone they’re talking to, is a bit of a loon or common sense sensible.
When an ordinary person puts their meager life savings into a “hot” stock, they’ve usually bought stock at it’s peak.
Then as their stock value drops, while the owner watches years of difficult savings evaporate, they sell at a loss and ignore further stock advise.
Ordinary people have had it up to their eyebrows with panicked climate fear mongering.
As alarmists find/buy more and more channels for their “world is doomed” fright stories, more and more people tune the whole concept out.
This has been evidenced when ordinary citizens rank their worries with “climate” down near the bottom.
Even then, “climate” or “global warming” only makes the list because the poll taker gives few options to the poll taker.
When asked how much money should the poll taker put forth for combatting “climate change” or “global warming”, the amounts are less than $100 a year.
If the poll taker had to make a list instead of selecting from a small cadre of suggestions, I doubt either “climate change” or “global warming” would make their list at all.
Throw in a little Bidenflation or nut zero and those citizens might turn violent.
When alarmists start harping about “global warming” dangers, I remind them that alarmists have bleated that claim for well over forty years.
Plus over forty years of dire doom predictions track record is absolute zero during that whole time.
Some tell me that I lie. Some tell me that I am wrong and proceed to show Mann, desmog, sks, nutticelli, etc. molested graphics to prove their point. To which, I shrug and say where is the hard evidence instead of graphics with adjusted data or buggered axis increments?
There is none. The anomaly they claim shows warming has shown warming since the 1700s and is still a miniscule difference in temperature, most of the warming appears to be UHI caused, not CO₂ caused.
Their rants are just whines because Earth is experiencing a mild very temporary Optimum.
At some point very soon, the smart climate investors are going to drain their funds from the climate pyramid scam. Causing panic amongst smaller investors who will not only sell their investments, they’ll think they can win by selling climate investments short.
In the end, governments will drain taxpayers to cover the immense losses. Part of this process is where they will cancel subsidies. (After the politicians cash out)
Leaving the world full of near useless renewable energy virtue signals that no-one desires or will maintain.
Renewable energy is intermittent, transient, poor quality (amperage, voltage, frequency, reliability, consistency and usually a near useless DC current.
It is still useless at mining, smelting, refining, forming, machining, building, constructing industry goods, including the solar arrays or wind turbines themselves.
Meanwhile, polar bears, walruses, whales, penguins and even tigers are thriving.
What collapse?
Climate scaremongering is worse than ever
Nut zero is in progress
Big money is being spent on unreliables.
I’ve followed the subject for 25 years
There is no collapse.
The appeal to authority logical fallacy still rules in climate “science”/
Guess you didn’t Javier’s article either (points at the title).
Excellent post Javier, especially the 15-yr warming rate graph. Like the 7-year UAH data, the global 7-year surface temperature trend is also showing slight cooling. The global warming establishment is privately very nervous, which is why they keep coming up with new scare rhetoric like cyclone bombs and atmospheric rivers — all part of the propaganda game.
Thank you very much, Javier. That was clear and very readable.
I believe the reason the planet doesn’t match the greenhouse theory has to do with how radiation flows through the atmosphere. The view above is incomplete.
It is true that each additional molecule intercepts radiation and that forces the energy to slow as it passes through the atmosphere. What is missing is these additional molecules also extract more energy out of the atmosphere The net result is more energy moving upward at a slower rate. These two changes cancel each other out and no warming occurs.
A big aspect of the climate model problem is the way that they don’t match reality. They use something called ‘forcing’, which is driven by radiative exchange of energy. In fact, in a very real sense they model what would happen if the atmosphere was made of transparent treacle. In fact, huge air currents move energy through convection.
It’s no wonder that none of the models have been validated. They can’t produce correct predictions because basic assumptions used to create their model are invalid.
They can’t produce correct predictions because not enough is known about every cause of climate change. Any prediction that seems to be correct would just be a lucky guess.
And that’s assuming the future climate could ever be predicted. In my opinion, even with great knowledge about every climate change variable, predicting the future climate is likely to be no easier than predicting whether it will snow in Paris one year from today (impossible).
Global Warming, now called Climate Change, is a divisive political issue, often science-free. It has been hijacked by politicians, environmental pressure groups, and other leftists. Earth’s climate is always changing. ‘Climate’ is defined as average weather over a 30-year or longer period. The difference between the annual average temperature, and its 30-year average, is the temperature anomaly. Temperature measurements are not evenly distributed over the globe, especially over the oceans, and at high latitudes. Questionable schemes are used to extrapolate ( aka “infill” ) sparse data to approximate global coverage. Filling in data is making up data.
The following variables are likely to influence Earth’s climate:
1) Earth’s orbital and
orientation variations
2) Changes in ocean circulation
Including ENSO and others
3) Solar activity and irradiance,
including clouds, volcanic and manmade aerosols, plus possible effects of cosmic rays and extraterrestrial dust
4) Greenhouse gas emissions
5) Land use changes
(cities growing, logging, crop irrigation, etc.)
6) Unknown causes of variations of a
complex, non-linear system
7) Unpredictable natural and
manmade catastrophes
8) Climate measurement errors
(unintentional or deliberate)
9) Interactions and feedbacks,
involving two or more variables.
…plus the poor buggers seem not to be able to think in 3D. Their molecules tend to radiate in some directions more than others.
And I’m still waitying to see a climate model that includes the 47 corporations in America alone trying to alter the atmosphere with cloud seeding, tropospheric particulate injection, radiation…
Part of the problem here is that the models are based upon CO₂ atmospheric equal well mixed abundance in the atmosphere.
Except, that is not the case. CO₂ is a heavy molecule and stays low in the atmosphere, under 10km altitude.
https://youtu.be/EGQsBmzFM_g
The problem with the theory of anthropogenic warming is that while the rate of warming is slowing down, the rate of change of atmospheric CO2 is steadily increasing, and in the same period it has gone from growing 14 parts per million (ppm) per decade to 23.5 ppm/decade. In other words, its growth rate has almost doubled.
But NOAA is doing it’s best to distort the temperature record to show temperatures rising at the same rate as the increase in atmospheric CO2.
It seems to me though that game cannot go on despite the fact they work it a both ends, cooling the past and warming the present. Eventually they will get to the point where they are telling us a day with a high of 70 deg. F was a day with a high of 80 deg. F.
The “feels like” temperature will support the modern model of climate claims.
The historical temperature data are almost irrelevant
Predictions of climate doom are not based on any actual temperature trends in the past. We’d get the same scary climate predictions even if the historical temperature record was 100% accurate.
A climate emergency is coming in 10 years, and has been coming in 10 years since 1979, will always be coming in ten years, and don’t you forget it.
The divergence between the satellites/oceans and the land values can’t keep going on forever. It’s already getting ridiculous.
https://www.woodfortrees.org/plot/uah6/from:1990/to/trend/plot/gistemp/from:1990/to/offset:-0.5/trend/plot/hadsst3gl/from:1990/to/trend/offset:-0.35
Now let me see that’s 0.85 mm/yr at Port Arthur over 159 years according to CSIRO-
https://www.cmar.csiro.au/sealevel/sl_hist_few_hundred.html
and that checks out pretty well with Fort Denison in Sydney Harbour according to NOAA and allowing for the error-
https://tidesandcurrents.noaa.gov/sltrends/sltrends_station.shtml?id=680-140
I can’t see the movers and shakers on the waterfront at Point Piper etc firesaling and heading for the Blue Mountains just yet.
If there was no warning for 15 years after 1998, and there’s now been no warming since 2016, doesn’t that mean there has been 22 of the last 24 years showing no warming? And CO2 has gone up each year since 1998. Sure seems like CO2 has no meaningful effect on temperature.
One could say there has been no warming since 1998, because 2016 is statistically tied with 1998 for the warmest year in the satellite era, so CO2 has increased a lot since 1998, but the temperatures have never gotten warmer than 1998, and currently the temperatures are about 0.6C cooler than 1998/2016.
The alarmists were thinking the temperatures would continue to climb after we hit the highpoint of 1998, but Mother Nature threw the alarmists a curve and temperatures started cooling even though CO2 was increasing, so I think this is what spurred NOAA and NASA to start bastardizing the surface temperature records in earnest, declaring just about every year beyond 2001 as being the “hottest year evah!”. Meanwhile, according to the UAH satellite chart, none of the years between 1998 and 2016 could be said to be the “hottest year evah!”.
See if you can see any “hottest year evahs!” between 1998 and 2016 on this UAH chart:
Nope, not a one of those years is warmer than 1998, yet that’s not what NASA and NOAA say. NASA and NOAA are lying by mannipulating the temperature data to sell a political narrative.
As one could say the moon is a balloon.
One might not expect to be taken seriously (except here).
Well, a lot depends on who is not taking you seriously.
I claim it is 24 of the last 25 years. Here’s how it looks from 1997 with that one warming year separated out.
https://woodfortrees.org/plot/uah6/from:1997/to/plot/uah6/from:1997/to:2014.5/trend/plot/uah6/from:2015.5/to/trend/plot/uah6/from:2014.5/to:2015.5/trend
Land temperature (GHCN) and Global temperatures (HADCRUT4) plotted as a function of CO2 levels.

GHCN-Daily agrees with Berkeley Earth Land temperatures. Normalised to 1961-1990 baseline (Clive Best 2019):
Problem – CO2 levels are basically a function of time. Falsifications (
homogenisation) of temperature are also very time dependent, so a plot like this doesn’t say what you think it says.Yeah, why use falsified temperature data to do comparisons?
What do you learn from that? Answer: Nothing.
I’m not claiming it says anything.
But that’s what the hysteria is about and if there were a direct relationship that’s what it looks like thus far.
If two quantities are increasing with time with no discernable linkage (for example, global temperature and the Dow-Jones average) you could generate this same graph. You’ve assumed the causation the graph purports to prove. Sorry, not impressed.
Excellent post, Javier. I could not have said it better myself. Do you mind me reblogging this on my site?
Do you think the 1000 year Eddy cycle could have something to do with the deceleration of warming?
https://breadonthewater.co.za/2021/03/04/the-1000-year-eddy-cycle/
I’d be pleased if you reblog it, Henry.
I think the deceleration of the warming is related to the 1997 climate shift towards a climate regime of high heat transport to the Arctic. The cause is likely to be the decrease in solar activity after solar cycle 23, entering a low-Niño ENSO phase, and the AMO ending its rising phase. The warming deceleration should intensify when AMO starts decreasing. That might result in a couple of decades of cooling.
“That might result in a couple of decades of cooling.”
Kind of like what happened after the 1940’s.
The Earth’s climate warms for a few decades and then it cools for a few decades and then it repeats. Or so recent history tells us.
So we may be entering the cool phase of the cycle, and CO2 so far, hasn’t been able to change this course.
The alarmist are going to be under a lot of pressure if the rate of warming decreases, and it looks like we are headed in that direction. The next few years will be very interesting when it comes to the Earth’s climate. Somebody is going to be shown to be wrong.
Our economies are in a shambles, and we are all financially broke, trying to reduce CO2, and then the alarmists say, “Oops, we were wrong! Sorry about that!
Agreed. I predict that 2030 will be cooler than 2020. Maybe that means the climate scam will end this decade. The question is what will happen to Michael Mann, Gavin Schmidt, and the others. Will they just fade away and never be heard from again?
Well, the Data Mannipulators (Mann or Hansen, I forget which) said back when the Pause first became an issue, that a couple of decades of cooling would not mean that the human-caused climate change theory was wrong.
But, I think a couple of decades of cooling would pretty much put the theory to bed. Maybe sooner, in people’s minds.
We’ll know in about 7 to 15 years, unless we end up as Paul Ehrlich’s cloud of blue smoke or AOC’s end of the earth.
Just a guess, but Ehrlich exits the debate before or within that time.
Yes, 2030 is supposed to be the breaking point for all these dire predictions. Getting closer. The weather looks nice around here.
The Climate Scam has taken on a whole new level since Dementia Joe took office and the real puppet-masters are now in charge, pulling the strings. Elevated to positions of real power over the Federal bureaucracies, these Klaus Schwab WEF globalist-Socialists are running full steam with an intent to destroy capitalism and are now running powerful US Govt agencies…
all while Dementia Joe smiles and eats ice cream on his never-ending vacation.
We now see the climate scam and alarmism all over everything. Destroying America. Post haste.
Climate change caused you to write that comment.
Climate change causes everything bad, from cancer to warts.
Except good weather.
Wonderful post, Javier! It should be required reading for students; you’d just have to tape copies on the inside of their horse blinkers!
In other good climate news I see that San Fransicko just the highest ten-day rainfall total since the record in 1871! Over 10” in ten days; if their not careful, some of the permanent drought mongers might drown!
…some of the permanent drought mongers might drown!
What wonderful irony.
I just heard the Fox News weatherman say California had been in drought for decades.
Where was he the last time the Pineapple Express (the so-called atmospheric river) came along? It’s been more recently than decades ago. A couple of years is a closer guess.
Fox News seems to be emphasizing “atmospheric rivers” and “bomb cyclones” and “150 million people are at risk!” for some reason. Following the alarmist crowd, I guess.
At least Fox News isn’t claiming we have a Category 4 Atmospheric River hitting California, as it was described by another media outlet. Just making things up.
Fox News weather reporting has gone full alarmist for the past year or so. Some changes need to be made.
I think it might have something to do with their new Fox Weather Service, which they are promoting, and scaremongering gets attention.
And I can’t name one Fox News host that questions the premise that CO2 is changing the Earth’s climate. Just like Republicans. I can’t think of one that challenges the premise.
I’m feeling kind of lonely. 🙂
I’m surprised he didn’t say, “and the drought is really bad in Nevada.”
US Heat Wave Index has increased over the last 30 years. But it only increased at half the rate as it did in 30 years leading up to 1950’s. In between it declined for 30 years by about the same as the last 30 year increase.
IPCC states heat waves have increased since 1950, conveniently leaving out the strong pre 1950’s. 46% of current US state high temperature records were set in summers of 1930 thru 1936. Only 3 have been set over the last 22years.
I know this is just the US, but our long peaceful agricultural focused record keeping has disproportionately affected world climate records.
https://wattsupwiththat.com/2019/09/06/the-gestalt-of-heat-waves/
But you have not got it: What the Führer (Klaus Schwab) tells you that is the actual “truth”!
This is an excellent article. Definitely the best so far this year. I read about 12 climate science and energy articles every day, so that would be over 4,000 articles a year. Maybe that makes me somewhat qualified to judge? At first I was disappointed that the author was too polite to leftist climate “scientists”, but the last paragraph solved that concern.
Climate computer games are programmed to scare people. That’s why CMIP6 is worse than CMIP5. And CMIP7 will be worse than CMIP6 — because accuracy does not matter when your goal is to scare people.
In my opinion, based on climate proxies, Earth’s climate is best during interglacials, when the temperature trend is warming, rather than cooling. That’s where we are now. The current climate, in my opinion, is the best climate for humans, animals, and especially C3 plants, in the past 5,000 years, since the Holocene Climate Optimum ended.
We should be celebrating the current climate and hoping it gets slightly warmer in the future. While those pesky leftists get hysterical over the future climate, for no logical reason. We love global warming here in Michigan!
I wonder if global warming will cause Jim Harbaugh to leave Michigan.
Why not take advantage of climate scaremongering to make some money?
I am doing two scientific studies that will result in books that will make me rich and famous, and maybe even win a Nobel Prize:
(1) “Climate change will kill your dog!”, and
(2) “How to fight climate change by living in your car trunk”
I have self-published a short story on “How Global Warming Causes the Heartbreak of Psoriasis.”
With the USA/UK time difference I have only just seen this report. I have some reservations about Fig 6 (Sea Level) rises. My previous papers on this criticized Nerem et al on using short time periods and I feel Fig 6 may be misleading in presenting annual rises and trends over a short (10 year) period.
I am unable to do a detailed analysis to show this until later as I am expecting my family to arrive soon to celebrate my 85th birthday!!
I will do some work later and submit my findings what ever they show.
I’m not shooting the messenger but probably shooting one part of an excellent article.
Alan,
Remember figure 6 is a running 15-year trend of tidal gauge data from NASA. Start with the same data and use the same procedure that Javier describes. You will get different results with satellite data. The changes in sea level are so small that error swamps any attempt to get trends.
Happy Birthday, Alan! Many more to come.
Alan, happy birthday.
Yes, it is a very short record of only 10 years, and probably the average for the entire decade is about the same for the satellite-measured sea level rise since 1993, a little above 3.4 mm/year. But my point is that it is good news that sea level rise is not accelerating, and the small rise in 2022 contributes to that. Since all the scary predictions about sea level rise depend on a significant acceleration over time, the 2022 data contributes to dispelling that silly tale.
Anyone wanna take a bet that we will never see the level of the 2016 El Niño spike again?
I don’t know if never is the right word.
If we look at the historical, written temperature record, it appears it was just as warm as the year 2016, in the years 1998, the 1930’s and the 1880’s, going by the U.S. surface temperature chart.
Hansen 1999:
So, going by that, I would say we probably will reach the level of 2016 in the future, a highpoint that is part of the ongoing cycle. But then, if it is a cycle, it would take decades to reach that level we would expect it to cool again from there as it has done in the past.
If the temperatures were to climb to the level of 2016 in the next couple of year and then exceed that point, then it might be time for skeptics to reassess the situation. But I’m not expecting that to happen. But I could be wrong. 🙂
Time will tell. So far, time has the alarmists on the run as the Earth is cooling even though CO2 is increasing.
Thanks for the climate summary of 2022 and the final paragraph. That should be circulated among all students from grade five upward.
Thinking about it, the wisdom of Feynman, could be given and taught even sooner than grade five. Maybe start with Facebook mods…..
Well done Javier for this incredibly important and compelling climate trend data. The emperor’s new clothes or better – the climate priesthood’s new robes of doom – have never been more invisibly nonexistent and their nakedness more stark!
Do you consider that changes to the AMOC and Gulf Stream are part of why warming especially in the NH is slowing?
Yes, I think so. When the transport of heat by the ocean decreases heat accumulates at mid-latitudes, causing increased warming. Then some chicken little scientists start shouting the alarm because the AMOC is decreasing and Europe is going to freeze to death. Then transport activates and the heat moves North to the Arctic and the chicken little scientists are alarmed about unprecedented Arctic warming that is going to cause masses of polar air to move South, and Europe is going to freeze to death. All in between terrible heat waves that are going to cause Europe to melt in the summers.
The differences in the speed of warming between regions must necessarily be related to differences in heat transport, as CO2 is a well-mixed gas.
Thanks Javier! I noted a while back with amusement that in separate published papers, climate scientists identified both accelerated and decelerated AMOC flow as causes of warming! Having their cake and eating it.
Both can’t be right and it must be a deceleration of AMOC that slows meridional poleward heat transport and results in cooling. A lot of palaeo-oceanography has pointed to AMOC and fluctuations thereof as key to controlling climate of the whole NH, for instance in several episodes at the Bolling-Allerod – Younger/Dryas and Holocene inception. I think that AMOC is also connected with inter-hemispheric heat piracy if I’m not mistaken.
From the article: “No minimally informed person denies that climate changes. The climate has always changed.”
Yes, the climate is never exactly the same, but it is fairly consistent in a human lifetime, and no climate change has ever been connected to CO2.
Unfortunately, “Climate Change” has been substituted for “Human-caused Climate Change”, by alarmists, which just confuses matters. Deliberately, on the part of Alarmists, imo.
Yes, the climate changes minimally, and no, the changes have never been shown to be connected to CO2, human-caused, or otherwise.
Climate Change = Mother Nature
Human-caused Climate Change = Lies and Distortions.
There is a correlation, but it is very likely a spurious correlation.
From the article: “The absolute lack of evidence contrasts sharply with the decision to cut our CO2 emissions to zero by completely changing our fossil fuel-based energy system and calling CO2 a pollutant—when it is as essential to life as oxygen.”
Think about that for a while.
There is an absolute lack of evidence that CO2 needs to be controlled or regulated, yet our leaders are ruining our economies trying to eliminate human-derived sources of CO2. How delusional is that? What caused this delusion? The answer is, Climate Liars and Scoundrels caused this delusion, and the lies and distortions are ongoing.
The problem is that the media together with the politics have a strong trend in loving being hypnotized and deluded by the Climate liars and scoundrels.
Do they really trust these lies or have they some machiavelic afterthoughts in using them for a hidden agenda ?
The Media and politicians see the issue of human-caused climate change as a means to increase political power for the Left. And no doubt, some of them actually believe the propaganda, but that doesn’t change anything, as the end result is the promotion of an idea that CO2 is dangerous, when this has never been established as fact.
‘What caused this delusion?’
The Left. Since most of us Proles were more or less ok with our middle-class lives, the so-called ‘vanguard of the revolution’ has had to move on to other sources of agitprop, namely, race, gender, sexual orientation and ‘the science’, e.g., climate and public health to name just a couple of examples of the last category.
The Left with the help of some corrupt climate scientists.
Excellent post, Javier Vinós! Thank you.
My favorite snippet from the first paragraph is “…no one knows how much…”.
Exactly.
As I see it, the climate sensitivity to CO2 or to any of the non-condensing GHGs – whether the ECS (equilibrium climate sensitivity) or the TCR (transient climate response) or variations thereof – cannot be reliably differentiated from zero by any means we have available to us.
The key word is “reliably” – concerning which I have high regard for Pat Frank’s evaluation of the reliability of GCM global air temperature projections. (Most WUWT readers will know what I am talking about – his paper is here https://www.frontiersin.org/articles/10.3389/feart.2019.00223/full )
From the article: “The theory does not allow global warming to slow with accelerating CO2 emissions. The theory is wrong or incomplete. There are fundamental things about climate change that we do not understand, that are capable of offsetting, canceling, and even reversing the effect of the CO2 increase on temperature.”
This is the true state of climate science today.
We should not be destroying our economies based on this obvious lack of knowledge.
Alarmist climate scientists are harming the public when they claim certainty about how the Earth’s climate works, when there is no certainty. Politicians are taking harmful actions (destroying their economy) based solely on the unsubstantiated speculation of alarmist climate scientists. How crazy is that!?
I am a bit surprised the usual cast of anti-science trendology noise makers have not jumped all over Javier’s article like they do to CMoB’s. Maybe they were unable to find anything to nitpick, which would be another testament to the article’s quality.
“Maybe they were unable to find anything to nitpick”
I think that might be the reason.
“There are fundamental things about climate change that we do not understand, that are capable of offsetting, canceling, and even reversing the effect of the CO2 increase on temperature.”
For a guy who talks about what ‘we’ don’t understand about climate, who hasn’t demonstrated what the CO2 effect is on temperature, you are awfully glib about then claiming the things ‘we don’t understand’ are then capable of countering whatever CO2 effect that you didn’t specify.
Those claims are a hallmark of pseudo-science which allow you to think just about anything.
This allows you to say just about anything, which you have. Example:
“I have already mentioned on occasions that in a warmer world, the temperature gradient between the equator and the poles is smaller, reducing the amount of energy to be transported and the intensity of atmospheric circulation, so we should not expect warming to increase the frequency of extreme events, just as we should not expect the global precipitation level to decrease.” [my emphasis]
The warmer world we have lived in still hasn’t changed that much because the change in the equator to pole temperature gradient continued to range within 30-0C during 1970-2022.
You haven’t provided any reason to think this relatively unchanging temperature gradient can drive more or less extreme events. You aren’t doing science here Javier, you’re handwaving.
If you were to be convincing on this subject, you would have provided strong evidence linking extreme events (ACE) to specific equator-pole temperature gradient levels, which you didn’t.
Well it looks like so far at least one person favors BS over evidence.
Millions, nay, billions favor BS over evidence, or at least tolerate it.
You’re in the right place to see plenty of that!
Why has the earth been cooling for 7 years and the warming-rate decreasing for 28 years?
That’s an excellent couple of questions John. Thank you for asking.
I predicted the present solar cooling period in my 2018 AGU session poster entitled
“Extreme Weather Events and Climate Extremes are Limited by the Duration of Solar Cycle Irradiance Extremes“, Climate Extremes: Patterns, Mechanisms, and Attribution.
It was based on a quantifiable solar cycle influence on the ocean, relative to my solar threshold theory, where the sun-ocean decadal warming threshold is 95 v2 SN, 120 sfu F10.7cm solar radio flux, and 1361.25 W/m2 SORCE v17 TSI (1362.11 W/m2 TSIS-1).
The more recent 7 years period (and true of the prior pause into 2014) was a solar TSI cooling period due to the immediate and lagged effects of long-duration low solar activity below my sun-ocean warming threshold. I found a lag of up to a year between ocean warming and TSI long durations above the threshold. Since TSI has exceeded the threshold most of 2022, we can expect warm water upwelling along with direct surface solar TSI warming later this year that will erode the La Nina & reverse cooling.
I said in the poster this solar cooling period would last until 2021 +/-1 year, assuming a hypothetical July 2019 solar minimum, which was 5 months sooner than it actually happened, so by advancing the minimum to actual, the true projection is ~2022+-1 yr.
The best thing about this article was Javier’s Figure 2 of the 15y warming rate.
The 28y long 15y warming rate decrease is from progressively lower overall solar cycle activity since strong solar cycles #21, 22, a smaller #23, and an even smaller SC #24.
The rapid 2013 downspike in the 15y warming rate stands out, coinciding with high-sunspot driven TSI downspikes which I depicted here in my 2018 AGU poster image, driving exceptionally cold NH winter weather.
The sun then followed with sustained strong TSI above my threshold in 2Q2014, which continued with the solar sunspot maximum in late 2014, powered the equatorial ocean heat content increases and initiated the Kelvins waves that lead to the 2015/16 El Nino and subsequently related extreme events.
The climate cooled since 2016 from long duration low solar activity that is over now.
Now we are back to where we started, waiting for strong TSI to do its work again and turn the solar cooling La Nina period into a solar warming phase with another El Nino.
Looking at the equator to pole temperature gradient as a driver of extreme events misses the real climate driver, changes in TSI over solar cycles.
I think you might benefit from reading some articles about the relationship between Earth’s temperature and the Equator-poles temperature gradient. For example, here are two, one from Willie Soon and the other from Cristopher Scotese:
Soon, W. and Legates, D.R., 2013. Solar irradiance modulation of Equator-to-Pole (Arctic) temperature gradients: Empirical evidence for climate variation on multi-decadal timescales. Journal of Atmospheric and Solar-Terrestrial Physics, 93, pp.45-56.
Scotese, C.R., Song, H., Mills, B.J. and van der Meer, D.G., 2021. Phanerozoic paleotemperatures: The earth’s changing climate during the last 540 million years. Earth-Science Reviews, 215, p.103503.
And then some papers from the people that have a better understanding of climate thermodynamics and defend that it is not possible that the atmosphere of a warmer planet does more work because of the intensification of the hydrological cycle. For example:
Laliberté, F., Zika, J., Mudryk, L., Kushner, P.J., Kjellsson, J. and Döös, K., 2015. Constrained work output of the moist atmospheric heat engine in a warming climate. Science, 347(6221), pp.540-543.
My work confirms the basic TSI equatorial to polar connection Soon and Legates hypothesized, but I don’t use Scafetta’s Hoyt-Schattan based TSI like they do, so I don’t agree with their Figure 1. Scafetta’s sunspot-TSI basis is wrong and their method obviously precludes any solar-ocean accumulation over several solar cycles.
The next lagged relationship could not occur without inherent sun-ocean accumulation during high TSI absorption periods,which indirectly refutes the “only direct TSI“-climate forcing regime the Soon-Legates Figure 1 implies.
Like them, I have also empirically connected the sun to SST (above), then NH SST to the Arctic (below), in a few simple steps.
More recently I connected the intensification of the hydrological cycle to solar activity level in my 2022 AGU Frontiers in Hydrology presentation: higher SN => higher precip.
The net change in top of atmosphere Earth Energy Imbalance as measured by CERES instrumentation is caused by a decreasing shortwave out. This is not controversial.
Longwave up and down is changing proportionately to temperature, as one might expect considering observed LW IR is a consequence of the temperature of things, at 0.56W/m² during the CERES period of record.
Net radiation at the surface and the corresponding convective activity are set unequivocally to OLR/2.
Therefore, we should consider a supposed climate gas forcing mechanism to be a failed hypothesis.
Such that, through the use of observational evidence, it is more reasonable to be hypothesizing about the formation and distribution of the liquid and solid phases of matter in fluid dynamics.
I have no clue regarding why hundreds millions USD were invested in the satellite altimetric SLR measurement programs since we have a network of hundreds of tide gauges everywhere in the world that give us reliable records of the evolution of SLR for long periods, some among them being more than 2 centuries old.
Until now nobody could explain the huge discrepancy existing between the average SLR with no acceleration (less tan 2mm/year) recorded by the tide gauges and that of the satellites. Of course the IPCC scornfully rejects the first ones, keeping only the satellite records as clearly showing an almost 4mm/year accelerating rise as the dramatic result of the CAGW. “Is Science truly settled”?
No matter how fast it’s rising, it’s all natural (sun, volcanoes, isostatic adjustments) unless someone can prove how much man-made CO2 is warming (or cooling) the earth. According to the NEEM project, seas where up to 25 feet higher during the last Interglacial Warm Period — so we have nothing to complain abut. Either way, the fish are loving it as they now have more room to swim. In other words, global warming is making the oceans great again.
Thanks, John.
Does anyone know how much lower was the oceans level during the minimum temperatures of the Little Ice Age ?
They were about 400 feet lower, and they’ll probably go that low again during the next glaciation … http://www.climatecraze.com/pix/SeaLevels.jpg … and no doubt the IPCC will blame humans again.
According to:
Jevrejeva, S., Moore, J.C., Grinsted, A. and Woodworth, P.L., 2008. Recent global sea level acceleration started over 200 years ago?. Geophysical Research Letters, 35(8).
Global sea level has risen about 300 mm since 1700, or about 1 mm per year.
I am a huge fan of data gathering as that is the food that feeds science. Satellite measurements have a lot of problems but have a huge advantage over tide gauge measurements. Tide gauges do not distinguish a rising sea from a sinking land.
That said there is a third technique that has probably the best of both worlds, tide gauges tracked by GPS satellites.
“I have no clue regarding why hundreds millions USD were invested in the satellite altimetric SLR measurement programs since we have a network of hundreds of tide gauges everywhere in the world that give us reliable records of the evolution of SLR for long periods, some among them being more than 2 centuries old. ”
To gain control , money , “fame” etc ?
😉
Here in the UK there is a has been a steady rise in summer temps since the mid 1960’s which looks artificial to me.
As there has been no noticeable change in both the sunshine and rain fall records during the summer since the 1960’s that l would expect to see with such a rising trend in temps.
Which leads me to believe that this trend over the last 60 years has at least in some part a artificial cause rather then a fully natural cause. So l think this change is due to the changes in the way the temps have been record over these years. By means of moving away from recording temps the old school Maz Min mercury way, and over to recording temps by the way of electronic recordings.
You have to know that a majority of the meteorological stations in Europe were installed all along the last century in suburban zones in a time when they still were rural/agricultural places. The towns expanded and progressively reached these stations’ locations: The lanes became macadamed roads, residential and commercial zones were built, thus bringing the UHI (Urban Heat effect) with them.
It has been demonstrated that the UHI may enhance the local temperatures up to 8 °C (!) during canicular periods with respect to the surrounding countryside’s ones, and more modestly up to 2°C during winter cold periods.
Thus it is easy to understand that the warming is partially, if not mainly, an artificial, unnatural phenomenon.
Other good news, the climate has been getting more stable as it warms.
The highs get slightly higher, but the lows get even higher. The swings are smaller and less frequent.
Warming makes the climate more stable.
https://twitter.com/aaronshem/status/1612075237230903297
https://iopscience.iop.org/article/10.1088/1748-9326/ab4867/meta
Better to just ignore MSM in general – the quality of journalism has hit the sewers
I don’t understand figure 6 that shows sea level rise at 11mm per year a decade ago even though the discussion is how it’s ~2?
That is the rate of change for the past 15 years. A few high years in a row can do that. It is easy to find rates of 11mm/year using monthly data. I’ve attached a plot I made using the Church and White monthly data.
Fig. 6 gives the ‘instantaneous’ annual rate of change. The decadal average is about half that in the early part of the decade; it declines to about 2 at the end of the decade.
Some years sea level rises quite a lot, and some years very little or even negative. In Niño years, the sea level tends to increase more than in Niña years. In 2022 sea level is increasing very little and comes after some years of low increase. This helps demonstrate that there is no acceleration in sea level rise, as several articles have noted:
Kleinherenbrink, M., Riva, R. and Scharroo, R., 2019. A revised acceleration rate from the altimetry-derived global mean sea level record. Scientific reports, 9(1), pp.1-6.
Thank you
The UAH lower troposphere temperature plot for Australia shows a pause of 10 years 7 months to the end of 2022.
http://www.geoffstuff.com/uahjan2023.jpg
Thanks to Christopher Monckton for the method.
Note the strong cooling trend since about 2016.
If you convert that peak to trough cooling to conventional terms, it works out at minus 26 degrees C per century.
And people are making policy about an alleged 1.4 degrees C per century global warming rate and proxy based stuff like hockey sticks.
That minus 26 deg C per century is from data torture, a questionable scientific method, but in matters as grave as this, one has to fight fire with fire.
Thank you, Javier, for your reality. Geoff S
Debates on trivial fluctuations of climate are a diversion from the important issue: providing adequate energy on demand and at an affordable cost to the planet. Civilization is being pauperized by $trillions wasted on ‘renewable energy’. That waste is based on the narrative that energy produced CO2 is responsible for warming the planet; an hypothesis for which there is no reliable data, just assertion contrary to observation.
Building vast wind farms and PV parks does have measured, negative climate effects. Since there is a solution: nuclear fission energy, which produces NO CO2, the debate is moot. Build the necessary fleet of nuclear power plants. Let’s get on with civilization.
Regarding “The current cooling period is contributing to this decline in the long-term warming rate”: The “current cooling period” is from one of the two greatest El Ninos since the one of 1877-1878 to the third dip of a triple dip La Nina. Although the CMIP5 models overpredicted warming and the CMIP6 ones did so even worse, the author of this article seems to be overstating his case.
Consider that for the 22 years of this millennium, there has only been net warming in two, 2014 and 2015. So I would say that for over 20 years, the only warming we got was from “one of the two greatest El Ninos.” It is clear that the warming is not what it used to be.
“El Nino of 1877-1878”
Interesting.
This chart Phil Jones uses below shows the high temperatures of the 1880’s and the 1930’s to be on the same level.
The U.S. chart shows the 1930’s to be just as warm as 1998/2016.
It looks like we have a cycle since the Little Ice Age ended where the 1880’s, the 1930’s and 1998/2016 all fall within a narrow range, and the cool part of the cycle also falls within a narrow range with the 1910’s, and the 1970’s being equally cool.
So we have a cycle that varies about 2.0C from coolest to warmest, and within the cycle, the temperatures warm for a few decades and then they cool for a few decades and then the pattern repeats.
Here’s a U.S. temperature chart (Hansen 1999) that shows the magnitude of the changes: Keep in mind that the UAH global temperature chart shows 1998 and 2016 to be tied for warmest year in the satellite era (1979 to present).
The year 1934 was the hottest in the United States. Hansen shows 1934 was 0.5C warmer than 1998/2016.
Re Fig. 4: The CMIP’s calculate the temperatures on the ground (“tas”) and NOT in the lower troposphere. A fair comparison should therefore include only GMST. And IF you use UAH why not RSS? This dataset describes the same time-lenghth and the same issue. If you would use only GMST your argument would hold also. Why this “game play”?
The decrease in the rate of warming since the mid-90s is present in the datasets I have checked (HadCRUT and UAH) and has been reported:
Munshi, J., 2016. Trend Profiles of Atmospheric Temperature Time Series. Available at SSRN 2839119.
The degree of divergence between model and data trends is simply not possible.
I don’t have to justify why I use UAH. It is one of the datasets available. It is thoroughly reviewed every month at WUWT so people are familiar with it.
You didn’t answer my question why you compare TLT ( UAH) with “tas” in CMIP’6s. This would be the fair way to compare apples to apples.
I didn’t do that comparison. The figure is from Charles May, and he used UAH. Lower troposphere and 2 m. temperature trends should not be very diverging, and the atmosphere is not warming more than the surface, it is warming less.
Excellent post, Javier. Just wanted to let you know that I have added a couple of Keeling plot examples to the thread where we were discussing the 13C/12C ratio changes (or lack thereof) in the incremental atmospheric CO2.
https://wattsupwiththat.com/2023/01/04/the-new-pause-lengthens-100-months-with-no-warming-at-all/#comment-3662505
I remember the times when some WUWT articles were discussed for weeks until they were closed for further comments. There was a controversial moderator that was fired for posting a last-word controversial comment minutes before the article was closed for comments. These days comments are dead three days after posting. Attention span and concentration are lost mental abilities in the human species.
I’ll follow in the old thread.
Thanks for your birthday wishes. I’m aiming for 123 in 2061 to see Halley’s Comet again!!
I returned to my spread sheets for Aug 2022 and redid your Figure 6 but only up to the end of 2021. I have repeated two of the graphs from my work leading up to the WUWT essay
https://wattsupwiththat.com/2022/05/14/sea-level-rise-acceleration-an-alternative-hypothesis/
Not sure if I am in the “elite” club who can insert figures into their comments, so I have used Google Drive links for each. The first shows the Aug 2022 data with a Linear and Quadratic fit and indicating the “Residuals” showing the differences between the Actual and Linear values.
https://drive.google.com/file/d/1UWW8dF_1srbGRIztlOXda6lULm65QeXP/view?usp=sharing
Next is plot of Residuals with a quadratic fit and a sinusoidal fit. Up to recently the sinusoidal curve was a 22 year period curve with a +/-3.5mm range. I have recently, in light of 4 years of data, changed this to a 26 year curve with a +/-4.2mm range. I feel slightly embarrassed quoting a +/-4.2mm range – so accurate it must be true!!
https://drive.google.com/file/d/1y3eYuCjn0n0tqQNkb89-8hQlL8EvoAwY/view?usp=sharing
I then repeated your Figure 6 and added a Linear fit. The curves labelled Quadratic and Sinusoidal are based on the full data set. Also produced a similar curve for all the data up to end 2021. These graphs look less convincing as with the second graph above due to only plotting annual changes instead of all the readings. The first is similar to yours but I still maintain using short time periods is misleading.
https://drive.google.com/file/d/1qyq-1D-Y8KoN03TWEzjdP-oWO_UnG2LI/view?usp=sharing
https://drive.google.com/file/d/1zlU-tkNfTePQ7aRPYB40J873vO1hemn0/view?usp=sharing
I’m hoping to do a 30 year update of my work after the Dec 2022 results have been issued and I expect Nerem et Co will do likewise, especially as they make statements along the lines that the “acceleration” in sea level rises has leveled off and that 30 years is a long enough period to calculate “accelerations” – complete rubbish.
Alan,
I didn’t get access to your last three figures.
To display images in comments you need to first place them on an image-hosting website with https address. Several of them are free. For example https://imgur.com
Of course, it is, but this post is only about 2022 good climate news. In 2022 Artic sea ice did not decrease, temperature did decrease, sea level increased less than average, and there were fewer hurricanes.
I did some work on the long-term sea level rise predictions for my book. Even the intermediate scenarios are wild exaggerations. My projection includes the 65-year sinusoidal found by Jevrejeva et al.
Good luck with your 123-year project.
Javier
Glad you caught up with my comments as they should have been sent as a reply further back.
I have been able to click on all the https links and see all the figures. I will investigate “imgur”.
In 2018/19 I tried to submit a paper to PNAS and all going well until it was peer reviewed (I have my suspicions by who) and it was rejected. Below is the title and summary and it shows I studied the Tidal Gauge and NASA readings. I must admit the presentation of graphs in it could have been better.
—————————————————————————————-
Accelerating Sea Level Rise – Reconciliation of Tidal Gauge Readings with Satellite Data
By Dr Alan K Welch FRAS FBIS
Summary
The tidal gauge sea levels follow quite closely a constant accelerating curve. Closer analysis also shows that by combining this curve with a long-period (57 year) sinusoidal function many aspects of the tidal gauge data are even more accurately portrayed. A combined equation of the form
y = (0.0063×2 – 0.2452x + 174.82) + 6sin(((50+2t)/57) π)
was derived, where t is now defined as 1800 being t=0. See figure 8 and Appendix 2. This equation was then used for short and long-term projections. During this study other possible formulae to replace the constant acceleration were also investigated.
A separate study of the NASA satellite results was also carried out when the deviation from the linear regression line was used. This arrived at a similar short-term (22 year) sinusoidal variation resulting in a combined equation given by
(3.225x – 37.377) + 3.5sin(((5+2t)/22) π)
See figure 22. Short term projections were carried out.
The 2 periods of 57 years and 22 years could be related to known ocean oscillations.
————————————————————————————
Since then I have been in regular contact with Kip Hansen and occasionally with Dave Burton regarding sea levels. Kip helped me get my 2 papers (Sea Level Rise Acceleration – An Alternative Hypothesis Parts 1 and 2) published on WUWT and to polish up my presentation.Thanks for the Fig of projected sea levels. Projections to 2100 tend to give me the shivers, not by what they show, but that the extreme predictions use quadratic curve fitting and 80 year extrapolations. As an engineer I find this totally unacceptable. At least since the start of 2020 Nerem’s “accelerations” have slowly reduced month on month and may finish up nearer long term Tidal Gauge values around 0.01mm/year2 in a decade or so.
Best wishes for 2023
Alan
Of course you do, because it is your drive, but it says to me that I need access (not for the first two figures).
It may be a problem with the way you configured the permissions to see those figures.
Javier
This topic must be getting near it’s “dead and buried” stage with comments drying up.
There is one thing I want to raise regarding the plot you showed a few comments back on “Sea Level Rise Intermediate Scenarios”.
I may be wrong, but I thought the 65(ish) year variation was applicable to the combined Tidal Gauge Graph and was due to the combined affects of all the main ocean decadal oscillations all which have different amplitudes and phase shifts. The satellite readings would not be affected the same but the fact that they only cover 95% of the oceans may have an effect. The important point is where this missing 5% is. A quick look at an atlas points to a major part being the Arctic Sea so any oscillation between this and the North Atlantic may induce a perceived oscillation over a 25(ish) year period with a +/-4(ish) mm amplitude. This small amplitude is sufficient to create short term “accelerations” similar to those quoted by Nerem et al in 2018 and are not real long term effects.
Are you aware of any decadal oscillations between the Arctic Sea and the North Atlantic or are this areas and any amplitudes too small to show up
Alan?
I read your WUWT articles and I agree with what you say in them. Sea level rise acceleration is very small and presents multidecadal oscillations.
Javier
My fault – new at this
Hope to have changed settings.
Figures a combination of your Figure 6 with quadratic and sinusoidal curves added. Cover part period and full 29 years.
As I said before using annual changes leaves the graphs wanting a bit whereas using all 10 day results as in my second figure results in a better presentation.
Hope I’ve cracked it.
Alan
This article was re-blogged,
here: Goed klimaatnieuws, maar de media zwijgen – Climategate Klimaat
(Netherlands)
and here:
Good Climate News the Media didn’t tell you | Bread on the water
(South-Africa)