From NASA
Credits: Alexander Kosovichev/New Jersey Institute of Technology; Tim Sandstrom/NASA Ames
The Sun is much more than just a source of light for Earth – it’s a dynamic and complex star, with storms, flares, and movement causing it to change constantly. Magnetic fields govern most of the solar activity we can observe but how they do this is still poorly understood. New results based on simulations out of NASA’s Advanced Supercomputing facility at NASA’s Ames Research Center in California’s Silicon Valley are painting a more complete picture of one of the most prominent magnetically-driven solar features – a cycle of sunspot formation known as a “torsional oscillation.”
A computational analysis of data about the Sun’s structure and dynamics from two NASA spacecraft has revealed the strength of these torsional oscillations driven by the magnetic fields in the deep interior of the Sun are continuing to decline. This indicates that the current sunspot cycle may be weaker than the previous one, and the long-term trend of declining magnetic fields of the Sun is likely to continue. Such changes in the Sun’s interior may have impacts on space weather and the Earth’s atmosphere and climate.
The sunspot cycle begins when a sunspot begins to form at about 30 degrees latitude on the Sun’s surface. The formation zone then begins to migrate towards the equator. At its peak intensity, the Sun’s global magnetic field has its polar regions reversed – as if there were a positive and negative end of a magnet at each of the Sun’s poles, and they were switched. These 22-year variations are caused by dynamo processes inside the Sun. A dynamo process is when rotating, convecting, and electrically conducting fluid or plasma helps maintain a magnetic field. These deep magnetic fields are hidden, and can’t be observed directly, but their effects can be seen in the variations of solar rotation, creating a cyclical pattern of migrating flows across zones – the torsional oscillations. In some areas, this rotation speeds up or slows down, while in others it remains steady.
This analysis used data from two NASA missions, the Solar and Heliospheric Observatory and the Solar Dynamics Observatory. The Joint Science Operations Center at Stanford University processed data from 22 years of observations from both missions – more than five petabytes in total. NASA’s supercomputing facilities handled flow analysis, numerical modeling, and visualization that gave scientists a better look at this complex pattern.
Going forward, improvements to the data’s resolution, data analysis techniques, and simulation models will help merge models of the Sun’s magnetic fields with those of sunspot activity, advancing the understanding of how these processes impact the Sun’s deep interior. What happens with the Sun, including the processes beneath its surface, affects the space weather that impacts the entire solar system, including Earth. The more we know about the star that lights our home, the better we can understand its impacts on our home planet.
Video games. So What? Making video games may be fun, but it is not science. Not even when it is not “climate science.
No more video games.
Are you volunteering to lead an expedition to the sun’s interior in order to take direct measurements?
There is nothing wrong with using models to study something that can’t be studied directly.
You just have to make sure that you constantly check the models against real world data.
Just because the climate weenies are misusing models, is not evidence that ALL models are useless.
Don’t throw out the baby with the bathwater.
Well, maybe not the interior of the Sun. But we can certainly land on its surface. Just do it at night…
Mercy! Don’t mention that to any politicians or journalists, who knows what such people will have ordered up then demand. You want to get involuntarily recruited?
I wonder what you think of the simulations of airflow around aircraft wings that are used in the development of new aircraft. Judging from the disdain you demonstrate for such efforts I’d expect you never will set and never have set a foot in a plane.
There’s a difference. Simulations of airflow are limited, to well-known areas, and rigorously checked against experimental data.
Solar models are also constantly checked against data recorded by satellites and telescopes.
Bear in mind that these simulations are derived from actual wind tunnel experiments. And major departures from existing designs are tested in wind tunnels.
The supercritical wings of the Airbus 300 family came out of a computer. And then, of course, were tested in the wind tunnel as well. And each new design has test flights with the plane stacked with sensors and what not, testing the design and thereby also improving the modelling. The testing against the real world is what makes them work. It is that aspect which is missing with climate models.
Climate models are tested against the real world. I agree with your other points though.
Define “real world” I don’t believe that’s possible.
Real world is the global average temperature observation.
Nonsense. That doesn’t exist in the real world and cannot be observed.
A lot of people are observing it including but not limited to NASA, NOAA, Copernicus, ECMWF, UAH, JMA, Berkeley Earth, etc. Clearly it not only exists but is possible to observe. Here is WUWT page containing the UAH obsevation.
Rubbish. They are run for earlier periods and compared to modified, adjusted, homogenized, infilled numbers.
If you think the tests are rubbish (which is a different claim than it not being tested at all) then how you do eliminate the possibility that they have an RMSE of only say 0.01 C for monthly predictions?
IF they are tested against the real world, why does the output fail to match the real world?
I downloaded the CMIP5 data from the KNMI explorer and tested it against the real world observations from Berkeley Earth. It has an RMSE for monthly predictions of 0.16 C. That seems like a pretty good match to me considering the uncertainty on the observations can themselves be upwards of 0.16 C especially earlier in the period. You can easily test climate models like CMIP5 yourself. If you want I can walk you through it.
Exactly.
But wind-tunnel data need to be corrected for scale effects, and the wall or jet edge. However, we’ve known how to do those corrections for at least 6 decades.
The Computational Fluid Dynamics models to which your refer have been verified and validate against real-world data. However, each CFD code has its own limitations, and their users are well-aware of them. For example, high-subsonic, and low supersonic. interfering airflows are an absolute bugger.
The use of every model of every physical process is a simulation. Using F=ma to predict trajectories is a simulation. Using Kepler’s model of planetary motion to predict orbits is a simulation. Using quantum mechanics to predict particle decays is a simulation. And to your 2nd point we simulate the atmosphere for weather forecasting with useful skill everyday. People literally make life and death decisions based on simulating the atmosphere. Nearly everything in science and engineering involves some kind of simulation. If you are not open to the idea of simulations then you aren’t going to be very satisfied with science. And if your conviction runs that deeply then you might want to consider abandoning the engineered products and services you use on a daily basis including the ability to post to this forum since all of it is developed using simulations at some point in the development cycle.
You would actually use a = F / m for trajectories… You also need θ and g to predict your impact point. Then your model is useful – but only in a vacuum.
Tell that to every military in the world that uses precisely such a model to project the impact point of artillery shells.
Such models are very, very useful. They aren’t perfect, but they don’t have to be.
You haven’t hung around with many gun bunnies, have you?
Until the 1970s – in the US, that is – CEP (Circular Error Probable – the circle in which any one round has a 50% chance of hitting) was at best about 100 yards in diameter. This is why massive batteries were used, are used still in many militaries, to hopefully get a decent number of rounds where you want them. (Even then, this is why anti-personnel round development was focused on getting larger effect areas, spreading shrapnel as far as possible – which, except for troops caught in the open, still didn’t wound all that many. Ones that landed even in minimal foxholes were called “Golden BBs” for good reason. Against those targets, the effect is largely psychological – still very much worth the shell expenditure, if you are going to follow up with an assault.)
Modern systems have tens of thousands of lines of code behind them. Yes, a model, one based on years of test firing under all kinds of conditions. Beyond the model accounting for shell weight, explosive transfer, and angle – they take into account barrel temperature, total shots fired, shots fired since the last bore cleaning, the ambient temperature and humidity, winds at altitude, quality of ground under the piece, and several other things. This is all plugged into that empirically determined model to get a CEP within two or three meters. The even more miraculous Abrams system, with a CEP in centimeters, actually fires a laser first to measure all of those atmospheric conditions between the gun and the target. (That’s practical, of course, only for a direct fire engagement, not a ballistic one.)
Of course, models are not useless when based on empirical measurements of every significant factor and how it affects the result. But you have to have those measurements – otherwise you are still guessing about a lot of things, and plugging in parameters to account for observations of the result that don’t match up to the model – just numbers without understanding the physical reasons for them.
Now, in this case, we have pretty good empirical data about the Sun. But only the outermost layers. For far too short of a period. (The debate between “cyclomaniacs” and “anti-cyclomaniacs” really won’t be resolvable for at least another three centuries or so.) The rest is purely models, based on (again, very good, but limited experimental plasma physics), in which parameters must be fiddled with to fit the observations, without any kind of deep knowledge of why. The “unknown unknowns” happening right now in the deeps could absolutely contradict the current model at any time, and again you won’t know why things went off the rails. Eventually, for solar science, experiments will be conceived, engineered, and run, and theories will be proposed and validated, that will allow replacing parameters with numbers that are provably correct because we know why. Solar scientists are doing just this stepwise process – which is why I don’t put quotes around the word, unlike most climate “scientists” that only make excuses for why their models just plain do not match reality.
SImulations are not reality, but they are still very useful.
Mass isn’t the problem, complexity is.
They can’t be directly measured, but that doesn’t mean there are no ways to indirectly infer what they are.
Using models is not pretending.
This utter hatred of all models just because the climate weenies misuse climate models is completely irrational and is as damaging towards real science as anything the climate weenies have done.
That brings up another good point regarding models and simulations. They are never perfect and never will be. But, they are useful.
I always mention in this context how quantum mechanics makes the worst prediction in all of science regarding the vacuum catastrophe. It predicts a cosmological constant that is 120 orders of magnitude different than the observation. Yet, quantum mechanics is still considered to be among the most useful models conjectured up. And people literally make life and death decisions based on the predictions of quantum mechanics.
Useful for what? For learning and teaching what we know and what we don’t know, yes absolutely. For predicting the climate decades or centuries ahead and changing the energy infrastructure of the world putting billions of people at serious energy and food risk while enriching a few, no absolutely not.
Engineering the products and services we all rely on.
No climate model is used for engineering anything but social control.
I didn’t say climate model simulations were used to engineer products and services you rely on. I said model simulations (in general) are used to engineer products and services you and ATheok rely on. I standby that statement.
There are geophysical methods used on earth–Resistivity, Induced Polarization, Magnetotellurics–where measurements are affected or contaminated by variations in earth’s magnetic field, which in turn is affected by solar magnetics. These techniques are regularly used to find orebodies and geothermal circulation systems.
Any increased understanding of solar magnetics will help refine results from these exploration methods. As a geologist I will not be dismissive of this study as a useless expenditure of money any more than I would dismiss studies of the earth’s magnetic field, having spent hours correcting magnetometer data for its variations.
“…hours correcting magnetometer data for its variations.” is what almost every beginning Geologist used to do, congratulations for your excellent start, Len. Those correction of magnetometer data are due to the variable earth magnetic field responding to solar EM flux, which happens quite quickly. Magnetic fields do not cross, they press against each other and the stronger “flattens” the weaker field, but the effect on earth’s magnetic field is very location and time sensitive, suggesting these solar magnetic flares are streams. So, monitoring the Sun’s magnetic variation, in four dimensions, could create a lot of data that could be modelled. This type of modelling is quite often useful as an assist to forming theories, but it does not prove anything, as noted here by others.
Why waste money trying to understand the sun when everyone knows all the adverse weather on Earth is a direct result of burning fossil fuel?
The money could have been better wasted convincing more people that CO2 is a deadly pollutant.
and it’s not just CO2 that is a pollutant because we read every day about “carbon pollution”
Word mention count:
‘electric’ – 1
‘electric current’ – 0
Here is a very rough analogy:
Magnetic field of solar convection zone is its ‘muscles power’.
Electric currents of solar convection zone are its ‘blood stream’ that feed and keep system alive.
Both are intrinsically linked together, so any analysis of one without mentioning its essential dependence on the other is not even half of the story.
“A computational analysis of data about the Sun’s structure and dynamics from two NASA spacecraft has revealed the strength of these torsional oscillations driven by the magnetic fields in the deep interior of the Sun are continuing to decline. This indicates that the current sunspot cycle may be weaker than the previous one, and the long-term trend of declining magnetic fields of the Sun is likely to continue. Such changes in the Sun’s interior may have impacts on space weather and the Earth’s atmosphere and climate.”
http://wso.stanford.edu/gifs/Dipall.gif
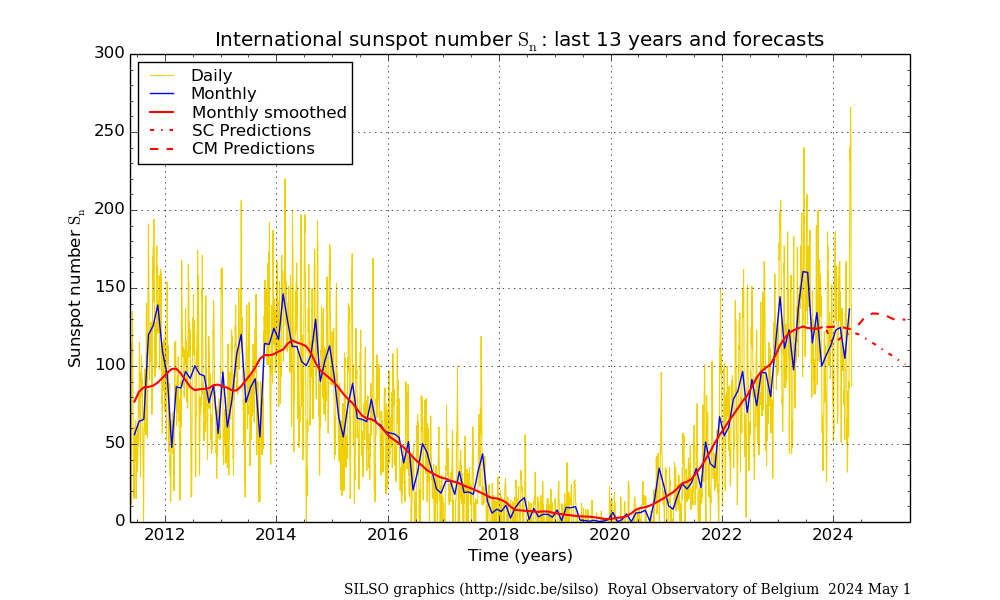
The data does not show that. Due to short-term high variability the international curator of sunspot numbers, SILSO, does a smoothing on the monthly sunspot number. A comparison of this smoothed number between SC24 and SC25 up to November 2022 shows that SC25 has a slightly higher (non-significant) activity so far.
Obviously, the current sunspot cycle may be weaker, stronger, or the same as the previous one, but not by much considering how far we are in the cycle. And trend extrapolation is the bane of science. It should be forbidden.
“And trend extrapolation is the bane of science. It should be forbidden.”
The current solar cycle #25 sunspot number running average is 10% higher than SC#24 at 36 months old, 37.3 SN for SC#25 compared to 33.8 SN for SC#24. So far, this is what Dr. Leif Svalgaard predicted for SC#25 sunspot activity.
SC#25 is 40% below average in terms of running average sunspot number, and far below the average activity level of the Solar Modern Maximum (1935-2004, approx. SC# 17-23).
The vast majority of solar cycles follow the running average trajectory that gets established very early in the solar cycle, traceable from the polar fields at the solar minimum.
It shouldn’t be forbidden to think SC#25 won’t veer much from it’s already established course.
Obviously NASA prefers a simple-minded linear extrapolation.
As far as I know, Leif made his prediction in June 2018. I made mine in December 2016, six years ago, and so far it is still correct too.
The publication of my prediction took place in an article at WUWT showing David Archibald’s prediction of SC25 which is already shown to be too low, and it gave place to one of my first fights with Leif Svalgaard regarding his complete lack of understanding of the cyclical nature of solar activity.
Solar Cycle 25 Amplitude Prediction 21 December 2016.
If at that time Leif had a prediction he didn’t talk about it.
Javier, I credit you for your prediction, however I’m not seeing the actual basis for it other than an apparently expected periodicity and increasing trend.
Vuk has a formula for his predictions, what do you have for yours, a guess?
Leif knows about the sun’s quasi-periodic nature, it’s just not a precise science.
Leif didn’t make his prediction until he was confident in the state of the polar fields nearing the solar minimum, ie the actual physical basis related to the sun’s magnetic fields, which is why he didn’t make the prediction in 2016, which does not put your prediction above his just because yours was made first.
Note I’m not telling you you are right or wrong here. There were many more sunspot cycle predictions this time, published, most/all with a physical basis.
What is your physical basis other than cyclomania? Why did you predict an upward trend, G1-G4? What is the physical basis? Just askin’ for a friend.
The method that Leif uses (he didn’t develop it AFAIK) is very reliable but can only predict the next cycle and only when close enough to its start, so it is useless for predicting long-term activity over the rest of the 21st century.
The method I use has been used previously by several people, including Clilverd et al. 2007 and Tan 2010. It is known as the spectral method, as it is based on the spectral behavior of the past solar activity. It doesn’t require a mathematical formulation. A model is built (Excel in my case) where a series of solar cycles of different periods affect solar activity, increasing or reducing the activity of the 11-year solar cycle.
In my case, I take into account the 50, 100, 200, 1000, and 2500-year cycles. These cycles decrease the expected (maximal) solar activity of the base 11-year cycle as a function of their distance to the year in which the low took place or is expected to take place. In addition, the 200-year cycle’s activity is modulated by the 2500-year cycle, as the bibliography makes clear. My model does not predict the maximum activity of the 11-year solar cycle, which is quite variable, but the integral of its activity (sunspot summation) which is less variable.
Leif defends that the sun has no memory of past cycles and therefore to him any cyclicity longer than the 11-year cycle (which he defends as an 18-year cycle) is an artifact. My method is cyclomania to him. Yet most astrophysicists were wrong about SC24, while Clilverd et al. were correct in indicating that SC24 and 25 were very low activity cycles in 2007.
That’s why I call the current extended solar minimum the “Clilverd Minimum” in my book.
“I take into account the 50, 100, 200, 1000, and 2500-year cycles.”
There are centennial minima on average every 110.5 years (107.9 years long term average), and every 863 (+/-20) years are a series of longer centennial minima, otherwise known as grand solar minima. The four planets ordering it don’t produce, 200, 1000 or 2500 year cycles.
The right correlations allow discrete prediction of the timing of each solar cycle maximum, and the timing and duration of each centennial minimum, including the grand solar minima, for millennia. So the average interval is not the predictive tool.
Javier, how do you square your statement
“And trend extrapolation is the bane of science. It should be forbidden.”
with your sunspot prediction that has an extrapolated trend, G1-G4?
Very simple. If you do trend extrapolation on a cyclical phenomenon you will be wrong every single time, because the linear trend is always changing as the cycle continues. David Archibald got SC25 activity wrong because he extrapolated the SC21-24 trend. I did not because I didn’t. I realized this was the centennial solar cycle (aka Feynman Cycle) taking place.
Perhaps you misunderstood. Your G1-G3 plainly has a background positive linear trend that you extended to G4. Why do you expect the cyclic part to rise even higher with this positive background trend? Why is that not ‘forbidden’ like you emphatically said?
Now you’ve claimed to not get SC#25 wrong. Your SC25 is much higher than SC24, more so than the current state of affairs allows.
Why do you think you got SC#25 right? At the current pace SC#25 will barely exceed SC#24, and is more likely to be like a pair with #24, of similar sizes, like cycles #12 & #14, or #5 & #6 were.
What causes the G1-G4 groups to predictably cycle up and down with a positive trend? What would cause the trend to reverse? Can you identify when the next trend reversal happens? If you don’t have physical answers then it’s all guesswork, cyclomania.
Don’t you realize that while you could have correctly identified the Feynman Minimum timing generally, your solar cycle magnitudes may be far too high, thus falsifying your overall prediction?
You’re a still long way from bragging rights here.
There’s a previous answer stuck in moderation.
The general increase in solar activity from G1 to G4 is not a linear trend, it is part of the ascending half of the millennial (Eddy) solar cycle. This cycle is expected by me to reach a high around 2060-2070. Overall solar activity in the 21st century should be similar to or slightly higher than in the 20th century. That depends on getting the contribution from the 200-year (de Vries) solar cycle right.
That there is no physical explanation yet for the cyclical behavior of solar activity does not mean that it is not real. People knew about the seasons and how to predict them millennia before an explanation could be given. The evidence that they are real is that they do take place.
The criteria for solar activity in my model is not the SC maximum, but the integral of activity (solar cycle monthly sunspot sum). I don’t expect to get the maximum right, I expect to get the cycle activity right, or at least in the ballpark. Solar activity prediction is in its infancy. We still don’t know what causes the solar activity to cycle.
“We still don’t know what causes the solar activity to cycle.”
And it has not been established that it does. Each solar ‘cycle’ is an eruption based on the remains of the previous eruption but with a fair amount of random variation making reliable prediction more than one eruption ahead impossible. There is no place in the sun for the memory required for real long-term cycles. There can be no ‘understanding’ of something that we don’t know about. Thinking otherwise is just speculation or wishful thinking and has no place in science.
Of course it has been established that it does cycle.
You might recognize this figure from a McCracken et al. 2013 paper.
If the sun has no place for the memory required we will have to look outside the sun for the explanation of its secular cyclicity.
Both the sunspot series and the Dye 3 series are too short to establish any ‘cycles’. The Dye 3 doesn’t even pickup the 11-year ‘cycle’ above the noise. I note that there are no error bars or confidence ‘bands’ on the plot.
The better place to look for cyclomania is in the brains of the believers.
You might learn from this paper:
https://www.aanda.org/articles/aa/pdf/2019/05/aa35290-19.pdf
“Power spectra of solar activity based on historical records of sunspot numbers and on cosmogenic isotopes show peaks with enhanced power apart from the dominant 11-year solar cycle, such as the 90-year Gleissberg cycle or the 210-year de Vries cycle. In a previous paper we have shown that the overall shape of the power spectrum is well represented by the results of the generic normal form model for a noisy and weakly nonlinear limit cycle, with parameters all determined by observations. Using this model as a null case, we show here that all local peaks with enhanced power, apart from the 11-year band, are consistent with realization noise. Even a 3σ peak is expected to occur with a probability of about 0.25 at least once among the 216 period bins resolved by the cosmogenic isotope data. This casts doubt upon interpretations of such peaks in terms of intrinsic periodicities of the solar dynamo process.”
You are wrong as usual. The 10Be Dye3 series is 540 years long, and the 200-year peak is well resolved in the 9000 years of data used in the article.
https://link.springer.com/article/10.1007/s11207-013-0265-0
The 10Be series is a technique absolutely different from the sunspot count. So what is the probability that peaks would randomly appear in both series coinciding at 50, 100, and 200-year frequencies?
The only thing those two series have in common is solar activity. It is clear that solar activity is displaying those frequencies.
Clilverd et al. predicted the SC24-25 Clilverd Minimum in 2007, over one year before SC24 started. And they did so using the spectral properties of those secular cycles you deny. I guess science advances leaving you behind.
It seems that you did not learn anything from a careful study of
https://www.aanda.org/articles/aa/pdf/2019/05/aa35290-19.pdf
The spectral peaks ‘observed’ are consistent with random fluctuations over a time interval too short to give credence to the peaks being evidence of true cycles that can be extrapolated [‘used’] beyond the interval used to derive the peaks.
Now, I understand that it is impossible to get you off your chosen belief. One may hope that the readership is not taken in by it.
Are 9400 years “a time interval too short to give credence to the peaks being evidence of true cycles that can be extrapolated [‘used’] beyond the interval used to derive the peaks.”?
It seems you didn’t read McCraken et al. 2013, not even the title, because that is the interval they use.
And it seems you didn’t read:
Adolphi, F., Muscheler, R., Svensson, A., Aldahan, A., Possnert, G., Beer, J., Sjolte, J., Björck, S., Matthes, K. and Thiéblemont, R., 2014. Persistent link between solar activity and Greenland climate during the Last Glacial Maximum. Nature Geoscience, 7(9), pp.662-666.
Because they detect the 200-year solar cycle over the 10,000 years prior to the Holocene during the last glacial period.
It seems you are in denial of the evidence that refutes your claims.
Hi doc
“There can be no ‘understanding’ of something that we don’t know about. Thinking otherwise is just speculation or wishful thinking and has no place in science.”
Have to agree.
Your colleague and another Stanford’s stalwart Leonard Susskind might say, that’s because we looking at the solar electromagnetic and gravitational environment in ‘clasic’ Newtonian-Faradian theories.
It’s all simple only if we understood one of his most recent lecture on Grand unified Theory.
https://m.youtube.com/watch?v=Ux2C7kZ6WlY
“The criteria for solar activity in my model is not the SC maximum, but the integral of activity (solar cycle monthly sunspot sum).”
Your plot is sunspot number, not it’s integral or running average.
I hope you realize any integral is exactly the same thing as the running average times the number of months for any month.
Your SC#25 plot is still too high considering the current SC#25 trajectory as seen on my SC#25 running average plot, panel (b).
You plot is labelled “ASN”. Why not SN from SILSO?
In that 2016 figure I was using a figure by Tan 2011:
Tan, B., 2011. Multi-timescale solar cycles and the possible implications. Astrophysics and Space Science, 332(1), pp.65-72.
His prediction can be seen in the dotted line. He sees SC26 having less activity than SC25.
I overlaid my first model over his figure to show that others were seeing the same structure in the centennial cycle. I credited the figure (his article was first published on the web in 2010) indicating his prediction.
For my book I made a new figure with the latest version of my model, but my book has been published recently, so it is important to show my spectral prediction dates from 2016.
Hard to tell at this point. According to Jan Alvestad of solen.info, SC24 peaked at 116 smoothed SN on Apr 2014 and, as of this month, he projects the maximum for SC25 at 142 smoothed SN on Nov 2023 (we wouldn’t know until mid-2024).
However maximum activity is notoriously difficult to predict, so I’ll wait and see.
Yes, too close to call right now (in comparison to SC24). I think, though, that a prediction of far lower than SC21-SC23 is perfectly in order.
Thanks for the SILSO update. Too bad NASA doesn’t better spend their time and money on understanding how the SUN controls our weather and climate.
How long have we been in the cycle? Quite a long time.

Another supercomputer model
At least there’s some honesty that it’s only a model. They know it’s a stab in the dark
I could care less for supercomputer models- I prefer super models
Coming out of Stanford, I wonder if Dr. Svalgaard had any input.
It would be good to have his insight to this.
supercomputer? That doesn’t necessarily mean the results are better than if it wasn’t a supercomputer- if the models being used aren’t correct.
Correct.
When I started college, we each had to have a super-computer.
Mine was yellow.
https://en.wikipedia.org/wiki/Slide_rule
When I was in high school in the mid ’60s- I had my slide rule hanging off my belt- being a nerd like I was- I thought it was cool to do so- that it would get me chicks- it didn’t. 🙂
A graph of UV radiation shows that solar activity was at a record low for four years, and has now dropped again.

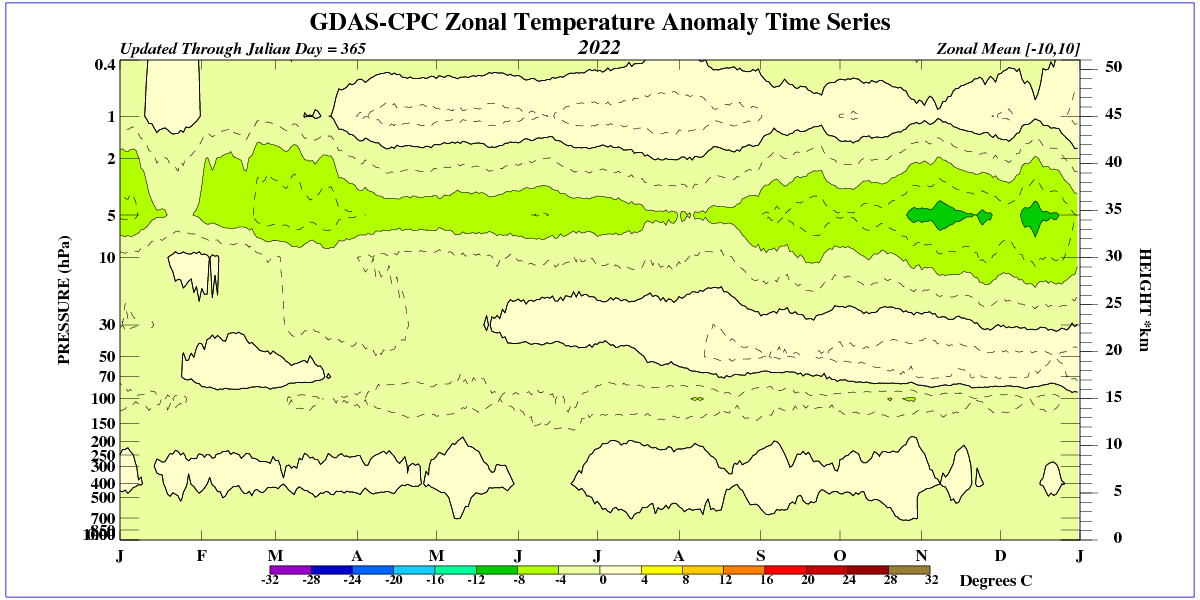
This can be seen in the decline in ozone production in the upper stratosphere.
Ireneusz, the Bremen Mg II index for SC#25 started 20 months before the SC#25 sunspot minimum, and the other cycles listed are also likely offset from their sunspot minimum too.
The picture would look much more normal if the cycles were aligned on the sunspot minima.
How do you identify a decline in ozone with the zonal temperature anomaly?
I have used TEMIS UVI/Ozone data for three years and found ozone extremes are strongly related to cumulative tropical ENSO evaporation surplus/deficit [ie clouds vs no clouds].
Ozone has dropped due to the La Nina, causing higher UV Index, ie higher ground insolation, driving summer land temperatures higher as local droughts extend.
La Niña has no effect on ozone production in the upper stratosphere. The temperature in the stratosphere depends only on UV radiation and increases only in the process of photolysis of O2 and the formation of the O3 molecule.

It does not matter when the sunspot cycle began.
Yes, stratospheric ozone comes from UV & O2, but Total Column Ozone (TCO) is closely related to cloud cover. More ozone is found wherever there are clouds, or where clouds recently were. Drier skies have less ozone. Does TCO by definition include stratospheric ozone with tropospheric ozone? idk
“It does not matter when the sunspot cycle began.”
It does if you want to have comparable standardized solar indices.
The amount of ozone in the troposphere is negligible and increases only during winter stratospheric intrusions.


It is the pattern of the stratospheric polar vortex that gives directions to the winter circulation and determines the movement of Arctic air masses. It is the winter circulation in the lower stratosphere that creates lows and highs in the troposphere.


I’ve told him the same several times, so he is aware of the issue, but he prefers to say that this UV cycle is very abnormal when it is not significantly different from SC24.
I clearly write about the UV radiation cycle, not the sunspot cycle. Both UV and galactic radiation levels indicate at least 4 years of very low solar activity.


Number of sunspots on a regular basis.

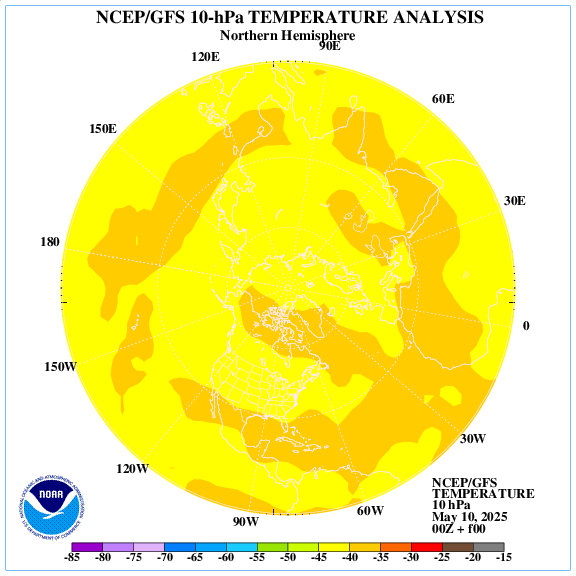
The temperature of the upper stratosphere in the northern hemisphere above the 60th parallel is also lower than the multi-year average.
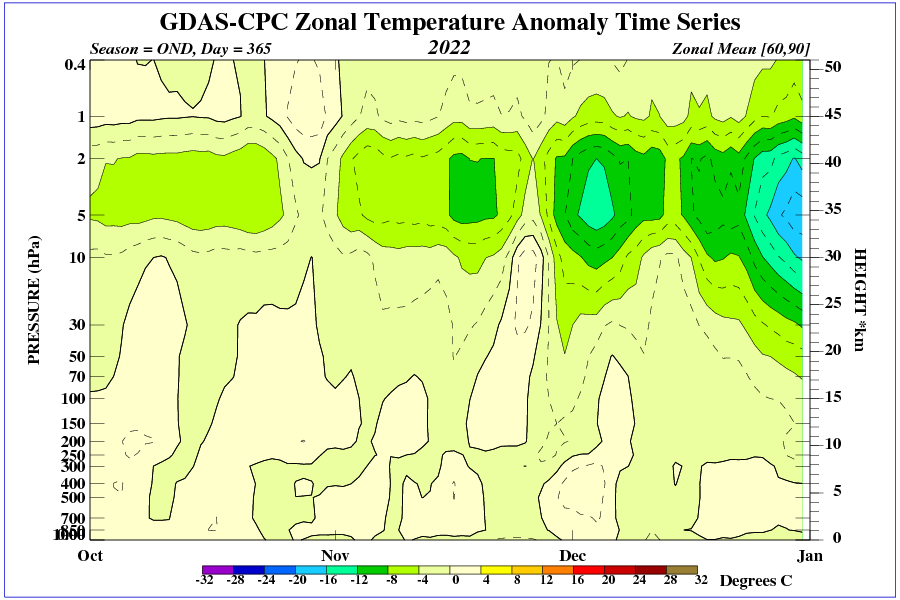
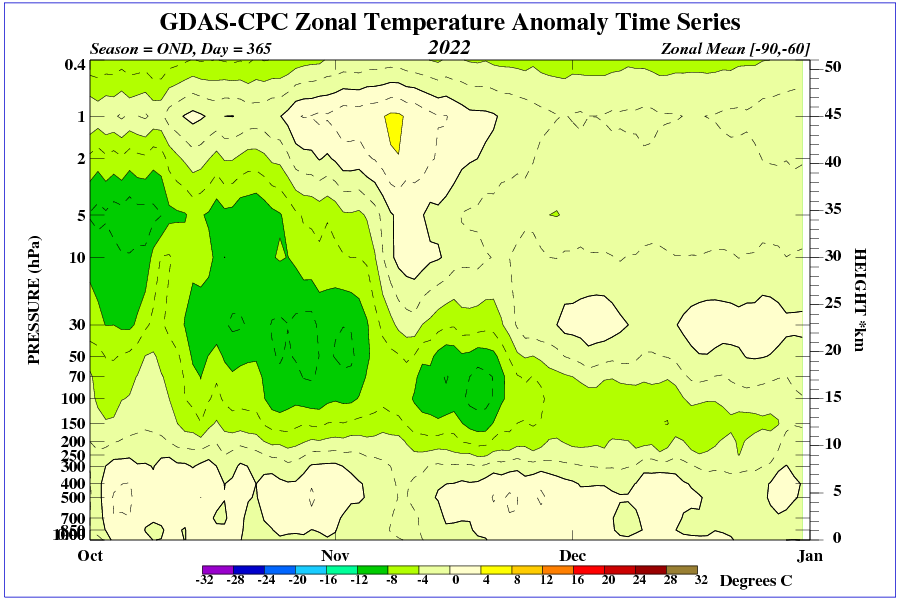
For comparison, the temperature anomaly of the stratosphere in the south.
What impact will the decline in solar activity have on the climate? It’s simple, winters in the northern hemisphere will return to the 70s for 30 years.
And there appears to be little research effort on what a grouping of 2-5 low cycles can do to climate.
“…on what a grouping of 2-5 low cycles can do to climate.”
I have researched that idea, concerning the duration under/over my solar ocean warming/cooling threshold, and found long-term low solar activity leads to a cooling ocean, drier skies, hotter summer land temperatures, and more drought such as during the 1930s hot Dust Bowl years. There were other direct/cumulative climate effects too, which reversed in places under the opposite condition of long-term high solar activity during the Solar Modern Maximum, 1935-2004, with more warming and wet extremes.
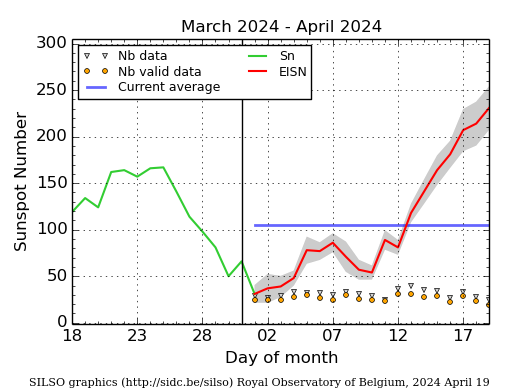
The smoothed lines shown in charts are ending 7 month behind ,
And It so happens The sun activity is going only sideways for the last 8-9 month ,
extrapolate this
PCA (principal compinent analysis) does to Solar Magnetic Field similar outcome than Glass teiangular prism does for the white light and some other interesting features found in the Sun in UK. https://youtu.be/LYOMKLDbeYE
“The Sun is much more than just a source of light for Earth – it’s a dynamic and complex star, with storms, flares, and movement causing it to change constantly. Magnetic fields govern most of the solar activity we can observe but how they do this is still poorly understood. “
But we know enough to know definitively – the science is settled – that that big starry thing in the sky doesn’t affect our weather – or our climate.
That is all down to a trace gas, that – to the nearest one-tenth of one percent – we have zero of in our atmosphere.
Or have I drunk much too much of their Kool-Aid?
Auto
This time, winter in the northern US will not let up.


