Essay by Eric Worrall
Does evidence of past extreme floods invalidate claims that climate change is making floods worse?
Picture of tree at centre of furious flood debate
A seemingly simple picture of a tree in regional Australia has sparked a furious climate change debate.
Staff writer
November 26, 2022 – 3:40PMA picture of a tree in regional South Australia has sparked a wild climate change debate.
…
Well above the current flood level is a marking from 1956.
For some, it was a smoking gun that climate change isn’t real.
“And the climate change back in 1956 was caused by what?” one person joked.
“I wonder if they were talking climate change in 73, 74 and 75,” another added.
Others pointed out an obvious issue.
“How tall was that tree in 1956?” one person questioned.
…
Read more: https://www.news.com.au/technology/environment/climate-change/picture-of-tree-at-centre-of-furious-flood-debate/news-story/49773c42204ea791b427baa505616883
As Australia continues to suffer a year of devastating floods, Climate alarmists are moving to take advantage. Flannery’s Climate Council is leading the pack, pushing the narrative that climate change is responsible for more floods – which is hilarious, given a few years ago Climate Council founder Tim Flannery was pushing the narrative that we had entered a period of endless drought. “… even the rain that falls isn’t actually going to fill our dams and our river systems …” – remember saying that, Tim?
At the center of this debate is the embarrassing evidence that past floods were worse than recent floods.
Some alarmists appear to be claiming markers on South Australia’s “Tree of Knowledge” have moved due to tree growth, disputing evidence that past floods were worse. But there are plenty of inanimate historic flood markers, which appear to confirm that tree growth alone cannot account for past flood markers being higher. For example, the markers on a heritage riverfront building in the Queensland town of Maryborough (see top of page) show a spectacular flood in 1893, which far exceeds any modern floods in the region.
Having said that, we cannot conclude whether climate change is influencing Aussie floods based on this evidence, because that would be comparing apples to oranges. Since 1893 there have been substantial waterworks – irrigation channels, reservoirs and flood mitigation measures – on flood prone rivers which run through inhabited areas of Australia.
What about more scientific measurements?
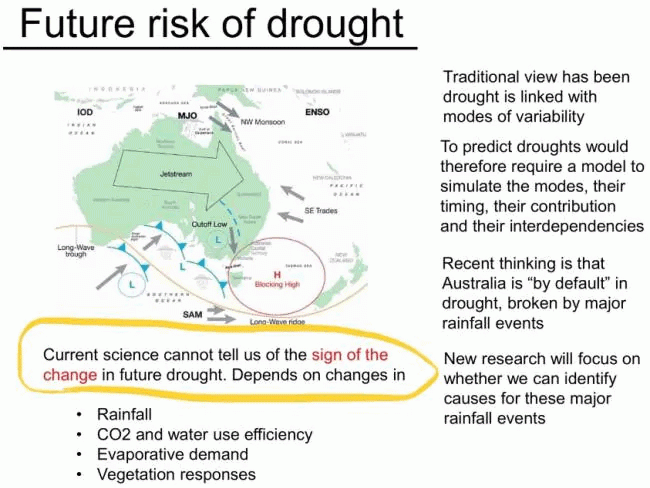
The following is a slide from Professor Andy Pitman’s presentation in 2019. Pitman is Professor of Climate Extremes at the University of New South Wales. Pitman appeared to admit climate science doesn’t have a clue what CO2 is doing to long term flooding, if anything – though he later appeared to recant, alluding that climate change was making things worse in some indirect and unspecified fashion.
Could volcanic activity be a contributor to major floods in Australia? Australia is on the South Western edge of the Ring of Fire. While the Australian mainland is not very volcanically active, there have been some spectacular eruptions in our neighbourhood, such as the infamous Krakatoa eruption in 1883, or the 1815 Tambora Eruption, which is blamed for causing famine in the United States in 1816, “The Year Without a Summer”.
A notable volcanic eruption occurred at the start of 2022 – The Hunga Tonga eruption. JoNova published an intriguing comparison between the volcanic ash distribution from the Hunga Tonga eruption in January 2022, and 2022 rainfall anomalies across Australia. Hunga Tonga was light on sulphates, but the blast threw unprecedented amounts of water into the stratosphere. Where I live, on the Southern edge of the volcanic debris distribution, we’ve had some spectacular sunsets over the last year.
The apparent overlap between rainfall anomalies and volcanic debris could be a coincidence – but the comparison is visually intriguing.

So what can we conclude from all this? Unfortunately the answer is, not a lot.
I can’t tell you what climate change is or will do to rainfall in Australia. And going by Professor Pitman’s presentation, neither can anyone else. Though having said this, even detecting a significant change would be the real challenge, given the magnitude of Australia’s climate variability across a wide range of timescales.
Bottom line –
anyone can say anything they like about present or future droughts, floods, heatwaves, etc but what none of us can do (without losing all credibility) is to deny what contemporaneously recorded history shows us.
Pitman appeared to admit climate science doesn’t have a clue what CO2 is doing to long term flooding, if anything – though he later appeared to recant, alluding that climate change was making things worse in some indirect and unspecified fashion
Apparently CC is making things worse “Because We Say So”
“How tall was that tree in 1956?” one person questioned.
I know things are different in Australia, but do the trees actually grow from the bottom up? LOL
Here in the northern hemisphere, trees grow from the top. That might be different in the southern hemisphere.
Exactly. It got me thinking that if I lived in Australia I might have hair on my head instead of hairy feet.
When young, trees can gain height in the trunk. When more mature trees tend to grow UP less in the trunk and more from the top. Their trunks tend to gain girth. I guess they are more like us than we want to admit.
“When young, trees can gain height in the trunk.” Sorry, guess I’ve never seen a fence nailed to a tree rise further above ground as the tree grows older. Always heard that grass was the only plant that grew from the ground up.
It might be possible that while a tree is still only a few inches tall, that it can gain height in the trunk.
Of course while it is that short, the difference between the tip and the trunk is kinda academic.
Thank you, Paul.
I was about to break into a rant.
Doesnt Bamboo grow from the bottom up, maybe cactus too.
Bamboo is officially considered a grass.
Cactus grows from the top, not bottom.
No.
That’s obviously a specimen of the Australian Flexible Tree; used in the manufacture of Flexible Flyer sleds and coasters for children! It may be the last living specimen; another species snuffed out from the ravages of Demon CO2!
Apical meristem at the tip is responsible for linear growth, lateral meristem is responsible for increase in girth, so, yes, they grow from the tip.
Well, it’s a bit of skepticism from activists not known for skeptical thinking. Maybe the tree grew, or the ground shrank. Another question or two, and they’ll be denlers!
Unfortunately too many people only apply their skepticism towards any science/evidence that goes against what they want to believe.
You’re all looking at this the wrong way! Our first job is to find out what the temperatures were during each of those floods. Get Mikey to go and take the tree’s temperature from the rings, and tell us how warmer temperatures correlated to bigger floods each of those years.
Gosh, I wish you WUWT’ers could get your facts straight! Trees do NOT record floods, they record TEMPERATURES! Get with the program, people!!!!
Regards,
Vlad
Trees grow because of sunlight, food and water availability.
Tree growth across the year is during non-dormancy seasons.
Length of the growing season plus sufficient sunlight coupled with availability of nutrients and water are the factors governing the thickness of a tree ring.
Peak temperature has zero relationship to length of the growing season where temperatures above a minimum specific to that species is the only growth necessity.
Estimating peak temperatures from tree rings is akin to augury based on fish or chicken guts.
Things expand as they warm up. So obviously the area around this tree has heated up so much that the tree has expanded, raising those early markers a foot or two. /sarc
The irony is that the idiot posing that question and the idiots applauding the question are all sure that it’s a brilliant observation like the kid saying “Well I’ve never seen no plants grow out of no toilet” in Idiocracy.
https://youtu.be/ZMHfBobgLSI
Jump to 1:42 if you’re in a hurry.
There’s a flood marker on the Post Office of the small town in western Victoria where I grew up from the 1956 floods. There has been nothing anywhere near that level of flooding since.
The flood levels on the tree are likely to be pretty accurate, despite growth.
This is because most trees grow out of their uppermost tips leaving the lower bark and branches at the same level as they were.
Attached is a photo I took recently at St George in QLD
Floods in 2010-11&12 were higher than 1890, but 2020 flood was lower than1954. And this is not a tree.
Australian floods
https://www.britishpathe.com/search/query/Australia+flood
Your link only references Australian floods after 1930.
Given the size of the catchment area and the distance flood waters have to travel through various waterways before finally traveling the last leg to the ocean down the Murray, the flood heights and their timing will vary considerably determined by many factors other than the rain itself.
You beat me to it. The floodwaters are nowhere near the lower reaches of the Murray yet.
The BoM has a nice NSW flood map – http://www.bom.gov.au/nsw/flood/
There appears to be a lot of water working down the Lachlan, Murrumbidgee and Murray, which will probably work through before the big body of water coming down the Darling.
That tree will be a bit damp in another few weeks.
For those outside Australia, the Namoi and Barwon join near Brewarrina in NSW to form the Darling. Brewarrina is at an elevation of 115 metres. The Darling joins the Murray 1000km SW at Wentworth, which is at 37 metres. The Murray empties int Lake Alexandrina) another 320km away, near Tailem Bend in South Australia. Loxton is about half way between Wentworth and Tailem Bend.
The upshot is that floodwaters on the inland rivers aren’t in any sort of a hurry., so it will be some little while before we see how high the water gets on the Tree of Knowledge (I thought that was in Longreach, Queensland)
Anybody who claims that tree growth caused the markers to move upwards knows nothing about trees or how they grow. But then that is par for the course as believers in the global warming myths are experts at not knowing stuff.
Trees grow from the tips of their limbs. Existing limbs and the trunk just get fatter as more tree rings are added.
You can show this growth pattern to someone using a grape vine in its rapid growth stage. I’ve put a twist-tie on a growing shoot in the morning and by late afternoon there can be a couple of inches of new growth beyond the mark. Other plants would work better, but I don’t have such nearby.
The CSIRO (Australia) State of the Climate report 2022 includes a number of rainfall indicators ‘key points’ that are ‘cherry-picked’ to support its contention that “changes are happening at an increased pace—the past decade has seen record-breaking extremes leading to natural disasters that are exacerbated by anthropogenic (human-caused) climate change”.
For instance: “There has been a decline of around 15 per cent in April to October rainfall in the southwest of Australia since 1970” and “In the south-east of Australia, there has been a decrease of around 10 per cent in April to October rainfall since the late 1990s”.
However scrolling through the BoM rainfall time series graphs for the continent and various regions from 1910 (the longest period available) there is no significant or even apparent overall pattern or trend just chaotic variation.
Chris, is CSIRO predicting more floods from decreasing rainfall? That would be a bit cheeky, even for them.
SINCE and SINCE.
The first question should be “why did the pick those start dates?”
If the wackos are true to past form, they will destroy whatever physical records they can. That tree’s days may be numbered.
That brick building with the flood markers, too.
I don’t know about Australia, but in Ellicott City, Maryland there is a railroad bridge that has been there for well over 100 years. It is right by the river, and so the area is prone to flooding. And, despite the climate change narrative, the highest water mark on that bridge by far is hurricane Agnes in 1972! Nothing since has even come close, not even the severe flooding that happened a few years ago that washed away several buildings and killed several people.
Yet another example of previous floods, this one from Gundagai.
No tree growth to confuse and enough floods close together to answer the changes in “ irrigation channels, reservoirs and flood mitigation measures” red herring
“ the changes in “ irrigation channels, reservoirs and flood mitigation measures” red herring”
The completion of the Burrinjuck Dam in 1928, not far upstream, is not a red herring.
Sooner or later the dam is filled at which point it can’t hold more. After that the water continues to flow somewhere else, usually downstream. Does this dam divert the flow elsewhere to reduce the river flow and flood somewhere away from the marker?
The dam was intended for flood control, among other uses. They ensure that the dam is not kept full, but has capacity to hold back floods in the expected range.
Your initial comment got me interested. The initial project was called the “Barren Jack Storage Reservoir and Northern Murrumbidgee Irrigation Scheme” nothing about flood control.
I’ve no idea how full it was at the start of the current rains but Sydney and Victoria dams have been at over 90% full for a while, Victoria since August, I bookmarked these pages when there was a drought panic in those areas a while ago. Perth and WA are over 60% full almost as much as 2021 which was highest since 2015 (as far back as they show). So Australia has been getting rain prior to today.
So the question remains what happens when the dam is full and can hold no more water, where does 100% of the river flow go.
“So the question remains what happens when the dam is full and can hold no more water, where does 100% of the river flow go.”
Here is Burrinjuck, just a few weeks ago:
https://www.youtube.com/watch?v=89OGf6kMi0A&ab_channel=TimothyDeanPhotographer
Here is what WaterNSW said about it:
“Murrumbidgee dams mitigate flooding after significant rain event
5 August 2022
WaterNSW is closely monitoring rising storage levels at the two major supply dams for the Murrumbidgee valley, as the Bureau of Meteorology (BoM) forecasts ongoing wet conditions.
Burrinjuck Dam on the Murrumbidgee River sits at 103 per cent capacity, up from 90.5 per cent on Tuesday, having received a peak inflow of over 230GL/d overnight Thursday. Spillway releases are currently at 90GL/d or about 60 per cent lower than last night’s peak inflow.
WaterNSW worked with the BoM to monitor rainfall and flow forecasts and early this week made flood mitigation pre-releases from Burrinjuck Dam in particular. Releases were then able to be reduced to 500 megalitres a day as the peak inflows arrived Thursday. Flows in parts of the Yass River upstream of Burrinjuck Dam have been the highest ever recorded.
…
Careful management of dam storage, airspace requirements and pre-releases are required, no more so than in the lead up to forecast significant rainfall events.
Without Burrinjuck Dam to capture the extensive inflows of recent days from its upstream catchment the Murrumbidgee valley would be experiencing more significant flooding.”
It’s good to see that some water management bodies try to utilise the flood mitigation capabilities of their dams.
It’s still a bit limited, but can at least take the edge off the peak relatively close to the dam.
In fact the Murrumbidgee valley fared much better than the Lachlan, where the much smaller Wyangala dam was overwhelmed. There is a big push to enlarge it.
The Lachlan is a bit of a funny one. Cowra apparently wasn’t flooded much, but Forbes copped it a couple of times. Canowindra and Eugowra had severe flooding as well, so I think a lot of the flooding on the Lachlan came from the Belubulah and Mandegery Creek.
I’ve visited the area a few times, but can’t claim to be overly familiar with the water courses. It’s a nice area when there isn’t a drought or flood..
“expected range”…
What matters is the peak flood level, which is likely long past a dam’s reservoir is filled and overtopped.
At which point, a dam’s flood control capability becomes moot.
A dam temporarily capturing a few drops of water does not change peak flood level, unless the rainfall/flood even is small enough so a human hubristic constructed water obstacle can contain.
There were 8 pre-1928 floods, the top 6 being before the dam was built and far higher than current levels.
The argument was that tree growth and other changes created disputes about past events being worse than the current floods.
Your mention of Burrinjuck Dam could also be considered a red herring
Of course there were pre-1928 floods. The Burrinjuck Dam made a great improvement, as the tree indicates.
I can tell you what climate change has done so far to extreme daily rainfall – reduced both the frequency and mm volume of such days since the 1970s.
i.e. despite saturated soils and substantial rainfall due to a third consecutive La Nina year, analysis of daily gauge readings since the 1800s shows the risk of flooding rainfall has been decreasing in Australia despite popular opinion.
See http://www.waclimate.net/rainfall-insurance/index.html
With respect, Eric, that’s just one tree.
When has climate change ever, and I mean EVER, been signified by a single tree!
Wait a minute…….
🎼 Yamal be there, uh oh, Yamal be there…
LOL, fair point, I should have found a pic of a pine tree… 🙂
And I should have sung “Yamal tree there, uh oh, …”
”
http://www.unisa.edu.au/news/media2002/130902.htm
42 captures
4 Nov 2002 – 5 Jul 2022
NOV FEB APR
Previous capture 06 Next capture
2011 2012 2015
About this capture
University of South Australia
Search
Services for Students
Services for Staff
Course Information
Research and Consultancy
International Services
NEWS RELEASE
September 13 2002
The greatest River Murray flood eclipses 1956 levels
Described as the greatest catastrophe in South Australia’s history, the 1956 River Murray flood is the largest ever recorded in our state. Now UniSA researchers are causing more than a ripple with a new wave of investigations revealing that a prehistoric River Murray flood of much greater magnitude surpassed the biggest flood on record.
With records dating back only to recent times, honours students Amanda Sulley and Derek Snowball from the School of Environmental and Recreation Management undertook research, using the Black Box gum (Eucalyptus largiflorens) to interpret the pre-1840 salinity and flood history of the river.
While data that can extend the flood records is valuable, little work on these important phenomena has been undertaken in Australia.
Amanda and Derek’s research, funded by UniSA’s Division of Information Technology, Engineering and the Environment, uncovered valuable data that more fully reflects the Murray’s flooding history, according to Adjunct Professor Robert Bourman who supervised the study with Ms Joan Gibbs and Dr Fleur Tiver from the School.
To establish the reliability and timing of pre-historic floods, known as palaeofloods, the researchers looked at the distribution of the Black Box Gum in the River Murray valley..
“Black Box is considered to be a reliable biological indicator of past flood levels because it grows in distinct horizontal lines on the River Murray floodplain. Its seeds germinate in the debris deposited on the floodwater fringes of the riverbank,” Professor Bourman said.
“Radiocarbon dating of samples collected from existing gums revealed that the trees were of a modern age, with establishment in the last 250 years. This gives us an indication of the possible timing of the pre-historic flood of around the year 1750.
“The researchers also undertook a survey to obtain the heights of individual trees at their bases. This showed that the palaeoflood reached a maximum height on the River Murray at Overland Corner of 18.01 metres, making it greater than the largest flood on record, rising 2.11 metres above the 1956 flood height”
So a flood 2.11 m higher than the highest on record would not be a sign of climate change. It’s just more evidence that we have too short a history to know if an even is one in a hundred extreme or one in a thousand.
“we have too short a history to know if an even is one in a hundred extreme or one in a thousand.”
Does the flooding of every river have the same statistical distribution? A lot of work has been done on the River Nile, but do other rivers follow the same pattern?
There are historic flood markers in stone walls of the river Severn in England/Wales. Recent flood levels have been affected by upstream development. The three highest levels ever recorded at one particular location were in 1672, 1770, 1947 and 1886.
Put down the cigarette before counting. It will reduce confusion.
True, I suspect it might be four (PS I have never smoked).
Not if two different years recorded the same maximum level.
1947 is interesting, winter 1946/7 was severe with heavy snowfalls, photos and newsreels can be found on the Web. When it thawed major floods we’re the result. The Trent caused major floods in Gainsborough March 1947 known as Black Saturday.
I’m guessing the same rapid thaw caused the Severn to flood
There is a short account of Severn floods at this site
https://severntales.co.uk/severnfloods-3.html
Some dates mentioned – 1607, 1770,1818,1847, 1852, 1947.
There has this been considerable building on the lower floodplain in Worcestershire over the last 50 or more years and of course the Severn Estuary is a tidal one with the risk of tidal surges adding to the flood.
‘Tree of Knowledge’?
haha – wasn’t everything in Australia cracked up to be ‘Excellent‘ – as in the countless Centres of (climate) Excellence
C’mon peeps, get real. Australia’s climate was completely wrecked when the Aborigine finished burning the rainforest that covered Australia – The Tree Of Excellence is 30,000 years late in its arrival.
‘Oh look‘ shouts Peta ‘ I’ve just spotted a grain of sugar on Bondi Beach‘
And Aus being Aus, a drunken brawl breaks out.
If anyone wanted to do anything real for Australia they’d take themselves down to Mannum, Tailem Bend or maybe Murray Bridge and build themselves one serious FO dam. Think Hoover or Three Gorges
Thus let the MD Basin refill with water as it’s supposed to be – as it was before all the trees were chopped burned and hunted to extinction.
Do something to actually help Australia instead of endless childish squabbling over trivia.
Then Australia’s climate will come back to some sort of balance (can’t vouch for the population) – and if a few more Hunga Tunga Tonga Gone Gongs blow their tops and add some fertiliser, the results will be beyond epic.
Aboriginal populations moved into Australia around 50,000 years ago, This was in the last glaciation so climate in Australia would have been different from today’s. Even if they waited 10,000 years to start burning they had another 30K years to burn before the current climatic conditions began.
Trying to revert to an Australia of 30k years ago is going to be more difficult than you suggest. Just turning Scotland and Ireland back to pre-Neolithic forests is going to be tricky especially as people are concentrating on the Johny Come Lately Peat and Blanket Bogs
That area is as flat as a pancake 🙁
There’s about a 35m fall in the 320 km from the confluence of the Darling and Murray at Wentworth to Tailem Bend.
I wonder why, when engineers are designing a new plant, bridge or whatever, they ask the question what type of weather event needs to be considered – a 100, 200, or 500 year event? Obviously, the 500 year event design is more expensive, as it is required to counter much more extreme weather, or weather related events, such as floods.
I have a 42 inch plasma TV, still going strong after 15 years. The controller died a year ago – the TV outlasted its own controller. When I visited the electronic shop to buy a universal controller, they said it was one of the most popular models ever made, and he got lots of requests for new controllers for this particular model, because everyone who owned this model never needed to buy a new TV – they just keep replacing controllers.
Sometimes over engineering is cool ;-).
The reliability of Japanese cars has always intrigued me. Most cars in Japan are off the road at 6 years old, compulsory? So there was no great pressure to build cars that lasted 20 years before exports began in earnest. But from the 1960s when they first arrived in the UK they had a reputation for reliability, as did Japanese motorcycles.
Building quality is the most profitable way of manufacturing.
I imagine Australia imports a number of used Japanese vehicles like the UK, low mileage controls on the correct side, and cheap to buy in Japan and models not normally exported
In the 1950’s, Edward Deming created new ways to measure and control quality.
US manufactures were still dominating the world thanks to after affects of WWII, so they saw no need to change anything.
The Japanese on the other hand were very interested and adopted his methods.
Engineers that design to fulfill function are rare because most business marketing departments/teams are the ones who determine design parameters and thus constrain a design’s function and reliability.
Marketing personnel are far more concerned with personal recognition/reward and corporate employment than building reliable dependable products.
Simplified, it means customers content with long life products will not purchase new products. The only reliability in which marketing is interested is long enough to fulfill a short warranty.
Not so. It depends entirely upon the risk to public health and safety as to the types and rigor of design codes that engineers must satisfy. For consumer products and services that pose little to no risk to public health and safety, there are few design constraints other than what is marketable. Such as with most consumer electronics. But for products and services that pose significant risks to public health and safety there are highly detailed and restrictive design codes that are imposed governmentally, such as with civil infrastructure, fire protection, structural design of buildings, aviation related systems, etc.
That’s not completely true. Customers are quite aware that quality products that last a long time are valuable and worth the extra cost.
Planned obsolescence has to do with adding new features to this year’s models and then trying to convince the customers that they have to have these new features.
It depends on the expected service life and the consequences of failure. That then defines criteria for a “no-damage” event, a “damaged but still standing” event, and “catastrophic collapse” event. Think of increased resilience as insurance against future costs.
The type of weather event, including its return period (2-year, 5-year, 25-year, 100-year, etc.) is determined by applicable civil engineering design code, which is determined on a risk management basis.
Regarding the consequences of a stormwater management system failing to meet the performance of a particular return period, what is the likely cost resulting from that failure? If the cost is relatively low, such as temporary ponding on a road or landscaping, then a relatively short return period is set as the code-required return period, such as 2 years or 5 years. But if the likely cost of failure is high, such as major structural damage or loss of life, then a much longer return period is set as the design standard, such as 100 years or even 500 years.
A storm or flood return period is defined as the magnitude of precipitation or flooding such that the probability of the event is once during the return period. It is a statistical calculation based upon measured historical storm or flood flow data.
There are also various types of design storms based upon storm duration as well as return period. For very small watersheds, durations of design storms are relatively short, such as 1 hour or less, while progressively larger watersheds may need longer durations to allow all parts of the watershed to contribute to the runoff volume.
Was this interesting and relevant subject discussed at the recent COP27 ? Surly this must be a major factor in discussions on reparations and some such.
In my area of South East Queensland the highest flood on record, & the wettest year were both 1893. The next wettest year a whole 250mm less was 1954. This year is on track to be 5TH or 6Th wettest, with about 350mm less.
The driest on the other hand was 1919, next came 1994, with 1902 coming in 3rd.
Only a true believer could find any trend in that lot.
Easy. They’ll just point to a “trend” between 1902 and 1994. You underestimate their zeal to promote the propaganda.
Aside from easily dismissing the ignorant argument that the points on the tree grew upward, flood levels or stages depend upon multiple variables and antecedent conditions. As climate changes – of course it changes, everybody knows that – it is not a simple single variate linear relationship that causes higher or lower maximum flood stages.
As in climate modeling, it ain’t that simple.
All sorts of factors affect relative flood stages such as:
– the area and spatial coverage of storm rainfall relative to a particular reach of river and its contributing watershed
– the intensity of the rainfall, which of course always varies during a storm both temporally and spatially
– the duration of the storm
– the antecedent soil moisture
– changes to the watershed due to human development
– the season, due to variations in vegetation
– downstream channel obstructions
The ability to determine how and why a particular flood stage was observed is an exceedingly complex and data driven exercise. One cannot simply plug in a worldwide average atmospheric temperature (whatever that is) and poop out of the computer a resultant flood stage at a particular point on a map.
Trees grow in width. Can be checked by simply putting a nail in it and observe that it doesn’t move vertically. The tree extends at the top where each year a new shoot add to it height.
““How tall was that tree in 1956?” one person questioned.”
If the implication of that question is that the tree is now taller- implying that a mark on it has moved up. But, that’s not how trees grow- they grow only at the tips. No part of the tree moves up as the tree grows taller. Drive a nail into a tree- it’ll never move up.
And if the chainsaw doesn’t find it, the sawmill blade will.
unfortunately- though most sawmills now have methods to detect metal in logs- I hate seeing nails in trees- partly to avoid problems with processing the wood- but also it just bothers me to see a nail in any living thing even if it doesn’t have nerves- I mean, who knows? Maybe trees feel the nail but can’t complain about it. No wonder Native Americans would say a prayer to any plant or animal they harvested- at least according to myth. I hope it’s true.
Even if you humor them and agree that their believe in how trees grow has some basis in reality, it still doesn’t explain why the 1956 marker is so much higher than the 1951 marker (down the bottom, near the water’s edge) or the 1931 marker (about midway between the 1951 and 1956 markers).
You underestimate the power of the Dark Carbon.
The 1921 drought on the western Europe was the worst these regions have ever undergone. It lasted from the 1920 autumn until december 1921.
Only one third of the usual precipitations, 27 centimers of rain were recorded on the year in Paris. Extreme temperatures were observed: 44,8°C in july 1921 in Bourg (France)
The 2022 heatwave and drought in France were not so harsh, though the warmists claim the contrary, as usually…
I don’t know about the fools pushing this argument, but I learned in grade school that if you drive a marker into a tree, it stays at the same height, even as the tree grows. That’s because trees grows from their tops, and in girth, not from the ground. It sounds like, as climatology grows more sciency, they’re adding too many non-scientists to the mix.
In my hometown of the French Côte d’Azur, there is a waterlevel mark abt 180 centimeters high on a wall of the City Hall, dated oct.1858 after a very strong storm never seen again until now dropped huge amounts of rain.
The wall of the City Hall is less than 100 meters remote to the Mediterranean Sea !!!
The question remains, how tall was that building in 1858?
I used to work as a loss adjuster for insurance companies and most years we would get some flooding some where to deal with , some years were dry and others the heavens opened most of the time . The biggest floods I saw were in Lewes and Elgin , but I don’t think either has flooded substantially since the events . Houses in Lewes had water up to their ceilings in some parts , and many took over a year to fully repair as they had to dry out , which was very distressing for the owners . From personal experience I don’t think flooding is getting any worse and frequently there are contributing factors like allowing rivers to become clogged up and likewise drains . When I was a kid Dad used to take me fishing on the Dorset Stour and Hampshire Avon , and these frequently flooded in the winter , and in the summer the lush water meadows were beautiful .
A gauging station on the Murray at Lyrup near Loxton and Berri – just west of NSW in South Australia, has seen 25 Sydney Harbours go past this year and the flow rate is increasing. A Sydney Harbour is 500 GigaLitres.
The SA government will be moaning about too much environmental flow before long
Climate change is responsible for: (fill in the blank here). And they are all nuts. Or, more like it, getting paid to say whatever the latest catastrophe is caused by scary “climate change”.
“Scientists” continue to earn their paychecks in the climate alarmists world by publishing their absolute BS expecting folks to buy it. Ain’t gonna work. The CC thing is a dying cause and the desperation is setting in.
Just sayin’.
Time to chop down that tree.