By P Gosselin
Charts by Kirye, using data from the Japan Meteorological Agency (JMA)
Extreme weather events, like tropical storms, are supposed to be intensifying and becoming more frequent as the world warms, the global warming alarmists like to claim as they try to spread panic and anxiety. This, they say, is robustly supported by science and so humanity is facing dire consequences unless it stops burning fossil fuels immediately.
Today let’s use the scientific data on Pacific typhoons to see if the alarmist claims are true. These data are provided by the renowned Japan Meteorological Agency (JMA). Surely typhoons must be increasing in frequency year by year since the temperature has risen over the 20th century.
First we look at the number of typhoons occurring in September, since 1951:

Data source: JMA
Lo and behold, the trend in terms of typhoon frequency in September has been upward and so the alarmists must be correct. The science is settled!
But not so fast. Firstly, if we ignore the 1950s, the above trend would be pretty much flat, if not slightly declining. Secondly, examining only one month doesn’t really tell much at all.
Trending downward
So next we look at the data that accounts for the entire January-September period for each year since 1951:

Data source: JMA
Accounting for the entire 9-month period each year, we see that the number of typhoons occurring has been trending downward for the past 7+ decades. The warming the planet has seen over this particular period has not led to more Pacific typhoon activity. To the contrary, warming seems to be putting the brakes on storm brewing in the Pacific.
That’s good news, but you’ll never hear it from the alarmist climate hoaxers. They only want you to believe their fantasies and to not look at the real, hard data.
The typhoon trend is just more “Inconvenient Truth” that the climate scamming alarmists don’t want the public to know.
Unfortunately we are fighting against emotions not facts. The leftists and their propaganda have pushed the narrative that humans are evil and it’s all our fault for a non-problem that is not happening.
Since the western politicians have succeeded in diminishing the energy supply we will have massive amounts of cold and hungry people where many will not survive. Whether the suffering will wake people up to the scam is yet to be determined.
It will be the fault of the power companies, all greedy-bastard capitalists.
Was it Newsome a few weeks ago who was getting ready to sic state agencies on the oil companies because he didn’t think oil prices had fallen are enough and fast enough, after a small decrease in oil prices.
didn’t think GAS prices had fallen enough.
Sorry about that.
Yep, they’re so greedy they’re willing to go out of business so they can have record profits.
But this is only fighting with selected facts. Why not include the typhoons which occur in Oct, Nov and Dec?
I would hazard a guess that it was to compare apples to apples. If you want to expand on the graph, contact the JMA for their data and start plotting.
Really?? Isn’t it about showing the ACTUAL picture, not just bits of it?
How would the vast majority of people who comment here react to analysis showing a warming trend which only used 9 months of the year??
It would be laughed out the door.
Just because you agree with the result doesn’t excuse crap analysis.
Take a look at the data and maybe you’ll discover why Jan – Sept is the relevant slice of time to look at.
Or maybe you could make a better graph and post it here. I’m sure it would be appreciated.
I’d love to know why you think looking at a part of the year is relevant.
I’d love to know why you don’t look at the data and find out for yourself.
I had the same thought, so I went to the JMA link which the author supplied and downloaded all of the data for EVERY month into an Excel spreadsheet and ran a linear plot since 1951, when this dataset began.
The result? The same thing that the authors claimed about the data from Jan-Sept.
The 71-year trend is DOWN. They were hiding nothing, although I suspected cherry-picking. I was wrong.
I suggest in the future that the authors include the WHOLE data in a footnote, just to avoid naysayers.
I suspect they initially ignored the 4th quarter because they wanted to compare YTD data only and September 2022 was the most recent data they had.
Good point Dean. Why are the alarmist very tightly selective with cutoffs for historical temperature data?
Or why they look at ice extent starting in 1979.
Colder is stormier, due to difference in temperature between the trop[ics and temperate zone. Tropical seas always gert warm enough to form typhoons. Their ultimate strength depends upon the difference.
https://en.wikipedia.org/wiki/List_of_the_most_intense_tropical_cyclones#Western_North_Pacific_Ocean
Nineteen of 20 most powerful WestPac typoons occurred 1927 to 1984, with the 14th strongest in 2010. The three most powerful were in the cool 1970s.
Brad, its all part of the – global population reduction – grander plan designed for the Ruling Class Elite by our World Economic Forum’s “Great Reset.”
It all adds up to various strategies to accomplish the overall goal of mass population reduction: Pandemics, transgender sterilization, taxpayer funded abortions as contraception, Man Made Global Warm…aahhh we really meant Climate Change all along energy inflation and scarcity, international skirmishes from both withdrawals and invasions initiated by the puppet masters who run Biden, Putin, Xi jinping, et.al. The list goes on.
Consider you get cancelled for suggesting “Plus Size” is overweight or FAT. Wait! OMG did he actually use the F-word! That is body shaming don’t you know. Those of us who live in the real world also know that obesity is the leading path to an early grave. Is that a coincidence? Obesity also tends to work as an effective contraceptive.
The propaganda media has the citizenry at each others throats arguing over the minutiae of these various hobgoblins’ while making plans for a tightly controlled 1 World Government. Their vision blends “A Brave New World” with “1984” which they used as their models for this New World Government. Move over GAIA, Let’s rename you “Totalitariay” since the ruling class is so effective at renaming things to keep the dumbed down public school de-educated populous confused, in order to pull the wool over our already “Smartphone” glassed over eyes.
“The Great Resetter’s” have a target and timeframe and they intend to get the world population reduced by X Billion by the end of this century while preserving natural resources for the Elites, whom the “Davos Dandies” are dues paying members. Why do you think Leonardo Dicrapio and his ilk spend so much time flying around in their private planes lecturing those of us that can no longer afford a commercial airline fare, on our “Carbon Footprint?” They need that fossil fuel to power their many toys moored near their multiple mansions just a hop skip and helicopter ride distant.
Back in 1968 Ehrlich set the Rich and Famous teeth to itch with his runaway best selling horror fiction novel “The Population Bomb” and that has led us to that “Bridge to 21st Century” on a road that, with much study, planning and propaganda, has led us to U.S. Taxpayer funded/Chinese lab created viruses that never get talked about in the Ministry of Truth. It was all the bats fault don’t you know. The M.o.T. being the bought and paid for legacy media because they are too busy frightening the dumbed down population with Hobgoblins create on white boards by the “Davos Dandies” so that we will all skip along to their Pied Piper tunes and our ultimate early demise never to reproduce. Yet nary a word about how the Fauci (another elite government funded millionaire) Vaccine is making the stockholders of Big Pharm rich while serving the dual purpose of not protecting the old and infirmed but killing otherwise healthy youth who are being coerced by Big Brother to take the jab.
To your point, in the resetter’s mind, the cold and hungry great unwashed, especially the Clinton deplorable, are not just expendable they are the Faceless Cultural Elites target market.
Obviously more CO2 will decrease tropical storms even more.
Well, according to some they’re getting “less frequent but more severe” so if we keep it up we’ll end up with 0 storms but they’ll be infinitely powerful.
The intensity of weather is determined by the differences between the temperature at our polar regions and that of the temperature around the equator. The larger the difference the more intense the weather, as the closer the differences in temperature the weaker the weather as storms become less intense. A warmer global temperature becomes the change is mostly at the polar regions as glaciers retreat the difference of temperature at the equator is reduced, creating weaker storms. This also applies when continental mountain glaciers melt to become warmer and lowland becomes warmer, regional storms become weaker.
I’m with you. Warming causes more storms only on computers.
GIGO in action…
This article misses an important point:
Typhoons formed before weather satellites (before 1980) are likely to be undercounted. More accurate would be typhoons that made landfall.
I winder how much recent, satellite era, reporting has an artifact of reporting minor storms out of shipping lanes or inhabited areas.
So the trend line could be even more down in frequency than indicated.
US hurricane counts have a rising trend because satellites caused better detection after 1980. But US landfalling hurricanes. much more likely to be noticed, have had a declining trend since the late 1800s.
Oh, you are just cherry picking that 1898 start date for US landfalling hurricanes to show a declining trend!
/griff mode off
Fun story. My father was XO and the lead command pilot for the 409th Typhoon chasers 1948-1950. They flew instrumented B29s off Guam thru typhoons in the early research days. One typhoon shook his plane so hard that the tail vertical stabilizer was bent 18 degrees out of true. Dad was able to land the thing anyway, after which it was promptly scrapped for parts.
If you’ve ever been to the US Air Force Museum in Dayton Ohio, the P-61 Black Widow was part of the first “fly into a storm planes”. It flew into thunderstorms after WW2. (https://www.weather.gov/iln/ThunderstormProject)
That particular plane was restored to it’s WW2 appearance for the museum.
(Please don’t take this as in anyway taking away from what your Dad did. Just adding a bit of history that people can see.)
PS My grandparents lived in Dayton. I’d been to that museum many times since I was 4 or 5 while growing up. (Most of the planes now under cover were out in the open then, including that P-61.)
I was not aware of it’s weather history till about 8 years ago.
Why just Japan? Why just September? Why not use Ryan Maue’s Tropical Cyclone graphs:
Global Major Hurricane Frequency
updated September 2022
Why not use Ryan Maue’s Tropical Cyclone graphs?
Because that makes too much sense — that ACE chart
would not lead to any doubt or arguments. We can’t have that.
Hmmmm….the data shows that typhoon numbers are not increasing or decreasing. The claim that typhoon numbers have been decreasing for 7 decades could be classified as fallacious or maybe just silly.
The “little green trend line” is insignificant … mathematically and pragmatically. There were and still are about an average of 18 or 19 typhoons per season, with an expected range of 13 to 24/25. +
Kip Hansen, chief troublemaker !
The downtrend would very likely have a steeper slope if modern satellites had been available before about 1980. The data as shown are not likely to be accurate enough for ANY conclusion. Landfalling typhoons would be a more accurate statistic. I have no idea why they are not included here.
The data selection for this article makes me suspicious that the author is biased to show a downtrend.
red flags.
a few days ago i told kip how every time skeptics look at data they try the same tricks
a. point to smaller datasets
b. provide no links to data or code.
block attempts to replicate
Are the data right or wrong?
If wrong, explain why
Are the data appropriate for the conclusion reached?
If not, explain why
That is a scientific approach
You demonstrated the political character attack approach.
Analysis excludes 3 months of the year when typhoons are shown in the data.
No explanation as to why.
Totally shoddy work.
Agree
Includes likely to be undercounted pre-satellite data
Excludes three months of the year
Trend is too close to flat to be important
That’s three strikes in my book
Can you say “ad hominem?” And, you are still using “every” without citing any source to support the claim. You aren’t doing anything for your reputation!
How about before 1950? The word “since” makes me cringe, since that’s how most of the alarmist claims start – by drawing the curtain across all the “inconvenient” parts of the data…
The map below all the storm tracks available for the past 150 yrs from the National Hurricane Center & the Joint Typhoon Warning Center through
September 2006. It’s interesting to see where they form & don’t form, with
the lone hurricane in the S Atlantic being Hurricane Catarina in 2004.
https://earthobservatory.nasa.gov/images/7079/historic-tropical-cyclone-tracks
“Typhoon Frequency Has Fallen Since 1950, Contradicting Alarmist Global Warming Claims
what claims?
made by what scientist?
where?
1 evidence would be paragraph in the ipcc about typhoons and warming
How about the first sentence in the latest Summary for Policymakers Headline Statements…… Ok its extreme events not specifically typhoons, but you get the idea.
WGII Summary for Policymakers Headline Statements | Climate Change 2022: Impacts, Adaptation and Vulnerability (ipcc.ch)
Who mentioned scientists?
Unless claims can only be made by scientists these days?
Claims are made all over the place in the media about the frequency and intensity of hurricanes/typhoons and cyclones.
Anyone can make a claim…. but I’ll listen to the scientists first. And my understanding is there will not be any more cyclones. The worry is there will be bigger ones.
Here, according to Carbon Brief, is what the 2021 IPCC reports says about tropical cyclones:
Tropical cyclonesObservationsTropical cyclones (TCs) are powerful storms that develop in the warm ocean waters of the tropics. Their impacts frequently hit the headlines. In 2017, for example, a string of major hurricanes – including Harvey, Irma and Maria – caused devastation in the US and Caribbean.
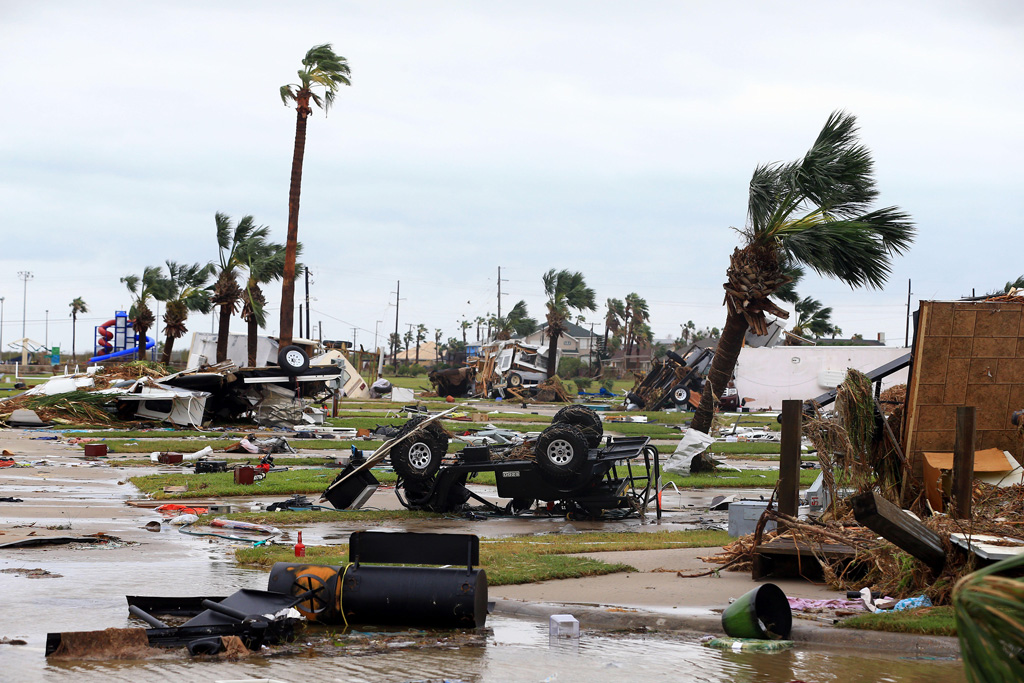 A mobile home park is destroyed after Hurricane Harvey landed in Port Aransas, Texas. Credit: Tribune Content Agency LLC / Alamy Stock Photo.
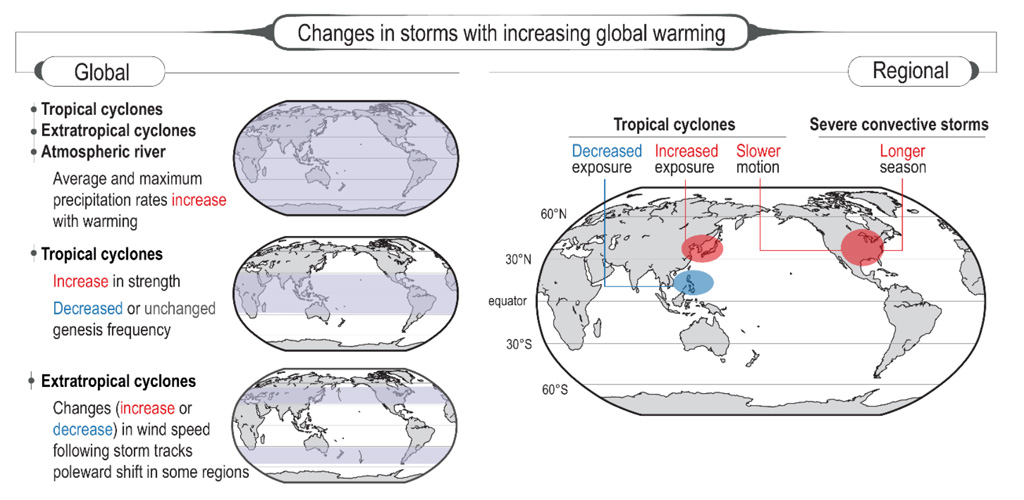 Summary schematic of past and projected changes in tropical cyclone (TC), extratropical cyclone (ETC), atmospheric river (AR), and severe convective storm (SCS) behaviour. Global changes (left-hand maps), with blue shading showing affected regions: increased mean and maximum rain-rates in TCs, ETCs and ARs (top); increased proportion of stronger TCs and decrease or no change in global frequency of TC genesis (middle); and increased and decreased ETC wind speed, depending on the region, as storm-tracks change. Regional changes (right-hand map), from left to right: poleward TC migration in the western North Pacific and subsequent changes in TC exposure; slowdown of TC forward translation speed over the contiguous US and subsequent increase in TC rainfall; and the increase in mean and maximum SCS rain rate and increase in springtime SCS frequency and season length over the contiguous US. Source: IPCC (2021) Figure 11.20.
Quantifying the effect of climate change on such storms is “challenging”, the report says, “partly because extreme storms are rare, short-lived and local”, but also because individual storms are influenced by a “high degree of random variability”. However, “despite these challenges, progress has been made since AR5”, the IPCC says.
The report concludes that “it is likely that the global proportion of category 3-5 tropical cyclone instances and the frequency of rapid intensification events have both increased globally over the past 40 years”.
(Category 3-5 tropical cyclones – known as “major” storms – are those that reach sustained wind speeds of 111 miles per hour or more.)
For context, the AR5 report previously concluded (pdf) that “confidence remains low for long-term (centennial) changes in tropical cyclone activity, after accounting for past changes in observing capabilities”.
That conclusion reflected the findings of the IPCC’s special report on the risks of extreme events (SREX) in 2012. While the IPCC’s fourth assessment report (AR4) in 2007 found (pdf) that it was likely that intense tropical cyclone activity had increased since 1970 in some regions, SREX subsequently concluded that it was “difficult to draw firm conclusions with respect to the confidence levels associated with observed trends prior to the satellite era and in ocean basins outside of the North Atlantic”, the AR5 report explains.
The AR6 report also notes that “it is very likely that the average location where TCs reach their peak wind-intensity has migrated poleward in the western North Pacific Ocean since the 1940s”, and “it is likely that TC translation speed has slowed over the US since 1900”.
The translation speed is the pace that the storms move across the Earth’s surface. In 2017, for example, Hurricane Harvey “stalled” over Houston, releasing 100cm of rain in just three days and triggering catastrophic flooding.
AttributionThe authors conclude that “there is high confidence that anthropogenic climate change contributed to extreme rainfall amounts during Hurricane Harvey and other intense TCs”. And “it is more likely than not that the slowdown of TC translation speed over the US has contributions from anthropogenic forcing”.
It is “very likely that the recent active TC seasons in the North Atlantic, the North Pacific and Arabian basins cannot be explained without an anthropogenic influence”, the report says.
For example, it notes, “the anomalous TC activity in 2015 was not solely explained by the effect of an extreme El Niño” as “there was also an anthropogenic contribution, mainly through the effects of SSTs [sea surface temperatures] in subtropical regions.”
The anthropogenic influence on active TC seasons is “principally associated with aerosol forcing [as a result of reduced air pollution], with stronger contributions to the response in the North Atlantic”, the report says.
For comparison, AR5 (pdf) found “low confidence in attribution of changes in tropical cyclone activity to human influence”. This was a result of “insufficient observational evidence, lack of physical understanding of the links between anthropogenic drivers of climate and tropical cyclone activity and the low level of agreement between studies as to the relative importance of internal variability, and anthropogenic and natural forcings”.
ProjectionsProjections for how tropical cyclones will change as warming continues suggest that “average peak TC wind speeds and the proportion of category 4-5 TCs will very likely increase globally with warming”, the IPCC says.
It is also very likely that “average TC rain rates will increase with warming, and likely that the peak rain rates will increase at greater than the Clausius-Clapeyron scaling rate of 7% per 1C of warming in some regions”, the report adds.
On tropical cyclone frequency, the IPCC says it is likely that “the global frequency of TCs over all categories will decrease or remain unchanged”. The bulk of the reduction is “at the weaker end of the intensity spectrum as the climate warms”, the report notes, while “the frequency of category 4-5 TCs will increase in limited regions over the western North Pacific”.
The figure below summarises the past and projected global (left) and regional (right) changes for tropical cyclones, as well as for extratropical cyclones – that is, those outside of the tropics – and severe convective storms and atmospheric rivers.
“The translation speed is the pace that the storms move across the Earth’s surface. In 2017, for example, Hurricane Harvey “stalled” over Houston, releasing 100cm of rain in just three days and triggering catastrophic flooding.
AttributionThe authors conclude that “there is high confidence that anthropogenic climate change contributed to extreme rainfall amounts during Hurricane Harvey and other intense TCs”.”
There is no evidence human-caused climate change caused Harvey to slow down, unless CO2 can account for how the entire atmospheric circulation set up at the time, which is what caused Harvey to stall.
Harvey was running into another weather front in the north. CO2 would have to account for that particular weather front sitting there blocking Harvey. There’s no evidence CO2 has any such effect on the Earth’s weather circulation.
This “High Confidence” is Bull**** and unscientific. It’s a guess.
Weather patterns, not CO2, is the cause of Harvey slowing down and dropping its water over a small area. There is no evidence CO2 has anything to do with controlling weather patterns.
The alarmists will use any weather event or environmental anomaly as incontrovertible evidence of man-made climate change. So it pays people to dig deeper and examine all sides of any assertions; then they’d be likely to find a combination of exaggerations, distortions, omissions, and outright misinformation.
Wonder why they used Jan to September when the most commonly stated typhoon season for Japan is July to October, with August September being the months with most typhoons?
I’m always really wary with studies which leave gaps in the data. Warmistas do this amazingly often.
Does anyone understand Japanese?
I looked at the link to the data and it appears that there are typhoons across the last 9 months of columns (I guess that it starts in Jan? A google translate gives that the initial column is Jan).
Why would you exclude typhoons in Oct, Nov and Dec from the count?
Leaving gaps in the data you analyse is pretty bad form unless you explain why.
And typhoon severity?
I have seen people argue that this information isn’t true and they’re getting more frequent, even when presented directly with this evidence.
The other response is “They’re getting so much worse”.
Facts don’t matter.
We are in a war of emotions, not facts. The alarmists have an army of propaganda specialists that have no civility or honesty. Shame does not effect those drones because they are incapable of feeling anything but the joy of fooling the public through their manipulations.
January through September, as opposed to the whole year, catches my attention as looking like cherrypicking. Also, 1951-2022 ends halfway through the third La Nina in a row, of a triple dip La Nina. La Ninas suppress Pacific tropical cyclone activity and increase Atlantic tropical cyclone activity. The current Atlantic season is running barely above average, and the two previous ones were hyperactive. Overall, storm number trends are looking close to flat, while I have seen claims for both increase and decrease of tropical cyclone counts as predicted to happen from AGW (either way with intensity increasing). And please tell us, who is using the trend of September typhoon count to claim that things are getting worse? I only saw that here.