From the Cliff Mass Weather Blog
Cliff Mass
The media was abuzz last week with stories about a greatly increased threat of a massive flooding event along the West Coast, termed an ARk Storm. The immediate stimulus of this apocalyptic vision was a recent paper by Xingying Huang and Daniel Swain in the journal Science Advances.
This article suggests that global warming has already substantially increased the probability of West Coast catastrophic flooding events and that the potential for such flooding will be profoundly enhanced by the end of the century.
In this blog, I will describe some serious problems with this study, which greatly overstates the threat. And I will show you the actual trends of heavy, prolonged precipitation.
What is an ARk Storm?
This term denotes a record-breaking, extended, unimaginably heavy precipitation event along the West Coast (mainly California) that produces catastrophic flooding. It represents a dual play on words. First, the story of Noah’s ark in the bible, with global flooding after extended (40 days and nights!) heavy rain. And second, an atmospheric river (an AR) event that has an extended (like 1000 years or “k”) return time.
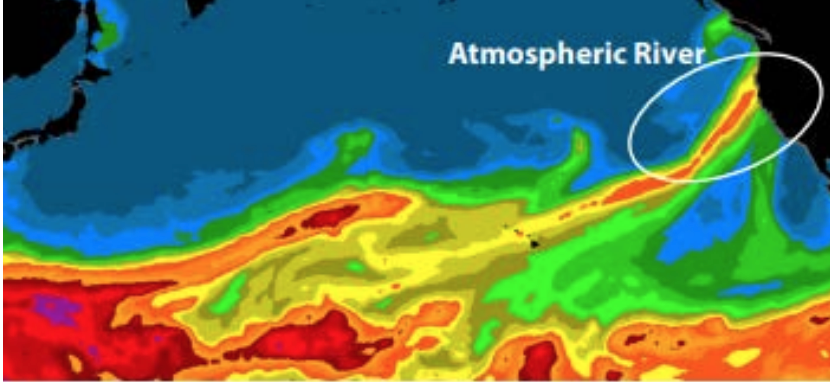
Atmospheric rivers are plumes of moisture that are associated with virtually all of the heavy precipitation events along the West Coast (see a satellite picture of one below). Also called a Pineapple Express event in our region. Think of them as a meteorological “firehose” that dumps huge amounts of rain when it hits the terrain of the western U.S.
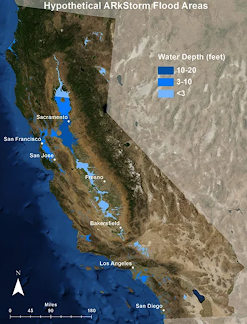
The only ARk storm in the historical record occurred during December 1861/January 1862 in California, over a period of about 30 days. 2-3 feet of rain fell over much of central California, with even more in some mountain locations, due to roughly a half-dozen extreme atmospheric river events. This heavy rain was accompanied by above-normal temperatures, melting snowpack, and a relatively wet period prior.
Larger areas of the interior of California were flooded (see estimated flooding extent below). There was extensive loss of life and damage to buildings and farms.
This kind of extreme, extended flooding event in California has occurred many times before, with evidence provided by layers of sediments in the coastal zone. Such events appear to occur every few hundred years.
The Huang/Swain paper, based on global climate model simulations, downscaled to consider local variations using a high-resolution regional model, claims that the probability of such extreme events has already been greatly enhanced by global warming and will become far, far more probable later this century.
As you can imagine, such end-of-the-world clickbait is honey to the media bears and there have been dozens of stories on this paper during the past several weeks. Unfortunately, there were serious problems with the paper and reality does not appear to agree with its estimates.
Let me demonstrate this to you below.
As I noted above, the Huang/Swain research is based not on observations but on an ensemble (collection) of climate model simulations. Regrettably, they made a serious error by using climate models forced by a far too aggressive global warming scenario (RCP8.5), which is generally considered by the peer-reviewed literature to be unrealistic (too much warming). Models driven by RCP8.5 also tend to poorly simulate the critical El Nino/La Nina cycle (also called ENSO).
RCP8.5, which makes the most draconian assumptions about fossil fuel use, produces about twice as much warming as is reasonable. And since atmospheric water vapor content goes up exponentially with temperature, the use of the wrong scenario (with too much warming) is a very serious problem looking a precipitation impacts. They should have used RCP4.5.

Another problem with this paper is their claim that the most extreme precipitation events in California occur in El Nino years. This is inconsistent with observations: neutral years (neither El Nino nor La Nina) are the most extreme precipitation years in that state. El Nino years are associated with more run-of-the-mill heavy precipitation events in southern California.
Inconsistency with observations
According to their model results, the frequency and amplitude of big, multi-week precipitation events should already have been increasing (see a reprint of their Figure 5a below).Observations do not show that. There is no evidence of an increase in heavy precipitation events or even changes in annual precipitation in California. Which implies something is wrong with their model simulations.

From Huang and Swain 2022
Let me prove this to you.
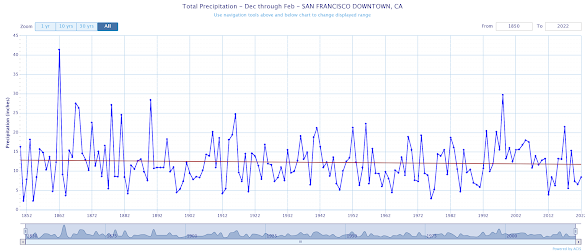
Below is the annual precipitation in San Francisco going back to 1853. You can see the enormous annual precipitation for 1862. Note that there is no upward trend during the next 150 years!! In fact, it is slightly down (there is a linear trend line in red).
Professor John Christy, of the University of Alabama Huntsville and the Alabama State Climatologist, has put together the best long-period precipitation data set in existence for the West Coast. As shown in the graphic below that he provided to me recently (below), there is no increasing trend in either 30-day extreme precipitation events over the past 130 years. The same is true of two-week extremes. During the past 50 years, global warming should have become significant.
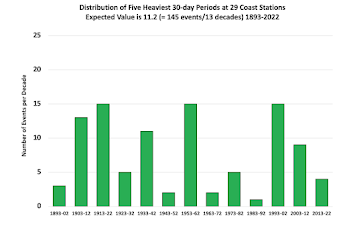
There is no increasing trend of wettest 30-day events along the West Coast. Graphics courtesy of Professor John Christy
A More Realistic View
The Huang/Swain paper makes big claims about global warming driving major increases in the potential frequency of huge ARkstorm precipitation events in California.
Unfortunately, there are major problems with their paper, including the assumption of an unrealistic increase in greenhouse gases. Their simulations compare poorly against observed trends that show no increases in ARk-like or heavy rain events.
So what do I think is the truth of the matter? (and I have published extensively in the peer-reviewed literature on the impacts of global warming on heavy precipitation along the West Coast)
Let us base our projections on assuming that greenhouse gases will follow the more realistic RCP4.5 scenarios. With advancing energy technology, the RCP2.6 scenario, might be even better.

Assuming RCP 4.5, annual precipitation will not change significantly for the West Coast during the remainder of the century, probably with a small upward trend. Global warming will result in the very heaviest atmospheric river events increasing by 10-20%. So all else being the same, BY THE END OF THE CENTURY, the potential for ARk storms will increase by that much.
But remember, it takes more than more moisture to produce an ARk storm: you need not only record-breaking atmospheric rivers but to have multiple ones, all hitting the same area. In short, there must be many extremely unusual “fire hoses” occurring in a short period and hitting the same geography.
And there is more: to have a record ARk flooding event you need to have a large pre-existing, ready to melt, snowpack in the mountains, which will lessen under global warming. And an antecedent wet period.
No wonder it is rare to get an ARk event! A lot of moving pieces. And for most of the pieces, there is no reason to expect enhancement by global warming.

Furthermore, California has a massive storage capacity for water in its reservoir system, something that did not exist 100 years ago. This can help buffer the next ARk storm.
And there is one more consideration: reality is not following the predicted extreme precipitation increase projected by the climate models. Thus, it is quite possible that the models are overdoing the impacts of global warming. I am a modeler, read the papers, and have been at endless seminars on climate model performance. Trust me, these models have major problems and many deficiences are in the area of clouds and precipitation.
“It varies” is about the only strong statement one can conclude from California rainfall records.
And as 1861-62 was just out of the Little Ice Age, any connection to warming would seem tenuous.
“It varies” not just by time but also location all along the Pacific coast. Total
state precipitation graphs can “hide” a lot of extremely dry & wet weather in different parts of a state, especially if they occur in more than one calendar
year.
Garsh! Sometimes it rains like the dickens, and sometimes it doesn’t. Who woulda thunk it?
As for California — how come the Central Valley is so flat? So carpeted with sediments washed down from the Sierra Nevada? Splashed with dried up lake beds from massive floods of the past? Does anyone think it rained like the dickens sometime before?
That’s what they told us when I took Geology 101 at the U of Cal Berkeley in 1969. But that was dispassionate, scientific-type research in those days. . . before the climate doomsday fad had really kicked in. What did they know then?
Thanks Cliff. You always bring rationality to the hysterical climate mafia claims.
Researchers extort more funding through biased, alarmist forecasts. Debunking such nonsense is a noble cause
The fact that the last ARk event happened at the end of the Little Ice Age implies that CO2 has nothing whatsoever to do with this phenomenon. Co2 in 1862 was below 300 ppm. And, that tells me that it can happen at any time, for any reason EXCEPT Co2.
It wasn’t the “last ARk event.”
The ironic thing is the clerisy hope for the worst so they can say told you so. Every time. One day they might get lucky, I suppose.
ARkham [asylum] – ….where Batman’s foes who are considered to be mentally ill are brought as patients.
One thing I would watch for is a wet season, followed by vicious mudslides from the newly-exposed burned areas. Folks like these may claim general, typical, California disaster headlines as vindication of their ARk “prediction”.
You can make models that work with Lego and Meccano.
Maybe they should stick to those systems.
I think plasticene or play doh is more in their ability range.
Nah, they eat the playdoh. Can’t let them near it. Probably were also the ones who ate paste in grade school.
That would explain a lot.
There were significant flooding events in Northern California in 1964-65 when it started raining during Christmas Break and rained pretty much non-stop for about two weeks, resulting in the failure of the un-completed Hell Hole Dam on the Rubicon River, and the consequent destruction of all the bridges above Auburn on the middle-fork of the American River. There was also considerable bridge damage in the Klamath Mountains.
In 1997, a Pineapple Express flash melted the snow on the peaks adjacent to the Feather River (Plumas Co.) in the vicinity of the sparsely vegetated Serpentine Canyon above Rich Bar. This resulted in the New Year’s Flood, which while mitigated some by PG&E dams, caused considerable damage at the mouth of the river in Marysville.
https://www.facebook.com/1997NewYearsFloodinPlumasCounty/videos/feather-river-canyon-high-water-signage/1608158876170/
Clyde,
We were on notice for evacuation along the San Joaquin river during that series of storms. All furniture was on a trailer and backed into the garage for a speedy getaway. My calculations at the time were that runoff into the Central Valley of California was about 3 million cubic feet per second at peak run off. The delta of the San Joaquin and Sacramento rivers can only transit about 1 million cubic feet per second at low tide. The pump was primed, but we dodged a bullet. The other saving graces of that storm series were empty reservoirs and having the rain mostly stay south of the Shasta Lake drainages.
I suspect it would be difficult to accuractly model the results of an storm to the 1861-62 season on today’s very change landscape.
Noah had the best heads up weather forecast ever. Humans are not that good at forecasting.
What I can’t figure out is how Noah managed to herd two cats on board. I think there’s a lost verse where God said, “Verily, I shalt round up the cats and you can take care of loading the rest of the animals.”
Hahaha! H.R. That’s great!
Let us hope for ARk storms, they could use the water in Lake Mead, and California.
“projected by the climate models”…is the clue that it don’t mean nothing.
Climate models are used by the cultists to predict all sorts of nonsense which has not come to fruition over the decades. More “chicken little” crap.
Reading the intestines of animals is way more cheaper than reading the pre-programmed runes from a billion dollar supercomputer.
And you get a free trip to New Orleans! Where beads abound.
“California has a massive storage capacity for water in its reservoir system, something that did not exist 100 years ago. This can help buffer the next ARk storm.” That would be a drop in a bucket.
Why should we wait for Mother Nature? Let’s turn California into a huge reservoir. Build a 200 foot dam across the Golden gate. That will generate a lot of renewable power, and California will be able to export it because most people will be relocated.
“most people will be relocated.”
I saw a sign that said: Don’t California my Texas
Could the Okies be about to get their revenge after all these years? Pass the dust bowl.
In the late 1960s we started a “Don’t Californicate Oregon” movement. It failed spectacularly.
If they don’t move, many of them will get their first bath in months.
Cliff ==> As you know, Atmospheric Rivers aren’t that rare in California south of Sacramento. I grew up in Los Angeles, and when we had an AR our local ball park flooded several feet deep (it was built as part of the flood control system as an overflow area so it intentionally flooded). We used to build rafts and Tom Sawyer around on the lake. The police would come and yell at us but they would grow bored and leave when we paid no attention.
ARs cause mudslides in the dry coastal mountains — I spent a three day weekend fighting flooding in Carpenteria when at UCSB in the very late 1960s.
Los Angeles has very specialized drainage canals in a widespread network to keep those AR waters running down into the sea.
The conjecture that human CO2 emissions cause “global warming” has been proven false by the “evidence” of its own advocates:
The GCM’s (“climate models”) are unskilled, unfit for purpose, i.e., failed.
By plotting the data and the model outputs on the same graphs, it becomes obvious that the models prepared for the Intergovernmental Panel on Climate Change’s 5th Assessment Report show no skill at being able to simulate those variables — no skill whatsoever.
The model simulations are so different from the observations that in many cases you may begin to wonder if they are modeling a completely different planet.
Now consider that many of the comparisons presented in Climate Models Fail cover only the past 3 to 3 ½ decades — a period to which many climate models were “tuned”. ***
(Source: Foreword, Climate Models Fail by Bob Tisdale (2014), https://feedreader.com/observe/bobtisdale.wordpress.com/+view )
I bought my first home in Sacramento in 1985, in February 1986 an atmospheric river caused Sacramento to be within a 5-hour evacuation notice, and all the Highways were flooded. My house was in the lowest part of the Natomas basin, with a projected depth of 28 feet if the levels gave way.
So, another Garbage In (RCP8.5) – Garbage Out Paper. Yawn. Regrettable, perhaps, because some parts of California look like they could use a good cleansing.
I don’t want to oversimplify this but it appears to me that Cliff has basically shown that this paper is far from realistic. My question is how can these pseudo scientists continue to publish work that is so easily shown to be wrong or misleading? My understanding is that RCP8.5 is so far removed from reality that no study should be published that depends on RCP8.5. Why are these miscreants allowed to continue to do this?
Answer: MONEY.*
*Crooks who make lots of money off the solar or wind or electric vehicle or bogus temperature data product or cladding or “carbon storage” scams own or influence the news media and also the funding for scientists.
Yes Janice I understand that but are there no standards or guidelines for publishers? This looks to be blatant lying, I hate liars, how can they continue to publish material that is so far removed from reality?
MONEY.
“Good enough for government work.”
From the article: “RCP8.5, which makes the most draconian assumptions about fossil fuel use, […]”
–
–
The reason RCP8.5 is total fantasy is that many countries are now doing everything possible to prevent fossil fuel extraction. There are all sorts of roadblocks and bans on drilling and mining that have come into play since RCP8.5 was first put out there. There currently is a fuel shortage for those who have not been paying attention.
How can you produce the fantasy of RCP8.5 when the inputs to RCP8.5 are a fantasy?
Where can I buy a dime bag of whatever they are smoking?
Peak flow on the Willamette River in Portland was 635000 cfs in December, 1861. For comparison, record flow on the Mississippi River at Baton Rouge, La is 780000 cfs.
Well, another USGS site shows peak Mississippi flows at Baton Rouge greater than 1400000 cfs.
I guess calling the river of moisture phenomenon “the Pineapple Express” isn’t scary enough so they call it an ARk Storm.
And it’s going to be worse than we thought, they claim. Worse than 1862? I seriously doubt it, so it won’t be unprecedented, now will it.
I heard a forecast the other day claiming a tropical depression may be headed for the “four-corners” area of the U.S. southwest.
I guess we still call tropical storms, tropical storms, don’t we?
The question is how did this paper pass peer review? And who were the reviewers?
These low resolution images really bring down the quality of the articles. They just provide a blurry glimpse of who knows what. The legends can’t be read. The axial scales can’t be read. Is this a sneaky way to show the uncertainty in the presentation?
The web easily supports much better.
“They should have used RCP4.5.”
Anyone saying they know what the most “realistic” response to increased CO2 on the climate is kidding themselves. I see no reason to believe that at current atmospheric concentrations that increased CO2 will have any effect whatsoever.
“Furthermore, California has a massive storage capacity for water in its reservoir system, something that did not exist 100 years ago. This can help buffer the next ARk storm.”
that is not entirely correct. The storm/floods of 96/97 are a case in point. Rain on snow event that quickly swallowed reservoir capacity and brought several dams in NorCal to stressed releases – Folsom and oroville come to mind first. Shasta was able to help contain Sacramento River flooding because it’s drainages we’re out of the direct path of the Pineapple Express.
The real danger of The Pineapple Express causing an ARKStorm is causing California’s dams to overflow and fail. See: Will the Oroville Dam survive the ARkStorm? | Climate Etc. (judithcurry.com)
“…A modeled larger ARkStorm (“Atmospheric River 1000 [year] Storm”), or one of seven larger 270 year megafloods, would likely cause California 350% or more of the damage of a 7.8 magnitude San Andreas fault ShakeOut earthquake scenario! These very real dangers of breaching the US’s highest dam, with consequent catastrophic flooding, confront us with challenging issues:
1. Are dams designed for millennial confluences of cyclones, weather fronts, and thunderstorms?
2. How many dams will be breached by the next “Pineapple Express” driven AD 1862 or 1605 level megaflood?
3. How much does human global warming add to such natural variations with climate persistence?
4. Will California rely on fragile central planning or develop robust distributed resilience?
To explore these issues, lets examine the Oroville Dam failures, and their larger context.
Oroville Dam Spillway Failures
On Feb. 12th, 2017, California’s authorities ordered the astonishing emergency evacuation of 188,000 people in Butte, Sutter, and Yuba counties, in the flood path of the Oroville high dam. (Mercury News 2017a, DWR 2017a, NDPD 2017). That was triggered by a flash warning that catastrophic failure of the emergency spillway could occur within 45 minutes due to rapid erosion by the “managed” overtopping flow – right after calming official assurances that there was no danger of dam failure.
This is soberingly similar to official assurances that “Iron” dam Soviet design of China’s Banqiao Dam was invincible (Si 1998). Officials had even authorized retaining another 32 million cubic meters of water above the dam’s safe design capacity. Yet some 171,000 to 230,000 people died from the 1975 catastrophic failure of China’s Banqiao Dam and Shimantan Dams, when deluged by Super Typhoon Nina being blocked by a cold front….”
For a detailed technical/hydrological analysis of the Oroville Dam 2017 incident hinting at the danger of an ArkStorm see: The Oroville Dam 2017 Spillway Incident – Possible Causes and SolutionsPosted on December 9, 2017 by curryja | 47 comments
by Telis Koskinas
“On February 2017, Oroville Dam gained worldwide attention when its main spillway suddenly failed, seemingly without precedent, under natural operating conditions.
While thankfully no casualties were caused by this incident, its direct and indirect effects will be felt in the local downstream communities in the years to come. Furthermore, even though the state was prepared to respond to the emergency, the fact that this event occurred with no prior warnings poses several questions on how to properly operate and inspect aging structures such as this one, and possibly highlights a larger problem the United States has with maintaining its large infrastructure….”