Originally posted at ClimateREALISM

This past week, both the U.S. and Europe have had significant localized heatwaves. The one in Europe is particularly bothersome for the media, since the area is not prepared for temperatures that exceed 100°F like areas in the in the United States in places like California, Texas, and Oklahoma, where air conditioners are the norm, regularly experience. The mainstream media has uniformly blamed the heatwaves on human caused climate change. This attribution is wrong.
The headlines have been truly apoplectic, and absolutely wrong. For example:
With Record-Breaking Heat, Europe Glimpses Its Climate Future [Scientific American]
Climate change is killing people’: Europe’s extreme heatwave continues [EuroNews]
‘Climate change affects everyone’: Europe battles wildfires in intense heat [Reuters]
And in the United States, the media hype is just as wild and just as false:
The climate crisis is driving heat waves and wildfires. Here’s how [CNN]
How the heat dome in Texas is related to climate change [Yahoo News]
Every summer in the Northern Hemisphere, it gets hot; that’s what summers do. Also, every year, a localized heatwave occurs somewhere in the world.
The error that is common to all of these news articles is the fact that weather is not climate.
Weather is an event that might last for minutes to a few days. A heatwave is a weather event that is typically linked to large scale weather patterns, such as a high-pressure cell which can create heat-domes in the summer. Climate is an average of weather over a thirty-year period as defined by the World Meteorological Organization. Note my highlights:

Each of these stories trying to link climate change to the heat wave does so without any proof whatsoever. They are nothing more than speculative fearmongering.
And, it isn’t limited to print and Internet media, the TV stations are overhyping it as well to make it seem like a crisis with the use of color. Figure 1 is a comparison of TV graphics on the British Broadcasting Corporation (BBC) in Summer 2012, versus Summer 2022.

Note that in 2012, some of the temperatures were actually higher, and they didn’t need to fill in areas with red to make it look worse than it actually is.
Another thing that you won’t find reported in the BBC on in the newspapers/Internet media is the fact that while record heat was going on in Western Europe, Eastern Europe was experiencing well below average temperatures. Figure 2 below shows the juxtaposition of heat in the UK and Europe compared to the below normal temperatures in Eastern Europe, which the press has ignored.

That dramatic regional temperature difference seen in Figure 2 is a sure sign of this being a weather pattern, and not global scale climate change aka global warming as the media would have you believe. The same applies to the heat wave in the U.S. as seen in Figure 3. It is regional in its scope, not global.

As reported in Climate at a Glance: U.S. Heatwaves,
…in recent decades in the United States, heat waves have been far less frequent and severe than they were in the 1930s.
The all-time high temperature records set in most states occurred in the first half of the twentieth century.
The heat wave of 1936 was far deadlier. To their credit, The Washington Post got it right in this report:
The killer U.S. heat wave of 1936 spread as far north as Canada, led to the heat-related deaths of an estimated 5,000 people, sent thermometers to a record 121 degrees Fahrenheit in Steele, N.D., and made that July the warmest month ever recorded in the United States.
But the real issue is that extended high temperatures like the U.S. and Europe have experienced this month have happened before climate change became the universal go-to for blame. It only takes a small amount of research to discover these facts.
A search of the term heatwaves, on Wikipedia, for instance, finds that a heatwave and drought in 1540 in Europe lasted for 11 months, and that a heatwave in 1757 was the hottest in the past 500 years until 2003. Also, Netweather Community TV, called the 1906 heatwave in the U.K during August and September, “one of the most exceptional heatwaves to ever occurred in the UK.” A 1911 heatwave in France contributed to more than 41,000 premature deaths. More recently, in Europe, there was a massive months-long heat wave in 1976. This came at a time when the Earth was experiencing a 30 year cooling trend, that led many scientists to warn the next ice age was looming. Wikipedia’s entry on the 1976 event reports:
The summer of 1976 was considered to be the hottest summer in Europe, and especially the United Kingdom, during the 20th century. A large high-pressure area dominated most of Europe for all of the summer months. The pressure system moved into place in late May 1976 and remained until the first traces of rain were recorded on 27 August.
. . .
For the entire period much of Europe was bathed in continual sunshine with the United Kingdom seeing an average of more than 14 hours of sunshine per day. 1976 was dubbed “the year of the ladybird” in that country due to the rise in the mass numbers of the insect brought on by the long hot period. In the United Kingdom, the summer coincided with a 16-week dry spell, the longest recorded over England and Wales since 1727.
That high pressure pattern is almost identical to what has been seen in UK and Europe today. The difference is that the media today immediately goes to blame climate change rather than weather patterns, and in the case of this article in The New York Times, they even try to convince you that comparisons between the hot summers of 1976 and 2022 are somehow “misleading.”
“Yet the comparison to 1976 is misleading. The highest recorded temperature then was 35.9 degrees Celsius, whereas on Tuesday it surpassed 40 degrees.”
The BBC reported:
“Thermometers hit 40.3C at Coningsby in Lincolnshire, while 33 other locations went past the UK’s previous highest temperature of 38.7C, set in 2019.”

What the BBC and the NYT don’t tell you is that the 40 degree Celsius (104 Fahrenheit) was set at a Royal Air Force (RAF) base next to the heat absorbing sea of runway asphalt and tarmac. Figure 4 shows the temperature hour-by-hour that day and where it was recorded.
By contrast, the BBC reports “…the [previous] highest temperature ever recorded in the United Kingdom was 101.7 degrees, observed in Cambridge [at Cambridge University Botanic Garden] in July 2019.“
A botanical garden is an entirely different environment than an RAF air base. The latter would be expected to be much warmer due to the lack of shade, the heat absorbing materials present, and the hot air expelled from jet engines. So, the “misleading” claim of the NYT is really about the lack of solid journalism in reporting the environment under which these temperatures were recorded.
It is well-known that the Urban Heat Island (UHI) effect can contribute to warmer high temperatures, and given the UK went from 56 million people in 1976 to 67 million in 2020, it isn’t the least bit surprising that the UHI increased as infrastructure to support that 11 million extra people was added to that island nation.
The final word comes from meteorologist Cliff Mass, PhD, who did a thorough analysis of the short-lived heatwave event and writes (emphasis his):
The truth and overwhelming scientific evidence provide a different story: the recent European heatwave is mainly the result of natural processes but was enhanced modestly by human-caused global warming.
The situation is very much like the [Pacific] Northwest heatwave of last summer; with many of the same elements.
…
The bottom line is that the recent European heat wave was caused by an amplification of the northern hemisphere wave pattern, with global warming contributing perhaps 5-10% of the warmth. Natural variability of the atmosphere was the proximate cause of the warmth and does not represent an existential threat to the population of Europe.
Clearly, there’s no cause for alarm, no matter what the media says. But the media won’t tell you any of that, because it ruins their narrative of being able to blame the heatwave on climate change, while hoping you don’t notice their distortion of the truth about ordinary weather events we see every summer.

Anthony Watts is a senior fellow for environment and climate at The Heartland Institute. Watts has been in the weather business both in front of, and behind the camera as an on-air television meteorologist since 1978, and currently does daily radio forecasts. He has created weather graphics presentation systems for television, specialized weather instrumentation, as well as co-authored peer-reviewed papers on climate issues. He operates the most viewed website in the world on climate, the award-winning website wattsupwiththat.com.
At least the “green” fireworks are a sight to see.
Thanks, Scissor, that video is entertaining and educational and…..wait a minute, it appears that that Net Zero Green Machine is generating a lot of carbon pollution.
That’s the evil bits, made from petroleum, that are burning.
not sure if this is correct, but what I read earlier it also had 800 gal of oil in the gearbox & 1300 gal of mineral oil in the ground level transformer
Real carbon, not its evil fraternal twin.
Cool. Smoke rings
Please, those are not smoke rings. They are helical carbon offsets.
Don’t laugh, that’s one of them new thermal wind turbines. Please try to keep up with the technology.
Those are the latest experimental internal combustion rotor blades they are using.
That is “clean carbon” being produced.
It’s the latest blade de-icing design.
The Green environmental blight believes that they can abort the baby, cannibalize her profitable parts, sequester her carbon pollutants, and have her, too. They could, they may still, but people… persons are waking from their woke state to smell their burnt sacrifices offered for social, redistributive, clinical, political, and fair weather causes.
griff will be along shortly to explain that these turbines haven’t been “summerized” properly.
Because of capitalist greed…
But anyway, the burning up and becoming useless is entirely predictable, so it’s no problem.
Oh dear , is he still living in your head? Thanks for keeping his memory alive.
A large expensive Catherine wheel.
”The classical period is thirty years”
Classic!
Hmm. Still say that period is far too short – you only see part of cycles with that, probably needs to be around 60-80 years to see what happens properly.
Certainly if one includes the PDO and AMO.
“A botanical garden is an entirely different environment than an RAF air base. “
There’s always something. WUWT didn’t think so much of a botanical garden when Cambridge held the record.
“Whether an important national record should be accredited to a class 2 station with unresolved UHI issues is an open question.”
But it is pointless haggling about RAF bases etc. The heat was registered in all sorts of environments. I have posted before the list of stations exceeding the old record of 38.7°C (h/t Manchester Evening News):
3.12pm: Coningsby, Lincolnshire – 40.3
12.20pm: Heathrow, west London – 40.2
1.55pm: St James’s Park, central London – 40.2
3.26pm: Gringley-on-the-Hill, Nottinghamshire – 40.1
12.28pm: Kew Gardens, south west London – 40.1
12.39pm: Northolt, west London 40.0
1.29pm: Niab in Cambridge – 39.9
11.06pm: Charlwood, Surrey – 39.9
2.05pm: Cranwell, Lincolnshire – 39.9
3.30pm: Scampton, Lincolnshire – 39.9
2.37pm: Wittering, Cambridgeshire – 39.9
3.02pm: Bramham, West Yorkshire – 39.8
2.55pm: Monks Wood, Cambridgeshire – 39.8
2.07pm: Watnall, Nottinghamshire – 39.8
1.19pm: Bushey Park, Teddington, south west London – 39.6
3.08pm: Topcliffe North Yorkshire – 39.6
1.49pm: Woburn, Bedfordshire – 39.6
2.35pm: Bedford, Bedfordshire – 39.5
3.50pm: Normanby Hall, North Lincolnshire – 39.4
1.59pm: Sheffield, South Yorkshire – 39.4
2.28pm: Sutton Bonington, Nottinghamshire – 39.4
11.17pm: Wisely, Surrey – 39.3
11.39pm: Chertsey, Surrey – 39.2
1.39pm: Marham, Norfolk – 39.2
2.12pm: Holbeach, Lincolnshire – 39.1
2.01pm: Ryhill, West Yorkshire – 39.1
1.15pm: Writtle, Essex – 39.1
12.47pm: Santon Downham, Suffolk – 39.0
1.08pm: Wellesbourne, Warwickshire – 39.0
1.55pm: Coton in the Elms, Derbyshire – 38.9
12.20pm: Iver, Buckinhamshire – 38.9
1.04pm: Coleshill, Warwickshire – 38.8
1.24pm: High Beach, Essex – 38.8
2.57pm: Leeming, North Yorkshire – 38.8
There are parks; there is a botanic garden too. There is a forest reserve. This record wasn’t just the result of a jet on a runway.
So, all CO2 then?
Nick, in his attempt to prove that it wasn’t just the RAF airfield, posts a list of measurements taken at airports and other areas experiencing the UHI effect.
Temperature measurement and recording is a mess.
https://www.baranidesign.com/faq-articles/2020/3/18/what-is-the-wmo-requirement-for-data-reporting-time-interval-of-weather-stations
WARNING: Errors from reporting in 1 minute time intervals due to the misreporting of sensor time constants by many major meteorological sensor manufacturers (or omitting response time and tau τ62.3% time constants from data sheets), the reporting of 1 min averages as mentioned in the CIMO guide is NOT RECOMMENDED.
Why average when instantaneous measurements give the desired higher readings?
Apples and lemons and cherry picking, that’s the way.
Also, blocking phenomena, phase shifts, and impulse (“catastrophic”) events.
Nick is a funny guy. He’ll do a serious amount at work to support his climate alarmist religion then do his climate alarmist carnival barking, but not not expend the mental energy to realize that, right there in his own post, clear as a bell, is the reason you cannot compare the recent measurements to older ones.
If you have any understanding of old and new instrumentation you would realise that old temperatures should be adjusted up rather than down. I’m not saying that there is anything wrong with the new stuff, Just that liquid in glass thermometers are different to the current crop of sensors.
…and urban heat island effects say that new temperatures should be adjusted down rather than up.
Guess what? The airport and botanical gardens are still there, but it’s now 16C.
All that heat went away but the CO2 is still there! How is that possible?
Excellent question Tom. I like that lots.
Really don’t care if the UK had a COUPLE DAYS of high daytime temperatures when it appears the nighttime temperatures got into the 60s F.
And 2 days of higher than normal temperatures does not make a HEATWAVE.
Nick wants you to eat cake.
It would be ok for me, if he paid for the cake…
No in the UK 3 days of above the standard maximum is what constitutes a heatwave, in the SE of England that would be over 28ºC. Nick’s right about the records, we’re not just talking about one airfield just beating the previous record, over 30 locations did so, checkout Gringley-on-the-hill which exceeded 40ºC. It wasn’t just the daily maximum record that was broken, many places had their highest nighttime minimum breaking the previous national record of 23.9ºC, many places did not go below 25ºC. The 850 hPa temperature exceeded the average by 4 sigma. The hot air has now moved East and Hamburg has since exceeded 40ºC for the first time.
If you have a high-pressure system, it hovers over a large area and brings the same hot temperatures to that large area. It should not be a surprise that it is hot all over underneath a high-pressure system.
Then the high-pressure system moves away and the hot temperatures go with it.
Much ado about nothing.
Do you want people to die?
I’d say quite the opposite.
Lol you are dumb enough to think that. I want the most freedom for humanity. The only way to prosperity is through fossil fuels and nuclear. What do you have? Joe Biden and Russia Colluuuusion 😉
He watches every second of Nasty Pelosi’s Soviet Show Trials, believing every lie they put out, feeding his TDS. How dumb is this?
So did you watch Monte? If not, why not?
Reeeeel dumb
It was a non event moron.
With “witnesses” relating laughable lies, especially the one about DJT trying to grab the steering wheel from the Secret Service agents.
“Nasty Pelosi’s Soviet Show Trials”
Come January, we will have some *real* investigations going on in Congress. Including investigations of Nancy Pelosi and her role in the January 6 debacle.
I can hardly wait!
Put me down also.
Simon is pretty dumb.
DDDDIIIIIRRRRGGGGEEEE
You are still dumb.
Define “people”.
Human beings…these lefties want people to die.
Yes. Sometimes the weather gets really hot.
Your point?
Reminder. “Record”. In the UK, we have in CET the longest temperature record in the world
300 years
3% of the Holocene.
Ergo, statistically beyond insignificant.
I’m 70. 1976 had a fabulous heatwave as well. 10 weeks. At least 32c somewhere every day.
Oddly, people didn’t run around waving their arms in the air yelling “The planet’s dying”
All those figures prove is that, as Anthony writes, sometimes in some places, it can get really hot. Weirdos like me enjoy it. What nicer than to have to wear nothing else but shorts when gardening? And how much nicer is that cold cider when done?
Check what’s been happening weatherwise in Russia maybe? AMAZING what CO2 can do
“Reminder. “Record”. In the UK, we have in CET the longest temperature record in the world
300 years”
Yes. So here are the first few, ordered in daily max T:
2022-07-19 37.3
2022-07-18 34.8
2019-07-25 34.2
1990-08-03 33.4
2020-07-31 33.2
1976-07-03 33.1
Monday broke the record. But Tuesday beat the earlier record by 3.1°C! Of the first 5 values, 4 are in the last three years.
300 years.
” Of the first 5 values , 4 are in the last three years “……Once again Nick Stokes : reliable temperature records in the United Kingdom only extend to the 1850’s and 1860’s with the implementation of the Stevenson screen housed thermometer .. The CET [ which extends to 1659 – not 300 years ] temperature gauge instrumentation was not as sophisticated prior to the 1850’s …..Notice the neurotically fixated Stokes has truncated his list to 1976 and elided the longer consecutive day heatwaves ..So too has he averted any debate concerning Anthony’s discussion of the difference between what constitutes a ‘weather event ‘ such as the 40+C hot temperature registered in the UK recently and climate ……Are there masses of birds dying on the wing from heat stress , farm animals perishing in the fields and melting beeswax dripping from the bases of hives this July as occurred in July 1808 ? Any parched rivers crossed on foot ?
Beeswax melts at about 62C. I find that anecdote a bit difficult to believe.
Look Nick, this is how you display intellectual integrity, questioning the claims that support your own point of view.
The interior of a bee hive in the sun is much warmer than the outside temperature in the shade. You know, solar heat load and the heat generated by all the bees. Ever put your hand on a brown car that’s been sitting out in the sun?
Good point, meab.
Hey Nick! This is an example of listening to other points of view, and changing your mind rather than being wedded to your favorite hypothesis.
That may well be true Rich Davis However I think the reference is to liquification in the better insulated hives ….The 1808 heatwave ‘anecdotes ‘ are from multiple primary sources including diarists and other chroniclers and many of them are corroborative ……For some reason my google search engine seems to have malfunctioned …..Peruse Tony Heller’s ” 1500 years of heatwaves ‘ and see how incredibly hot summer conditions were in the past
“Stokes has truncated his list to 1976”
No, I truncated to the top six in the whole record. No years before 1976 made the cut. If you want the top 20, it’s here
1 2022-07-19 37.3
2 2022-07-18 34.8
3 2019-07-25 34.2
4 1990-08-03 33.4
5 2020-07-31 33.2
6 1976-07-03 33.1
7 2006-07-19 33.0
8 2015-07-01 32.8
9 2003-08-09 32.8
10 1990-08-02 32.8
11 2020-08-12 32.0
12 1995-08-01 31.9
13 1975-08-04 31.9
14 1976-07-02 31.7
15 1976-07-06 31.6
16 1995-08-02 31.5
17 1948-07-29 31.5
18 1976-07-05 31.3
19 1976-07-04 31.3
20 1906-09-01 31.2
Yep , Stokes truncated his ‘ pattern’ to 1976 ….I referred to your delusional ” see the pattern yet ” that started with the 1976 temperature maximum you posted ……London registered at least 100F on August 9 1911 …..There was allegedly another 100F London hot temperature recorded during the July 1808 heatwave ..” No years before 1976 made the cut ” ? …Anyway we can always wax lyrical on the melting temperature of beeswax
” Yes , but note the UK max for 1976 in the graphic . 35.9C And 2003 was 38.4C Now we have 40.3C . See the pattern ” ? … ………………………………..Abbreviating and condensing temperature records is not a meaningful ‘pattern ” …..It is Orwellian erasure and intellectual dishonesty
So what, 1 hot day does not a summer make.
Certainly 1966 was a warm summer from the World Cup final in July through to September, we spent a fortnight on the south coast and I have photographs of my grandfather sitting in a deck chair without a shirt, something I’d never seen before. The following year was miserable.
The thing about 1976 was that it was sustained heat, with a blocking high. The same occurred in the winter of 1962-63 and again 2017-18 when it produces a long cold winter, possibly in 1946-47 winter as well.
At the moment the sun is as high as it is in southern subtropical regions and for more hours.
And all, with the exceptions of 1976 & 1990, are fleeting spikes captured with new technology that previous instruments and data collection schedules could easily have missed. I can remember asphalt melting summer days in the sixties in places where there was no instrumentation to record them. Prove to me they were cooler.
That was obviously inferior asphalt RHS. We know, because even in our warming world, the asphalt is not melting yet.
I would have much rather been there during this latest short heatwave than the one in 1976 that lasted over 2 weeks!
Ah, yes the good ol’ days.
https://pbs.twimg.com/media/FVr4HEeWUAARZQt?format=jpg&name=4096×4096
PBS 😉
Perfectly Bolshevist Shtuff
Its a Twitter link you douch.
I was not referring to your link you turd sandwich!
https://m.youtube.com/watch?v=E7pfsneLSSM
https://twitter.com/ed_hawkins/status/1538819208154324993/photo/1
twatter…
Again: in this case, size does not matter, you must also think about thikness. “Size” being the INSTANTANEOUS temperature and “thickness” the duration of the high temperatures.
If size doesn’t matter then you’re using highly inappropriate terminology.
And so your saying that the climate in the Europe has changed to be hotter?
” people didn’t run around waving their arms in the air yelling “The planet’s dying” ”
Good old 1970s days, Jeremy!…
That is because back in 1976 globul warming hadn’t been invented because the doom-mongers had other scary stories to frighten us with, but as we now know globul warming is the grand-daddy of all scary stories!!!
Indeed, months of high heat was very inconvenient for the “Ice Age Cometh” crowd. Probably the explanation was that Global Cooling causes Heat Waves.
Funny how the solution for Global Cooling was the same as for Global Warming.
Money.
Not really …Summer temperatures were extremely hot in a number of years during the Little Ice Age Consider the months long Tudor Drought heatwaves and 1783
The year 1936 in the United States had one of the hottest temperatures on record and also had one of the coldest temperatures on record later in the year.
Yes, that’s not so surprising to me. Drought isn’t caused by heat waves, heat waves are caused by drought. And drought is caused by many factors, including less evaporation due to low sea surface temperature.
Your recollection of ’76 is mistaken, the UK was running out of water! Ladybower reservoir where I had a fly fishing season ticket dried up (amongst others). Some places went 45 days without rain during the summer. Parliament passed a Drought Act and appointed a Minister for Drought. Standpipes in the street for water supplies, water rationing.
Lakes in the Welsh hills don’t usually look like this:
1_GettyImages-141322807.jpg
All Class 1 stations?
The World Meteorological Organization (WMO) defines a heat wave as a period during which the daily maximum temperature exceeds for more than five consecutive days the maximum normal temperature by 9°F (5°C), the “normal” period being defined as 1961–1990.
Did anywhere in any part of Europe or the British Isles have high temperatures that exceeded the 1961-1990 average by 5C or more for 5 consecutive days? If nbot, no heatwave. (Following technical definitions is part of the scientific method.)
I think the BBC have redefined it to be 3 days at temperatures above 25-28 degrees. It seems their range is for different parts of the country
The Met Office have revised it to the 1991-2020 mean which in the SE is as high as 28ºC, so three days exceeding that is a heat wave. That criterion was certainly met last week.
But why does the Met Office use a different definition of heatwave to the WMO?
Because the Met Office likes to move goal posts. It’s what they do.
moved the goal posts then ?
what’s next 2 days & 25c ?
Yes they have made it harder to achieve, the standard temperatures they base it on was increased this year. The previous standard was 28ºC in only one county now it is in 8 counties.
Nick,
Is it possible we are hitting record temperatures simply because in the past we only collected data twice a day and now we collect data every few seconds of every day?
No. Stations in the past had min/max thermometers which used metal markers pushed up as the temperature rose, and stayed at the max point. So they monitored continuously.
“No. Stations in the past had min/max thermometers …….”
Not where I grew up. They reported the 3 o’clock temperature every day, as a proxy for the maximum temperature.
Inconsistent methods and apparatus throughout the historic record is why NONE of this is reliable enough to be used as a basis for redesigning the world.
Continuously, yes but that does not mean they catch transitory changes. Every device has its thermal inertia and as response time.
The transfer of heat from surrounding air into the bulb of mercury takes several minutes and transitory changes will not capture.
The fact the analogue device is continuous does not guarantee its ability to record a transient change.
The time stamps on the MO. data shows they are logging every minute. If they released the data we could get information about the time constant of the device. Sadly they NEVER release the raw data. They show hourly averages for 24h then you need to pay even to get that much.
Transparency is always legal battle with these “objective” scientists.
As Dr Phil Jones once said: why should I give you all our data, all you want to do if find something wrong with it.
That attitude is prevalent these days.
Nick,
You are lying claiming that all temperature stations recorded max and min. They didn’t. You are also lying by claiming that old style max/min thermometers have one minute response thermal constants.
I didn’t say either of those things. Though it is true that a database like GHCN has only min/max measured temperatures.
Serial liar
Min/max mercury thermometer must have been the go to technology in the 1970’s rather than modern electronic measuring devices.
Yes. As the link says, they were invented in 1780. I had one when I was a kid. All readings in the GHCN database are min/max from such a device, until AWS.
I thought you said they weren’t invented until 1780?
Yes Nick for several years I operated our Grammar school weather station which used one, back in the 60s.
Min/max thermometers are not mercury, they are alcohol termometers. There can be max-only mercury thermometers, as far as I know mercury cannot be used to build minimum thermometers. I’m talking about the ones that have a tiny metal rod inside.
This is certainly a factor. My thermometer takes over 10min to stabilise if I move it to a new location. Thermistor sensors can react much faster but are supposed to be slugged to make them more like a thermometer. The trouble is the lack of homogeneity of measuring devices over the years.
Whether that happens at Heathrow, I have no idea.
Until about 30y ago no one was expecting to detect multidecadal climate variations. SST is plagued with such changes which climatologue/activists attempt to “correct” for such changes. As always this produces what they “expect” to see.
It is quite possible that a temperature peak due to a pocket of hot air lasting just a minute sets a record which would not be registered on a min/max thermometer.
This is one thing which could be checked if they Met Office would release the detailed data record but this they CHOOSE not to do. Since the Met. Office is part of the Ministery of Defence in UK, all their data belongs to the Crown and is a military secret. They can release or hide whatever they want .
Evidently you missed – I would suggest deliberately avoided – the significance of Anthony’s discussion of the difference between a ‘weather event ‘ and climate notwithstanding the extraordinary consecutive day heatwaves of 1540 ; 1757 , 1906 ,1911 and 1976 and 2003 Nick Stokes ……You are neurotically fixated on one 40+ celsius day in one nation to the exclusion of previous prolonged and more exceptionally severe heatwaves within the constraints of reliable thermometer instrumentation that only extends back to the 1850’s and 1860’s which makes this so called ‘record ‘ dubious .. The United Kingdom temperature record did not begin in 1976 ..How hot were the English temperatures during the July 1808 heatwave or 1757 let alone the 1538 -41 Tudor Droughts we may never know …..Are there any reports of masses of birds on the wing dropping dead from heat stress and farm animals expiring on the roads and fields or the melting beeswax dripping from the base of hives as occurred in 1808 ?…Any rivers so parched they can be crossed on foot this summer ?
Excellent explanation.
“Record” is a somewhat ambiguous word: it means an archive of observed data, though in the newspaper-like reports nowadays called “science” and in the newspapers themselves, it is treated as having only the meaning it has in sports: an isolated achievement higher (or lower) than the previous highest (or lowest) achievement.
However, “climate” is not a competitive sport!
The terms record [ yes agreed it has several meanings such as a paramount achievement or attainment although the context is clear here ] chronology , archive, time series et al are synonyms of sorts ….Climate and weather are not
John Dee posted recently that the CUBG has a multitude of glasshouses and a new scientific laboratory with many extractor fans – and just maybe on the day, these overwhelmed the detector.
https://jdee.substack.com/p/the-other-c-word
Some quite dodgy things with that data Nick. Apart from 11:17 p.m and 11:39 p.m.being night time temperatures. Almost exclusively the places are up and down the east of the country while nothing to the west. They seem early too, the hottest part of the day would be between 3 and 6 in the afternoon, but they’re running hottest 2 or 3 hours too soon. Strange.
I assume the 11pm times are an error. As for the rest, it was basically a mass of hot air crossing the country. That determined the timing.
Regarding the west, Wales also had a new record of 37.1ºC at Hawarden, the record was earlier exceeded near Aberystwyth. The hottest month in Wales is July with an average max of ~21ºC.
Scampton is an RAF airfield
Wittering is an RAF airfield
Kew Gardens is actually on the flightpath to Heathrow – I used to live near there – you get an early morning wake up as the Red-Eye comes in early if there has been a strong jet stream. You can almost touch the planes they are so low and slow.
Coningsby is an RAF station
Northolt is an RAF station.
—
So 5 of the 6 over 40 are iffy.
There were reports of doubles all round in the officers mess at RAF Coningsby for getting the top score – maybe their plan of putting the afterburners on while the jets were taxi-ing worked.
🙂
—
I checked up on three that are fairly close to me, Bushy Park, Chertsey and Wisley. Chertsey And Bushy Park don’t appear on the Met office list of recording stations, so I’m guessing unofficial and unverifiable. Possibly readings from someone’s car thermometer, who knows.
https://www.metoffice.gov.uk/research/climate/maps-and-data/uk-synoptic-and-climate-stations
Wisley seems to be a reasonable site though:
https://www.google.co.uk/maps/place/51%C2%B018'36.0%22N+0%C2%B028'30.0%22W/@51.3100289,-0.4749074,166m/data=!3m1!1e3!4m5!3m4!1s0x0:0xd045adfa894acb20!8m2!3d51.31!4d-0.475?hl=en-GB
I believe it is also RAF Leeming – that nice rural North Yorkshire location.
Nick Stokes wrote : ” I have posted before the list of stations exceeding the old record of 38.7°C (h/t Manchester Evening News):”
Thanks Nick.
The Manchester Evening News link from Tuesday 19 July 2022 is here :
The 34 places in England which beat 2019’s hottest UK temperature record today
https://www.manchestereveningnews.co.uk/news/uk-news/34-places-england-beat-2019s-24535898
The first two on the list, as we know, Heathrow & Coningsby are both listed as Met Office “Observing Sites” ( Coningbsy is also listed NOAA) and have thermometers adjacent to runways.
Re: #3 on the list :
1.55pm: St James’s Park, central London – 40.2
Searching the Met Office’s list of weather observation sites using the Map – Search Visible Area for St James Park at https://wow.metoffice.gov.uk/sites/search
produces 2 results : 1 on The Mall and 1 at Horseguards Parade. Both have a status of “not reporting observations”.
Unless my Met Office searches are inadequate, it appears that the only St James’s Park locations found on the Met Office website, are not listed as currently active Met Office Observing Site. I have no idea if either of them was active on 19 July.
The Weather HQ http://www.weatherhq.co.uk website shows a weather station at St James Park London here : https://www.weatherhq.co.uk/weather-station/london-st-james-park
Scrolling back through the Weather HQ chart to display the recorded temperatures at St James Park London, on 19 July, between 0300 and 2300 shows the following :
13:00 – 39.1
14:00 – 38.9
15:00 – 39.8
16:00 – 39.1
then tailing off to 23:00 etc
The recorded temperature at this Weather HQ, St James Park London location, does not show the reported “40.2 degrees at 1.55 pm” or at any other time.
It could be that the temperature peaked at 40.2 at 13:55 but the chart only plots hourly intervals, on the hour, as per the Coningsby 15:12 example : https://notalotofpeopleknowthat.wordpress.com/2022/07/19/climate-monitoring-since-the-little-ice-age/#comment-223616
but that would mean that the temperature then fell by -1.3 degrees in 5 minutes, before climbing +0.9 1 hour later, which I think is unlikely.
So, what explains this anomaly? Any ideas? Anyone?
“Why should we give you our data? You’ll only try to find something wrong with it.”
“So, what explains this anomaly? “
I suspect the times in the Manchester list are UTC (GMT) rather than daylight saving times. So 13.55 would be 14.55, corresponding to 15.00 39.8. That would also explain the 11.x pm times.
I’ve noticed that the WOW site says that a number of sites are not reporting when they clearly are. It seems to have a few bugs.
” The heat was registered in all sorts of environments … ”
NO!
“Temperature” was registered.
Lke the speed on the cars speedometer: INSTANTANEOUS.
What matters regarding heat and heat waves is how much for how long.
The Charlwood one is interesting given that it is close to me – and also right next door to the busiest single runway airport in the world, Gatwick. In balance Charlwood lies north of the end of the runway on the western side and with the wind coming from the south-west the heat of the airport, surrounding parking areas, infrastructure and commercial premises would not have been blown towards the village.
BUT….the peak temperature at Charlwood was recorded at 11:06 whereas my peak was not until 16:25 and was 38.28C, less than the suspect record from Cambridge as well as over a degree less than Charlwood. The temp graph from RAF Coningsby matches mine so there is something very spurious about the Charlwood reading.
Moving to Fahrenheit as it works better, my peak of 100.9f lasted just 4 minutes before dropping away. As a whole the temp hit 100f at 14:24 and bar 2 periods totalling 5 minutes at the start, stayed there until 16:55. 90f came at 18:53, 80f at 20:31.
“the peak temperature at Charlwood was recorded at 11:06″
It actually says 11.06 pm. That is why I think they (Manchester) are UTC times – ie 12.06 pm daylight saving. Someone converted the hours but forgot to change the pm.
Actually, many of these are airports or RAF bases.
For those at at least 40.0 degrees, half have runways: Coningsby, Heathrow, Northolt.
At 39.9, 4 out of 5 are airports/RAF bases: Charlwood (Gatwick Airport), Cranwell, Scampton, Wittering.
I haven’t checked, but it looks like the higher record temperatures have a higher proportion of airports/bases. If so, then that would be strong evidence that the records are contaminated by UHI.
As I mentioned before, Heathrow is practically a factory for manufacturing temperature records. Unless they are properly adjusted for UHI the records are meaningless.
Chris
“If so, then that would be strong evidence that the records are contaminated by UHI.”
No, if you have a mix of airport/other separated by a very few tenths, it is strong evidence that airports are much like the others. Including Heathrow.
I have checked with Western Park, Sheffield, England.
Weston Park Weather
@WPWeather.20 Jul
Weather at 0900UTC on 20/07/2022: Temp 23.5ºC, Pressure 1013.2mb, RH 57.2%. Last 24 hours: Max 38.9ºC, Min 20.9ºC, Rain 0mm, Sun 10.6 Hours.
The maximum temperature recorded for Sheffield was 38.9c NOT 39.4c.
Where has 39.4c come from?
Probably a cut and paste error like so much of climate science. 5 of those sites are not on the met office list of stations:
Niab in Cambridge looks to be an agricultural centre of some kind, probably has a weather station but not listed under that name.
Watnall, Nottinghamshire
Bushey Park, Teddington, SW London
Chertsey, Surrey
Iver, Buckinhamshire
I was going to check all of these listings, but the Met office seems to only publish the highs, no useful information like duration or temps either side of the peak, so I guess we have to accept a spike of a few seconds, maybe a minute or two max as the “hottest day evah”
“Where has 39.4c come from?”
Sheffield has 9 weather centres on the WOW site.
It looks like you have found yet another site where the UK record was exceeded.
Western Park, Sheffield is the only official Met Office historic station.
https://www.metoffice.gov.uk/research/climate/maps-and-data/historic-station-data
The stations above where the UK records were exceeded, was only genuine for locations that had the highest 850mb temperatures before cooling later in the afternoon moved in from the West. The UK record was exceeded from some more reliable stations in the countries network.
I predicted records would be broken before this event even started. The very high 850mb temperatures forecast on various models like the GFS were supportive of it with strong agreement.
For how many seconds were those temperatures recorded?
This record wasn’t just the result of a jet on a runway.
No, it was not. It was the result of an infrequent but normal weather phenomenon which this time happened to be of unusual strength in its effects. Mildly stronger, but stronger.
The phenomenon is a blocking high, in this case a high pressure ridge, with a low to the south-west of it.
What happens is that the low then, as it spins, brings hot air up from the south, particularly the Sahara.
None of this has anything to do with global warming. In the present case, its affected the whole of the UK just about. At the moment, the systems are moving east and rain and cool weather is following. There will apparently be cool air drawn in from the north early next week.
Whether there is a climate emergency due to global warming due to man made CO2 emissions or not, regardless of that, neither this phenomenon nor its intensity on this occasion are due to global climate issues.
They are entirely due to an infrequent known weather phenomenon.
If you want to argue otherwise, make an argument showing how the current modest rise in temps over the last 20-30 years has caused either the phenomenon itself, or made it more intense or different in some way. Point to the mechanism when you are asserting causation.
Not the whole of the UK, mostly the eastern half of England. The furthest west on that list is Warwickshire, none from Wales, Scotland or Northern Ireland or indeed Eire, nor have I heard any panicked reports from those areas on the news. Mostly in the south east, and the northern sites are nearly all east of the Pennines (foehn effect?) So looking more like alarmist propaganda again.
Regarding the west, Wales also had a new record of 37.1ºC at Hawarden, the record was earlier exceeded near Aberystwyth. The hottest month in Wales is July with an average max of ~21ºC.
The eastern side of England got the highest temperatures because the highest 850mb temperatures were located there around the warmest part of the day. Notice how at midday they were already leaving the London area.
https://www.wetterzentrale.de/en/reanalysis.php?map=1&model=cfsr&var=2&jaar=2022&maand=07&dag=19&uur=1200&h=0&tr=360&nmaps=24#mapref
“They are entirely due to an infrequent known weather phenomenon.”
The thing is that these infrequent phenomena seem to be happening rather frequently. There was the Pacific NW that Cliff mentioned, last year. Then the 46C in Gallargues in 2019 (WUWT here). Even that last record for UK in 2019.
Here’s some rather “precise” technical word salad.
There may well be similar events elsewhere in the world. There is nothing unusual about heat waves. I know of no evidence that they are happening more often than they used to. You have to allow for the fact that purely by chance you will get clusters. Anyway, if you have a source for increasing frequency, it would be interesting.
What we do know is that the events are not getting significantly more frequent in the UK.
In the UK the frequency of the event itself is a few times a century. The strength of the effect varies a great deal, this last one, though short duration, had a magnitude which probably makes it one in a century.
But if you cannot show a causal connexion between the modestly warming global climate and the frequency of this particular weather pattern in the UK, you have no case. Make it, if you can.
You may be able to make the case that these events will deliver slightly warmer temps than if there had not been the modest warming. But the effect, even if you can show evidence that there is a causal relationship, is very small.
Its not good enough to just cry ‘warming’, and then attribute all unusual hot temps to it. You have to show a causal relationship, and you have to show the weather pattern is unusual in recent times.
It ain’t. Read Lamb.
..They are not happening rather frequently on historical timescales at all You are citing a handful of short duration heat waves and individual hot temperatures over 3 and half years in an age of globalized communications .which skews the record … Nowhere near as frequent or as prolonged as the heatwaves of the 1930’s and one only has to check the US heatwave index to see how abnormal heatwaves were in the 1930’s ……The June 1st to late July UK mean temperature was higher in 1976 than the recent warm temperature phase in the same timeframe . . Paul Homewood posted an article on this recently
The devil will welcome you with open arms.
Nick,
Many thanks for your list. It does appear to show quite a strong correlation with airports.
I’ve pasted an annotated version of your list below. A = airport/RAF field, N = no airport/RAF field.
In the first 10 temp records, 6 are airports. In the next 10, 4 are airports. In the next 10, 2 are airports.
Charlwood is actually Gatwick airport. So, the UK’s two busiest airports appear in the 8 hottest locations. In a nutshell, the hotter a section is the more airports it has.
Records should have no place in science. What matters is the trend.
But if you must have records, then clearly they MUST be properly adjusted for UHI effects.
I simply do not believe the wild claims by the Met Office and their followers. They abandoned science long ago.
Chris
12pm: Coningsby, Lincolnshire – 40.3 53.094, -0.171 A 6 airports
12.20pm: Heathrow, west London – 40.2 51.479, -0.449 A
1.55pm: St James’s Park, central London – 40.2 N
3.26pm: Gringley-on-the-Hill, Nottinghamshire – 40.1 N
12.28pm: Kew Gardens, south west London – 40.1 N
12.39pm: Northolt, west London 40.0 51.548, -0.415 A
1.29pm: Niab in Cambridge – 39.9 N
11.06pm: Charlwood, Surrey – 39.9 (Gatwick Airport) 51.144, -0.228 A
2.05pm: Cranwell, Lincolnshire – 39.9 53.031, -0.502 A
3.30pm: Scampton, Lincolnshire – 39.9 53.307, -0.546 A
2.37pm: Wittering, Cambridgeshire – 39.9 52.611, -0.46 A 4 airports
3.02pm: Bramham, West Yorkshire – 39.8 N
2.55pm: Monks Wood, Cambridgeshire – 39.8 52.401, -0.235 A
2.07pm: Watnall, Nottinghamshire – 39.8 N
1.19pm: Bushey Park, Teddington, south west London – 39.6 N
3.08pm: Topcliffe North Yorkshire – 39.6 54.205, -1.389 A
1.49pm: Woburn, Bedfordshire – 39.6 N
2.35pm: Bedford, Bedfordshire – 39.5 (huge car park) 52.227, -0.464 A
3.50pm: Normanby Hall, North Lincolnshire – 39.4 N
1.59pm: Sheffield, South Yorkshire – 39.4 N
2.28pm: Sutton Bonington, Nottinghamshire – 39.4 N 2 airports
11.17pm: Wisely, Surrey – 39.3 51.31, -0.475 A
11.39pm: Chertsey, Surrey – 39.2 N
1.39pm: Marham, Norfolk – 39.2 52.651, 0.568 A
2.12pm: Holbeach, Lincolnshire – 39.1 N
2.01pm: Ryhill, West Yorkshire – 39.1 N
1.15pm: Writtle, Essex – 39.1 N
12.47pm: Santon Downham, Suffolk – 39.0 N
1.08pm: Wellesbourne, Warwickshire – 39.0 N
1.55pm: Coton in the Elms, Derbyshire – 38.9 N
12.20pm: Iver, Buckinhamshire – 38.9 A
1.04pm: Coleshill, Warwickshire – 38.8 N
1.24pm: High Beach, Essex – 38.8 N
2.57pm: Leeming, North Yorkshire – 38.8 54.297, -1.531 A
Chris,
“It does appear to show quite a strong correlation with airports.”
A lot of stations are at airfields – they have to have a reliably maintained station. So it’s not clear that they have undue prominence in the list. What is clear is that there is not a big separation between airports and other. Many N’s broke the record too.
Nick,
I would be the first to admit my analysis isn’t terribly rigorous.
But, surely, other things being equal, if airports had the same UHI as all other stations then they should be equally distributed throughout the list.
But they’re not. As I said, the hotter the group of ten, the more airports, and the difference is significant (6, 4 and 2).
Of course, it could be pure chance. A rigorous statistical analysis looking at all UK weather stations over previous decades should show whether airports have a significantly greater UHI. I think that common sense would certainly suggest that is so.
Yes, probably around half of all weather stations are next to a runway. This alone makes records meaningless – there weren’t many airports in 1900! At bare minimum, the Met Office should exclude all airports from records. But they won’t do that, particularly as Heathrow seems to be one of the top records producers.
In your list the timings seem odd. Some are around midday and some are in the late evening e.g. 11.17pm: Wisely
A temperature record caused by solar heating just before midnight does seem a little unlikely!
I would think these timings indicate that many of these records are spurious.
When it’s hot I always monitor the temperature in my garden in the shade. It always peaks just before 5 PM, which is what I would expect. On a typical heatwave day there are no clouds and very little wind. On BST maximum sun altitude would be at around 1 PM, but the air would continue to heat up for quite a while afterwards.
Provided the weather conditions were stable on Tuesday – which almost certainly they were, probably with no clouds and little wind – then I would expect all the record times to be similar, let’s say within an hour. But they’re all over the place.
Do you have any thoughts?
Also, is the data or graphs available for those stations, showing the temperature variations during the day?
I have a copy of the graph released by the Met Office showing a new Heathrow record maybe five years ago. The record was caused by a sharp spike, quite possibly caused by a taxiing 747 or A380.
Regards,
Chris
Chris,
” Some are around midday and some are in the late evening e.g. 11.17pm: Wisely”
AS I’ve commented elsewhere, I think the times are actually GMT, converted from GMT+1 by someone who forgot to change pm to am in these cases.
“But, surely, other things being equal, if airports had
the same UHI as all other stations then they should be
equally distributed throughout the list.”
A test would be to discount the A readings by 0.1C. Then I think the N readings definitely look over-represented in the reordered list. So if there is a bias, it is of that order. When you break a record by 1.6C, that 0.1 is fairly negligible.
So what, what’s your point? 3 days of hot weather does not make a 30 year ave climate. And still has nothing to do with trace levels of CO2 on the planet. If you can proove it , so so. Otherwise STFU.
touche !
Status of 34 UK Temperature Records 19 July 2022 as at 23 July 2022
***
Notes on the Met Office’s WOW project Observation Times :
WOW – The UK Met Office’s ‘Weather Observations Website’
https://www.weatherstations.co.uk/wow.htm
(NB Note that the Met Office typically uses GMT as its time reference, even in summer, so times may appear to be an hour slow even though the readings are up-to-date.)
The UK land observation network
https://www.metoffice.gov.uk/weather/guides/observations/uk-observations-network
For a great many years the standard observing time for synoptic purposes in the UK and for international exchange is hourly, i.e. each station reports 24 observations a day at 0000, 0100, 0200, … 2200 and 2300 UTC.
***
Summary :
As of 23 July, the status if the reported UK record temperatures at 34 Met Office locations on 19 July 2022 is as follows :
All of the temperature data tables for the Met Office sites show recordings at hourly intervals on the hour.
There may be some confusion as to how the recorded times are being presented and / or reported, either GMT ( UTC ) or GMT+1.
Some of the reported maximums at the 15 sites that were found and are reporting observations, could not easily be reconciled to the times of the recorded temperatures at those sites.
None of the reported maximum temperatures occur on the hour – all of them fall between the hours. Some occur close after the hour or close to the next hour, making for fairly large temperature rises and falls when compared to the previous or next hourly measurement, depending on which timezone is used GMT or GMT+1.
As of today, Saturday 23 July 2022, why 17 sites are showing the status: “This site is not reporting observations”, is a mystery.
***
Status of 34 UK Temperature Records 19 July 2022. As at 23 July 2022.
3.12pm: Coningsby, Lincolnshire – 40.3 RAF Coningsby Airport runway
12.20pm: Heathrow, west London – 40.2 Heathrow Airport runway
Searching the Met Office’s list of weather observation sites using the Map – Search Visible Area for St James Park at https://wow.metoffice.gov.uk/sites/search
1.55pm: St James’s Park, central London – 40.2
The Mall Not reporting observations
Horseguards Not reporting observations
3.26pm: Gringley-on-the-Hill, Nottinghamshire – 40.1 Not reporting observations
12.28pm: Kew Gardens, south west London – 40.1
Kew Gardens (959686002) Not reporting observations
Royal Botanic Gardens Kew (961266001) Not reporting observations
12.39pm: Northolt, west London 40.0 RAF Northolt Airport runway
1.29pm: Niab in Cambridge – 39.9 Not reporting observations
11.06pm: Charlwood, Surrey – 39.9 Airport runway ( < 1km from Gatwick )
2.05pm: Cranwell, Lincolnshire – 39.9 RAF Cranwell Airport runway
3.30pm: Scampton, Lincolnshire – 39.9 RAF Scampton Airport runway
2.37pm: Wittering, Cambridgeshire – 39.9 RAF Wittering Airport runway
3.02pm: Bramham, West Yorkshire – 39.8 Not reporting observations
Bramham (956816004) Not reporting observations
Bramham Park (956626005) Not reporting observations
2.55pm: Monks Wood, Cambridgeshire – 39.8 Not reporting observations
2.07pm: Watnall, Nottinghamshire – 39.8 Must have climbed 1.2 degrees in 7 minutes!
1.19pm: Bushey Park, Teddington, south west London – 39.6 Not reporting observations
3.08pm: Topcliffe North Yorkshire – 39.6 RAF Topcliffe Airport runway
1.49pm: Woburn, Bedfordshire – 39.6
2.35pm: Bedford, Bedfordshire – 39.5
3.50pm: Normanby Hall, North Lincolnshire – 39.4 Not reporting observations
1.59pm: Sheffield, South Yorkshire – 39.4 No idea which of the many Sheffield sites is referred to.
2.28pm: Sutton Bonington, Nottinghamshire – 39.4
11.17pm: Wisely, Surrey – 39.3 Not reporting observations
11.39pm: Chertsey, Surrey – 39.2 This site is not reporting observations
1.39pm: Marham, Norfolk – 39.2 RAF Marham Airport runway
2.12pm: Holbeach, Lincolnshire – 39.1 RAF Holbeach Airport runway
2.01pm: Ryhill, West Yorkshire – 39.1 Not reporting observations
1.15pm: Writtle, Essex – 39.1 Not reporting observations
12.47pm: Santon Downham, Suffolk – 39.0 Not reporting observations
1.08pm: Wellesbourne, Warwickshire – 39.0 Not reporting observations
1.55pm: Coton in the Elms, Derbyshire – 38.9 Not reporting observations
12.20pm: Iver, Buckinhamshire – 38.9 Cannot find site.
1.04pm: Coleshill, Warwickshire – 38.8 Recorded measurements do not agree with reported maximums.
1.24pm: High Beach, Essex – 38.8 Cannot find site.
2.57pm: Leeming, North Yorkshire – 38.8 RAF Leeming Airport runway
***
3.12pm: Coningsby, Lincolnshire – 40.3
Note : Coningsby is in fact RAF Coningsby.
Airport runway.
Met Office search : https://wow.metoffice.gov.uk/sites/search
Coningsby (7008) https://wow.metoffice.gov.uk/observations/details/?site_id=7008
19/07/2022 11:00:00 34.3
19/07/2022 12:00:00 36.1
19/07/2022 13:00:00 37.3
19/07/2022 14:00:00 39.1
19/07/2022 15:00:00 39.7
19/07/2022 16:00:00 39.6
19/07/2022 17:00:00 39.4
***
12.20pm: Heathrow, west London – 40.2
Note : Heathrow is of course, Heathrow Airport.
Airport runway.
Met Office search : https://wow.metoffice.gov.uk/sites/search
Heathrow (12004) https://wow.metoffice.gov.uk/observations/details/?site_id=12004
19/07/2022 11:00:00 35.9
19/07/2022 12:00:00 38.1
19/07/2022 13:00:00 40.2
19/07/2022 14:00:00 39.2
19/07/2022 15:00:00 38.7
19/07/2022 16:00:00 38.2
19/07/2022 17:00:00 37.6
***
1.55pm: St James’s Park, central London – 40.2
Met Office search : https://wow.metoffice.gov.uk/sites/search
The Mall (949196003) https://wow.metoffice.gov.uk/observations/details/?site_id=949196003
Met Office status : This site is not reporting observations
Horseguards Parade (950876002) https://wow.metoffice.gov.uk/observations/details/?site_id=950876002
Met Office status : This site is not reporting observations
Reported 40.2 @ 13:55 Temperature not found :
https://wattsupwiththat.com/2022/07/22/wrong-legacy-media-climate-change-is-not-causing-summer-heatwaves-in-the-u-s-and-europe/#comment-3561699
***
3.26pm: Gringley-on-the-Hill, Nottinghamshire – 40.1
Met Office search : https://wow.metoffice.gov.uk/sites/search
Gringley on The Hill (949166019) https://wow.metoffice.gov.uk/observations/details/?site_id=949166019
Met Office status : This site is not reporting observations
Gringley on the Hill (26063096) https://wow.metoffice.gov.uk/observations/details/?site_id=26063096
Met Office status : Last Observation Time 10:00 | 07 Aug 2013
Met Office status : 19 July 2022 : No data available
***
12.28pm: Kew Gardens, south west London – 40.1
Met Office search : https://wow.metoffice.gov.uk/sites/search
Kew Gardens (959686002) https://wow.metoffice.gov.uk/observations/details/?site_id=959686002
Met Office status : This site is not reporting observations
Royal Botanic Gardens Kew (961266001) https://wow.metoffice.gov.uk/observations/details/?site_id=961266001
Met Office status : This site is not reporting observations
***
12.39pm: Northolt, west London 40.0
Met Office search : https://wow.metoffice.gov.uk/sites/search
Northolt (5023) – https://wow.metoffice.gov.uk/observations/details/?site_id=5023
Note : Northolt is actually RAF Northolt
Airport runway.
19-07-2022 11:00 35.7
19-07-2022 12:00 37.3
19-07-2022 13:00 39.2
19-07-2022 14:00 39.5
19-07-2022 15:00 39.1
19-07-2022 16:00 38.0
19-07-2022 17:00 36.9
Reported 40.0 @ 12:39 Temperature not found on Met Office sites :
But https://www.weatherhq.co.uk/weather-station/northolt shows :
19-07-2022 12:00 37.3
19-07-2022 12:20 38.0
19-07-2022 12:50 39.0
19-07-2022 13:20 40.0
19-07-2022 14:00 39.5
19-07-2022 14:50 39.0
19-07-2022 15:00 39.1
19-07-2022 15:20 38.0
19-07-2022 16:20 37.0
Reported 40.0 @ 12:39 Temperature found on Weather HQ RAF Northolt @ 13:20
***
1.29pm: Niab in Cambridge – 39.9
( NIAB = National Institute of Agricultural Botany )
Met Office search : https://wow.metoffice.gov.uk/sites/search
Cambridgeniab (958676001) https://wow.metoffice.gov.uk/observations/details/?site_id=958676001
Met Office status : This site is not reporting observations
***
11.06pm: Charlwood, Surrey – 39.9
11:06 PM has to be a reporting error!
Met Office search : https://wow.metoffice.gov.uk/sites/search
Charlwood (7005) https://wow.metoffice.gov.uk/observations/details/?site_id=7005
Less than 1km from the end of Gatwick Airport runway.
19-07-2022 11:00 37.3
19-07-2022 12:00 39.1
19-07-2022 13:00 38.6
19-07-2022 14:00 38.3
19-07-2022 15:00 38.9
19-07-2022 16:00 37.3
19-07-2022 17:00 35.7
The reported 39.9 @ 11:06 AM not PM Temperature not found, but, may have been 12:06 PM instead, which means that it had climbed by +0.8 degrees in 6 minutes then fell by -1.3 in 54 minutes
***
2.05pm: Cranwell, Lincolnshire – 39.9
Met Office search : https://wow.metoffice.gov.uk/sites/search
Cranwell (963536002) https://wow.metoffice.gov.uk/observations/details/?site_id=963536002
Note : Cranwell is actually RAF Cranwell
Airport runway.
19/07/2022 10:00:00 29.6
19/07/2022 11:00:00 32.9
19/07/2022 12:00:00 35.5
19/07/2022 13:00:00 37.9
19/07/2022 14:00:00 38.4
19/07/2022 15:00:00 39.1
19/07/2022 16:00:00 38.8
19/07/2022 17:00:00 39.2
Reported 39.9 @ 14:05 Temperature not found
***
3.30pm: Scampton, Lincolnshire – 39.9
Met Office search : https://wow.metoffice.gov.uk/sites/search
Scampton (6031) https://wow.metoffice.gov.uk/observations/details/?site_id=6031
Note : Scampton is actually RAF Scampton
Airport runway.
19/07/2022 14:00:00 38.0
19/07/2022 15:00:00 39.2
19/07/2022 16:00:00 38.8
It is possible that the reported 39.9 degrees was recorded at 15:30 then fell by -1.1 in 30 minutes.
Note :
https://www.weatherhq.co.uk/weather-station/scampton
shows the temperature to be absolutely flat between 15:00 and 18:00 on July 19 !!!
***
2.37pm: Wittering, Cambridgeshire – 39.9
Met Office search : https://wow.metoffice.gov.uk/sites/search
Wittering (4025) https://wow.metoffice.gov.uk/observations/details/?site_id=4025
Note : Wittering is actually RAF Wittering
Airport runway.
19/07/2022 11:00:00 35.5
19/07/2022 12:00:00 36.8
19/07/2022 13:00:00 37.9
19/07/2022 14:00:00 38.7
19/07/2022 15:00:00 38.8
19/07/2022 16:00:00 38.8
19/07/2022 17:00:00 39.1
19/07/2022 19:00:00 35.2
***
3.02pm: Bramham, West Yorkshire – 39.8
Met Office search : https://wow.metoffice.gov.uk/sites/search
Bramham (956816004) https://wow.metoffice.gov.uk/observations/details/?site_id=956816004
This site is not reporting observations
Bramham Park (956626005) https://wow.metoffice.gov.uk/observations/details/?site_id=956626005
This site is not reporting observations
***
2.55pm: Monks Wood, Cambridgeshire – 39.8
Met Office search : https://wow.metoffice.gov.uk/sites/search
Monks Wood (963326004) https://wow.metoffice.gov.uk/observations/details/?site_id=963326004
This site is not reporting observations
***
2.07pm: Watnall, Nottinghamshire – 39.8
Met Office search : https://wow.metoffice.gov.uk/sites/search
Watnall (3029) https://wow.metoffice.gov.uk/observations/details/?site_id=3029
19/07/2022 11:00:00 34.1
19/07/2022 12:00:00 36.3
19/07/2022 13:00:00 37.9
19/07/2022 14:00:00 38.6
19/07/2022 15:00:00 39.0
19/07/2022 16:00:00 39.2
19/07/2022 17:00:00 35.6
See also : Met Office Nottingham Watnall site, UK
https://catalogue.ceda.ac.uk/uuid/358641354ff546c2a761c9094c414373
***
1.19pm: Bushey Park, Teddington, south west London – 39.6
Typo in the name. It should be Bushy Park, Teddington.
Met Office search : https://wow.metoffice.gov.uk/sites/search
Bushy Park (920076001) https://wow.metoffice.gov.uk/observations/details/?site_id=920076001
This site is not reporting observations
***
3.08pm: Topcliffe North Yorkshire – 39.6
Met Office search : https://wow.metoffice.gov.uk/sites/search
Topcliffe (5031) https://wow.metoffice.gov.uk/observations/details/?site_id=5031
Note : Topcliffe is actually RAF Topcliffe
Airport runway.
19/07/2022 12:00:00 34.6
19/07/2022 13:00:00 35.2
19/07/2022 14:00:00 37.0
19/07/2022 15:00:00 37.6
19/07/2022 16:00:00 39.0
19/07/2022 17:00:00 34.0
***
1.49pm: Woburn, Bedfordshire – 39.6
Met Office search : https://wow.metoffice.gov.uk/sites/search
Woburn (952936004) https://wow.metoffice.gov.uk/observations/details/?site_id=952936004
19/07/2022 11:00:00 36.1
19/07/2022 12:00:00 36.6
19/07/2022 13:00:00 37.8
19/07/2022 14:00:00 38.4
19/07/2022 15:00:00 39.3
19/07/2022 16:00:00 38.5
19/07/2022 17:00:00 37.4
***
2.35pm: Bedford, Bedfordshire – 39.5
Met Office search : https://wow.metoffice.gov.uk/sites/search
Bedford (5006) https://wow.metoffice.gov.uk/observations/details/?site_id=5006
19/07/2022 11:00:00 35.1
19/07/2022 12:00:00 37.0
19/07/2022 13:00:00 38.3
19/07/2022 14:00:00 38.2
19/07/2022 15:00:00 39.0
19/07/2022 16:00:00 38.9
19/07/2022 17:00:00 38.0
***
3.50pm: Normanby Hall, North Lincolnshire – 39.4
Met Office search : https://wow.metoffice.gov.uk/sites/search
Normanby Hall (958436008) https://wow.metoffice.gov.uk/observations/details/?site_id=958436008
This site is not reporting observations
***
1.59pm: Sheffield, South Yorkshire – 39.4
Met Office search : https://wow.metoffice.gov.uk/sites/search
I have no idea which of the many Sheffield sites has been reported.
***
2.28pm: Sutton Bonington, Nottinghamshire – 39.4
Met Office search : https://wow.metoffice.gov.uk/sites/search
Sutton Bonington (942666001) https://wow.metoffice.gov.uk/observations/details/?site_id=942666001
19/07/2022 12:00:24 38.3
19/07/2022 12:15:20 38.7
19/07/2022 12:45:01 39.2
19/07/2022 13:00:04 39.3
19/07/2022 13:15:22 39.5
19/07/2022 13:30:01 39.3
19/07/2022 13:45:03 39.7
19/07/2022 14:00:06 39.6
19/07/2022 14:15:20 39.4
19/07/2022 14:45:01 39.6
19/07/2022 15:00:04 39.7
19/07/2022 15:15:01 39.4
19/07/2022 15:30:01 39.7
19/07/2022 15:45:03 39.9
19/07/2022 16:00:05 39.6
19/07/2022 16:15:01 39.6
19/07/2022 16:30:04 37.7
19/07/2022 16:45:01 36.9
19/07/2022 17:00:04 36.7
***
11.17pm: Wisely, Surrey – 39.3
That’s a typo, It should read Wisley, Surrey.
Met Office search : https://wow.metoffice.gov.uk/sites/search
Wisley (951006011) https://wow.metoffice.gov.uk/observations/details/?site_id=951006011
This site is not reporting observations
11:17 pm must be a typo. But if it was 11:17 am then that seems quite early in the day.
***
11.39pm: Chertsey, Surrey – 39.2
Met Office search : https://wow.metoffice.gov.uk/sites/search
Chertsey (959396004) https://wow.metoffice.gov.uk/observations/details/?site_id=959396004
This site is not reporting observations
11:39 pm must be a typo. But if it was 11:39 am then that seems quiet early in the day.
***
1.39pm: Marham, Norfolk – 39.2
Met Office search : https://wow.metoffice.gov.uk/sites/search
Note : Marham is in fact RAF Marham
Airport runway
19/07/2022 11:00:00 33.8
19/07/2022 12:00:00 36.4
19/07/2022 13:00:00 37.9
19/07/2022 14:00:00 38.2
19/07/2022 15:00:00 38.6
19/07/2022 16:00:00 38.0
19/07/2022 17:00:00 37.7
***
2.12pm: Holbeach, Lincolnshire – 39.1
Met Office search : https://wow.metoffice.gov.uk/sites/search
Note : Holbeach is in fact RAF Holbeach
Holbeach (15001) https://wow.metoffice.gov.uk/observations/details/?site_id=15001
19/07/2022 11:00:00 33.9
19/07/2022 12:00:00 36.3
19/07/2022 13:00:00 37.2
19/07/2022 14:00:00 38.4
19/07/2022 15:00:00 38.6
19/07/2022 16:00:00 36.9
19/07/2022 17:00:00 38.0
***
2.01pm: Ryhill, West Yorkshire – 39.1
Met Office search : https://wow.metoffice.gov.uk/sites/search
Ryhill (957276003) https://wow.metoffice.gov.uk/observations/details/?site_id=957276003
This site is not reporting observations
***
1.15pm: Writtle, Essex – 39.1
Met Office search : https://wow.metoffice.gov.uk/sites/search
Writtle (952876008) https://wow.metoffice.gov.uk/observations/details/?site_id=952876008
This site is not reporting observations
***
12.47pm: Santon Downham, Suffolk – 39.0
Met Office search : https://wow.metoffice.gov.uk/sites/search
Santon Downham (958566014) https://wow.metoffice.gov.uk/observations/details/?site_id=958566014
This site is not reporting observations
***
1.08pm: Wellesbourne, Warwickshire – 39.0
Met Office search : https://wow.metoffice.gov.uk/sites/search
Wellesbourne (960336011) https://wow.metoffice.gov.uk/observations/details/?site_id=960336011
This site is not reporting observations
***
1.55pm: Coton in the Elms, Derbyshire – 38.9
Met Office search : https://wow.metoffice.gov.uk/sites/search
Coton In The Elms (957336010) https://wow.metoffice.gov.uk/observations/details/?site_id=957336010
This site is not reporting observations
***
12.20pm: Iver, Buckinhamshire – 38.9
Met Office search : https://wow.metoffice.gov.uk/sites/search
I cannot find an active weather station on the Met Office site around Iver, Buckinghamshire.
***
1.04pm: Coleshill, Warwickshire – 38.8
Met Office search : https://wow.metoffice.gov.uk/sites/search
Coleshill (3015) https://wow.metoffice.gov.uk/observations/details/?site_id=3015
19/07/2022 11:00:00 34.9
19/07/2022 12:00:00 36.1
19/07/2022 13:00:00 37.0
19/07/2022 14:00:00 38.7
19/07/2022 15:00:00 37.7
19/07/2022 16:00:00 37.0
19/07/2022 17:00:00 36.3
*
Two weather stations have been found on wunderground.com in the Coleshill, Warwickshire area :
Weather Station ID: ICOLESHI3
and
Weather Station ID: IBIRMI13
*
The data table for ICOLESHI3 on 19 July 2022 shows a peak of 98.7 Farenheit = 37.06 Centigrade at 14:04
https://www.wunderground.com/dashboard/pws/ICOLESHI3/table/2022-07-19/2022-07-19/daily
The data table for IBIRMI13 on 19 July 2022 shows a peak of 98.6 Farenheit = 37.00 Centigrade at 14:24
https://www.wunderground.com/dashboard/pws/IBIRMI13/graph/2022-07-19/2022-07-19/daily
The reported record temperature of 38.8 Centigrade = 101.8 Farenheit at Coleshill cannot be seen in the wunderground.co data tables for ICOLESHI3 or IBIRMI13
***
1.24pm: High Beach, Essex – 38.8
This is a typo. It should read High Beech, Essex
Met Office search : https://wow.metoffice.gov.uk/sites/search
Cannot find any site at High Beech, Essex. Possibly Met Police helipad at Lippitts Hill airfield but not on the Met Office website & not found elsewhere.
***
2.57pm: Leeming, North Yorkshire – 38.8
Met Office search : https://wow.metoffice.gov.uk/sites/search
Leeming (3018) https://wow.metoffice.gov.uk/observations/details/?site_id=3018
Note : Leeming is in fact RAF leeming.
Airport runway.
19/07/2022 11:00:00 30.0
19/07/2022 12:00:00 32.6
19/07/2022 13:00:00 35.3
19/07/2022 14:00:00 36.2
19/07/2022 15:00:00 37.5
19/07/2022 16:00:00 38.3
19/07/2022 17:00:00 32.7
***
Excellent work, thanks Mark.
Thanks Right-Handed Shark, much appreciated.
’17 are “Not reporting observations”’
I think what you are finding are deficiencies (there are many) in the WOW project site. Those stations clearly are reporting observations, as you can tell by just going to the regular MO forecasts page, which gives 24 hrs of past observations. For example, here is St James Park.
“There may be some confusion as to how the recorded times are being presented and / or reported, either GMT ( UTC ) or GMT+1.”
Yes. I think the list I posted are GMT, with errors where am/pm was not updated.
That’s OK Nick Stokes, you are welcome. Please, don’t mention it.
Nick Stokes wrote :
“I think what you are finding are deficiencies (there are many) in the WOW project site. Those stations clearly are reporting observations, as you can tell by just going to the regular MO forecasts page, which gives 24 hrs of past observations. For example, here is St James Park.”
https://www.metoffice.gov.uk/weather/forecast/gcpvj00tc#?date=2022-07-24
The link you provide just takes you to a Met Office weather forecast page for St James Park ( Greater London )
The link is not to a Met Office Weather Observation Site.
As I stated in my first reply to you, the only two WOW sites that show up for the St James Park vacinity in Central London are The Mall and Horseguards, both of which are “not reporting observations”.
Re: GMT and / or GMT+1 :
Nick Stokes wrote :
“Yes. I think the list I posted are GMT, with errors where am/pm was not updated.”
OK so, let’s take one example – say the last one above at RAF Leeming.
***
2.57pm: Leeming, North Yorkshire – 38.8
Met Office search : https://wow.metoffice.gov.uk/sites/search
Leeming (3018) https://wow.metoffice.gov.uk/observations/details/?site_id=3018
Note : Leeming is in fact RAF Leeming.
Airport runway.
19/07/2022 11:00:00 30.0
19/07/2022 12:00:00 32.6
19/07/2022 13:00:00 35.3
19/07/2022 14:00:00 36.2
19/07/2022 15:00:00 37.5
19/07/2022 16:00:00 38.3
19/07/2022 17:00:00 32.7
***
Are you suggesting that the reported time for the alleged record temperature at RAF Leeming was 14:47 GMT ?
The reason I posted the data from the tables was so that readers could make up their own minds, without any commentary from me, about the veracity of the reported timings.
I also posted two Met office sources, which, if I have understood them correctly, mean that the timestamps are always UTC ( GMT ).
If so, then is there a problem with RAF Leeming’s reported record temperature of 38.8 at 14:57?
If I’m reading the data correctly then that would indicate a rise of +2.6 degrees in 57 minutes followed by a fall of =1.3 degrees in 3 minutes.
Surely, that cannot be correct?
As for the second part of your statement : “… with errors where am/pm was not updated.”
It is very odd that some timings have been reported as :
11.17pm for Wisley ( reported as Wisely )
11.39pm for Chertsey
11.06pm for Charlwood
These 3 sites are in Surrey. If these times were supposed to be AM, then they seems a little early in the day compared to all of the others, with the next nearest in time being Heathrow at 12:20 PM.
“Are you suggesting that the reported time for the alleged record temperature at RAF Leeming was 14:47 GMT ?”
I think it is 14.57 GMT, and so 15.57 GMT+1. On your list, it was 38.3 at 16.00 GMT+1, a drop of 0.5.
“These 3 sites are in Surrey. If these times were supposed to be AM”
They would be 12.17pm. 12.39pm, 12.06pm.
I think someone converted to GMT by subtracting 1 from the GMT+1 times, and forgot that 12.17pm goes to 11.17am.
So Nick, are you are proposing that some of the reported times in that list are GMT and others are GMT+1 ?
Have I understood you correctly?
I think you are suggesting that all of the timings in the media report are in GMT and all of the timings accessible using the Met Office WOW website data tables are in GMT+1.
Correct?
Yes
“The link is not to a Met Office Weather Observation Site.”
There is a Met Office Site in St James Park. Here is a photo.
Thanks Nick.
I do not doubt that the site known as “St James Park London” exists. I am trying to understand why it does not show up on the Met Office WOW website.
I have had a reply today from the Met Office containing a link to a list of their synpotic sites. The list gives the location of the site known as “St James Park London” as :
London, St James’s Park England 51.504, -0.129 Automatic
Now, about the temperature data for “St James Park London”…
How do we access that and for the other sites that do not show up on WOW ?
Reply from the Met Office today :
Not all of our observation sites are listed on WOW, so this is why you might not be able to find some of them, including St James’ Park, on there.
Additionally a lot of the data and sites on WOW are from members of the public who upload their own data.
*
That’s a surprise to me. The Met office relies on weather observations from anyone. How do they verify them?
“The Met office relies on weather observations from anyone.”
No, it doesn’t. This is your confusion of deficiencies in the WOW web site with problems with the data. The WOW site is not the data.
Now we know what a dog does on it’s day off.
Corrections to Status of 34 UK Temperature Records 19 July 2022 :
H/t to Chris Wright
https://wattsupwiththat.com/2022/07/22/wrong-legacy-media-climate-change-is-not-causing-summer-heatwaves-in-the-u-s-and-europe/#comment-3561866
12.20pm: Iver, Buckinhamshire – 38.9 A
2.55pm: Monks Wood, Cambridgeshire – 39.8 52.401, -0.235 A
2.35pm: Bedford, Bedfordshire – 39.5 (huge car park) 52.227, -0.464 A
2.12pm: Holbeach, Lincolnshire – 39.1 N
*
I had missed the fact that Bedford is an RAF airfield, RAF Thurleigh.
So far, I am unsure about Chris Wright’s characterisation of the Monks Wood and Iver locations as airfields.
Chris missed RAF Holbeach as an airfield.
Iver parish is north of Heathrow, but we do not know where the Met Office weather station is that’s being referred to.
Monks Wood is approx 2km north of RAF Alconbury.
***
2.35pm: Bedford, Bedfordshire – 39.5
Met Office search : https://wow.metoffice.gov.uk/sites/search
Note : Bedford is in fact RAF Thurleigh.
Airport runway.
Bedford (5006) https://wow.metoffice.gov.uk/observations/details/?site_id=5006
***
Discounting Iver and Monks Wood, I now count 11 airport / airfield locations.
Do you have the temperature data for Robin Hood Airport for this date – the data was (I think) misreported as being Gringley on the Hill.
Hello Richard.
Using the Met office WOW link posted above :
https://wow.metoffice.gov.uk/sites/search
Click the radio button : Search a location
Then type in : Doncaster Airport
Then select from the list :
Robin Hood Airport (DSA), Heyford House, Doncaster, England DN9 3RH
On the map on the right hand side, zoom out to see the whole of Doncaster Airport then click “Search Visible Area”
You will see 3 map icons and 3 results in the list at the bottom of the screen.
Finningley 33060619 View site page
Ops Office 85476158 Readings are a reflection of conditions outside of the Ops Office and MUST NOT be used to calculate flight movements.View site page
Robin Hood Doncaster Sheffield Airport 955656001Airport and Heliport View site page
From there you can either select a map icon and visit that site’s page or select the “View Site Page” link from the results list.
Clicking View SIte Page for Robin Hood Doncaster Sheffield Airport 955656001 Airport and Heliport
gives the mysterious status of “This site is not reporting observations” so no temperature data can be accessed for that site.
If you want to see the temperature data table for either of the other two results, Finningley and Ops Office, then click “View Site Page” for each, then click the Table tab and select the start & end dates of 19 July 2022.
Unfortunately the site “Ops Office” stopped recording data in 2016 and Finningley stopped in 2015.
So, for the 3 weather observation sites listed and accessible via the Met Office WOW website for Robin Hood Airport in Doncaster, no temperature data is currently available.
What makes you think Robin Hood Airport was misreported as Gringley on the Hill ?
I had a look at the list of temperatures by location in the late afternoon – Gringley on the Hill was most definitely not on the list but Robin Hood Airport was, with a 40C+ temperature. It didn’t strike me as odd until the next day when Gringley on the Hill was suddenly in the list but Robin Hood airport wasn’t. It’s just a bit odd.
One thing that has been missed by everyone is how old the stations have actually been in place.
Many were not there when long heatwaves occurred in the past before World War II.
Heathrow has only been in place since 1950 and missed many heatwaves before. This location would have very likely recorded similar temperatures in the past as it does today if it had been an airport back then.
Even so this event was still historic because the air source was direct from North Africa and that very rarely ever happens, never mind in the middle of Summer.
1948 not 1950.
Botanical Gardens? Lots and lots of glasshouses in a botanical garden is there? Acres of shiny, reflective and, above all, heat trapping glass is there? Car parks and gravel walkways I shouldn’t wonder? Exactly whose leg are you trying to pull with this bullshit?
This is the Cambridge Botanical Weather station where the previous record was measured, don’t see those ‘acres of glass’.
1600px-Cambridge_Botanic_Garden_Weather_Station_from_the_West.jpg
It is easy…easy to be a scaremonger. Scare the folks and then you can lead them around. Tell them the extreme case….what if all ice melted? Ohhhh, that would mean Florida is under water…London too. Aren’t you scared? Look at the map with all the fiery red temps….scary scary scary. Who is to blame for this? Why YOU are – that’s WHO!
I rode my bicycle to work and back today. Quite pleasant if not a little nippy in the morning.
This afternoon it was in the mid 90’s and I took it easy. Garden in looking lovely and giving me more tomatoes than I can use. I think I quite like the good bits about hot weather.
We had a coldwave™ and tomatoes won’t set fruit unless the temperature stays above 55°F during the night. And the onions thought it was fall and “bolted”.
So, hush about your lovely garden.
I think you are wrong.
Your garden is looking lovely, not because of the mid 90’s.
Look at how much airborne fertilizer we now have,
This is more likely why your garden looks so good, and so is mine!
Hello Covid. The gene therapy shot is safe and effective 😉
It is a silly fallacy that climate has any relation to weather. Or that a tiny proportion of the Earth surface experiencing higher than average temperatures while the vast majority of the planet is experiencing average or below average temperatures means that the entire planet is warming.
The fact is that the Earth has a rather static equilibrium of thermal energy in the lower atmosphere and biosphere. That energy content varies little from day to day and year to year and century to century. But what does vary, even radically so, is the thermal energy in one particular location, even on an hour to hour basis. And that is due to the dynamic variation in thermal energy distribution on a localized or regionalized basis resulting from atmospheric currents and high and low pressure systems.
You are correct but the global energy content in the atmosphere does vary from day to day. Why? Several reasons; 1) The total cloud coverage fraction varies as well as the cloud coverage location. A period with more cloud coverage in equatorial regions will reflect more sunlight than a period with the same global cloud coverage but more of the clouds in polar regions. 2) the solar insolation varies 7% through the year from Earth’s non-circular orbit, currently the Earth is closest to the sun in January. 3) 2/3 of the Earth’s land mass is in the Northern Hemisphere. Land has a lower albedo than the ocean, absorbs more solar radiation, and reemits more heat to the atmosphere. Therefore, the NH atmosphere warms more in the NH summer than the SH’s atmosphere warms in the SH summer, offsetting #2 above. Despite being further from the sun, the global average atmospheric temp actually rises slightly in the NH summer.
Why do a bunch of weathermen get to be the ones to define a period of 30 years as climate as opposed to a much longer time? I guess if you can’t predict the weather the next month with any accuracy, 30 years seems like an eternity.
“The 30-year period of reference was set as a standard mainly because only 30 years of data were available for summarization when the recommendation was first made.”
https://library.wmo.int/doc_num.php?explnum_id=4166
Back in the mid-1930s the weather folks wanted a common period that could be used to report comparative weather data. They decided on a timeframe that an average adult could related to. They settled on the concept of “Normals”. [This, I think, was done in Warsaw in 1935.]
It is a <b>defined</b> term, but folks still get hung up on the notion of normal, as in I’m normal but my brother-in-law is a nut.
Don’t go there.
Anyway, it didn’t then, and doesn’t now have anything to do with climate, classical nor non-classical, despite the quote in the post.
Lee’s comment (next) is relevant.
We don’t know what normal is – we merely know the average (if the data haven’t been diddled).
“Climate Normals”
This is a defined term in the same sense that “yard” or “hogshead” are defined terms. Had they defined the term and called it “Climate Klishops”, would you be happier?
I know exactly what a “Climate Normal” is because I’ve read the definition, as I have yard and hogshead.
Here is a Met Office plot of the Heatwave Threshold and how it has changed with the 30 year periods:
uk-heatwave-threshold-2022.png
Phil – Please can you explain what that graphic means? Or link to the Met Office commentary? Thanks
The Met Office has used 3 periods as designated in the definition of “Climate Normals”. This is standard stuff that every person that has completed Meteorology 101 would be familiar with.
Do you have the link please John?
Understanding Climate Normals | National Oceanic and Atmospheric Administration (noaa.gov)
https://www.metoffice.gov.uk/weather/learn-about/weather/types-of-weather/temperature/heatwave
Attributing one weather event and a minor one at that to human GHG emissions is of course absurd.
Most of the long-term warming in the UK since the LIA is during the winter months suggesting at least some influence from increased population (1650, 5m – 2022, 67m), population density and urbanization.
The climate alarmists are running rings around everybody when it comes to their messaging. They have the bulk of the media on their side, they have the population scared witless and the politicians trying to out do each other on who has the craziest climate change policies. Problem for the skeptics is there is no clear simple message pushing back. Alarmists go, look it’s record heatwave, we’re all going to die they get front-page headlines across the world. Where is the counter argument? It has to be simple, and it has to cut through.
I beg to differ since in FORUMS they are getting a serious beating by many who thinks AGW is an overrated idea that simply doesn’t drive the planets weather system at all, and they are often caught LYING and exposed as being ignorant of the whole field of the science.
but which forums? The ones which are echo chambers for the skeptic point of view, perhaps?
In alarmist forums you get banned for daring to question the narrative, so no point in trying to engage in debate, your comments get deleted and you get cancelled. They are the echo chambers. However, you are allowed to participate here, even if you are 6% wetter than the average alarmist. Do you understand the difference?
Of course the grifftard doesn’t get it. It’s like trying to explain calculus to your dog.
It’s much, much easier to explain calculus to dogs. They already know what it is and how to do it, just not familiar with our word for it:
https://abcnews.go.com/Technology/story?id=97628&page=1#:~:text=May%2029%2C%202003%20%2D%2D%20%E2%80%94%20A,a%20couple%20of%20years%20ago.
Ok, like trying to teach climastrology to your cat
Our cat is a brilliant climacatologist – she always comes in to tell us its raining 🙂
Twice as accurate as the National Weather Service!
PBS?
They don’t want to hear a counter argument. This is settled science 😉
but it is, again, a record heatwave.
(a summer break in the UK from record storms and floods).
27 was a hot summer day last century in the UK. 35 was a one off hottest in 76…
Now we get 40… not difficult to see a step change.
It wasn’t a heatwave, griff, it didn’t last for 5 days.
Certainly was it met the Met Office standard comfortably.
What we have is an exceptionally warm day, with some transitory spikes recorded mainly at airports and other UHI affected sites, 5 unlisted, so unverifiable, sites and at least 2 misreported highs, Kew Gardens and Western Park, Sheffield and I wouldn’t be surprised to find more. Oh, and alarmists. We have a surfeit of alarmists.
Griff, how long is your record?
Not a heatwave were I live.
What does the Met. Office say is a heatwave?
“A UK heatwave threshold is met when a location records a period of at least three consecutive days with daily maximum temperatures meeting or exceeding the heatwave temperature threshold. The threshold varies by UK county.”
What does it say is the UK’s hottest summer? Well, contrary to this article it says………
“Summer 2018 was the equal-second warmest summer in a UK series from 1884 for mean daily maximum temperature (shared with 1995) with summer 1976 hottest.”
It was bloody warm where I am on Tuesday, 38c, 33c on Monday, but it was not a heatwave. Temperatures were 23c on Sunday and collapsed on Wednesday to 20c, therefore two consecutive hot days. Since then Thursday was 18c, Friday 15c, Today 18c
The Met reckons it needs to be three consecutive days above 25c for it to be a heatwave where I live, 28c for people in London, so perhaps it was a very short London heatwave.
1976 is clearly the hottest UK summer since the 19th century, 2022 will not be close. How come Griff?
Since 1976 more than three quarters of the total of all the CO2 Mankind has ever issued has been issued. Yet 1976 Is still the hottest summer in the UK.
Seems like UK temperatures are mainly driven by something other than CO2. What do you think?
It was only a few years ago when the Met Office definition of a heatwave was 5 days.
They have a huge agenda and have made the heatwave definition shorter so they can con the public into thinking heatwaves are ocurring more often than before.
1976 was the longest hot summer (drought) but it wasn’t the hottest. “Temperatures on both 18 and 19 July exceeded 38°C, with only two previous dates exceeding this threshold in Met Office data; 10 August 2003 and 25 July 2019. These four dates: 18 and 19 July 2022, 25 July 2019 and 10 August 2003 are the only occasions when 38°C has been recorded in the UK in observations extending back to the mid-19th century.”
“What’s particularly notable is how much more widespread the heat was from this event than the previous two occurrences of temperatures in excess of 38°C in the UK. Temperature records tend to get broken by modest amounts and by just a few stations, but the recent heat broke the national record by 1.6°C and across an extensive area of the country from Kent to North Yorkshire and from Suffolk to Warwickshire.
“Even when you factor in the temperatures seen in summer 1976, they didn’t reach anywhere near the levels seen this week, although that was a much more prolonged spell of hot and dry weather.”
Yes 1976 was the hottest recorded UK summer, the Met. Office confirms it.
A couple of hot days (or swallows!) don’t make a summer. The last few days have been below average, has the ‘climate’ changed again?
griff doesn’t think, he parrots out whatever his handlers tell him to.
Why does the MET Office use a different definition of heatwave (3days) compared to the WMO (5 days)?
So they can call more ‘heatwaves’ in the UK.
Funny that Cold Weather Payments are only triggered by seven consecutive days of freezing weather. Three days for warm, seven days for cold……………………… hmmm!
They can make a nice little graphic explaining to all and sundry that heatwaves in the UK have been increasing becase ‘climate change’ without bothering to explain that it’s solely because they lowered the temperature and duration thresholds.
Actually they’ve raised the temperature threshold this year.
Insofar as interesting weather has been a topic since our fathers sat around a stove in the general store and played checkers, one might think such events are documented and could be retrieved with a few keystrokes.
Or they could just ask Gramps.
In the West, we’re experiencing our hottest July on record. July 2022 is breaking the previous record of 2017 and 2021. This could very well be our hottest summer on record. I contest the idea that these heat waves are because of natural variability. This is a trend and I’m scared. Unless you can provide another explanation I’m not very convinced.
I forgot to mention the drought. I’m really worried about it. I did bring it up but if you lived here, you would see how dire the situation is. The Great Salt Lake is almost completely gone. I can see it right now and all I see is land from where I am. All of us here are terrified now. I’m on my knees praying to God to save us.
You need a witch to sacrifice. That always worked in the past.
“You need a witch to sacrifice”.
Why … have you run out of
vegansvirgins ?Anyway, which witch would you use ???
vegans, witches, same difference.
So many choices. The Hildebeest is the go-to, but then there’s Pocahontas, Occasional Cortex, Sistah Wife and the rest of the Squad, Mad Maxine, Retched Gretchen, Rancid Nancy…
And yet you allow more and more people into Utah and continue alfalfa irrigation! What happened to the plan to bring Pacific Ocean water to the Great Salt Lake?
This has to be satire.
Yeah right John. You’re terrified. Look, you got one thing wrong with your satire or troll attempt. The sort of people who get on their knees praying to God believe that God is in control.
I understand. You are living into this. Forget the “statistics”
I would also be scared as you are.
If you’re that scared then move somewhere that has more water and less heat. If you think this is all a punishment for the sins of emission then I have no sympathy. If you want to understand whats happening, then start educating yourself – read up on past occurrences, physics and the reality of the world around you. If you can’t tell fantasy from reality by now then you need to see a psychiatrist, not be posting on here.
Here endeth the lesson.
The Duke University psychiatrist Dr Allen France’s ranted on CNN [ in the unsavory company of Bandy X Lee ] that Donald Trump [ he later qualified that he meant Trumps climate policies ] would be responsible for more deaths than Hitler Stalin and Mao and brazenly recommended a Soviet style false diagnosis to remove him ……He also risibly contradicted himself insisting critics should attack Trumps ” policies not his person ” only for Frances to resort to unhinged character assassination and delude himself that the insults littering his hateful irrational tirade ‘ made sense ” ……..Do you mean that sort of psychiatrist ?… I was left with the impression the shrink who chaired the DSMIV could not ‘tell fantasy from reality ” …What lessons should we take from Frances Bandy X Lee and the pseudoscientific climate change gibberish of various psychiatric assocations such as the RANZCP and Claire Zilber of the APA ? [ Read the WUWT article ‘Good Grief ” …..Do you have a fetish for mimicry Richard Page ?
“West” of where John?
He means the western USA…
The entire “West”? West of what – west part of what county of what state of what nation?
The whole world cannot heat up in a day’s time. If it’s hotter than average in your backyard I guarantee that at the very same instant it is colder than average next door.
The total thermal energy of the planet cannot jump up, or down – it is constant.
So you are scared. Maybe you should mask up and move to a colder climate?
Guessing he wasn’t in Utah in the mid-1930s.
I have actual data to prove I’m not just an alarmist. You guys have nothing against that.
There’s a clear difference. It’s much hotter now
And this clear much hotter difference is the result of CO2?
” You guys have nothing against that ” …..I just used your own foolish arguments against you
Do you have a line graph temperature chronology John ?
John, how long is your record?
I’ve been in Utah since 2003. It’s definitely hotter. WAY hotter. By 2090-2100, skiing will be completely unviable according to our top climatologist.
https://kutv.com/amp/news/local/low-snowfall-sign-of-climate-change-utah-scientists-say
You guys may find it hard to believe but you probably don’t live somewhere where climate change is obvious. Believe me I used to doubt this too but it’s so hard to just deny now. Any denial of the sort is just me not willing to accept the reality.
John, I certainly don’t deny that climate(s) change. Continually.
Long-term and shorter-term climate cycles that have been documented are listed at this site –
https://worldcyclesinstitute.com/an-introduction-to-climate-cycles/
Here they give details of just 7 known major climate cycles, ranging in periodicity from 1545-year to 100-year cycles.
The most studied cycles are undoubtedly these –
John, refer to the chart posted below by Mr. If this doesn’t put climate in perspective for you, then I suggest seeking psychological counseling.
bullshit
The average maximum high for Salt Lake City is 32c in July.
The forecast for today is 34c and Monday onwards next week is 37c.
The threshold for a heatwave is not even being met today and next week it only just scrapes it. (at least 5c or higher than normal)
The last 2 weeks for Salt Lake City
(High)
Sat 23 – 38c
Fri 22 – 39c
Thu 21 – 38c
Wed 20 – 36c
Tue 19 – 34c
Mon 18 – 37c
Sun 17 – 41c
Sat 16 – 38c
Fri 15 – 31c
Thu 14 – 37c
Wed 13 – 37c
Tue 12 – 37c
Mon 11 – 36c
Sun 10 – 37c
Sat 9 – 39c
” I’ve been in Utah since 2003 . Its defintely hotter ” …..So you weren’t residing in Utah in the sweltering 1930’s John ? . Have you bothered to examine the US station network temperature data ?…You probably do not understand the concept of the temporal chauvinism fallacy [ Look it up John ] ……………..” By 2090 -2100 skiing will be completely unviable according to our top climatologist ” …. It would appear John has no appreciation of the Appeal to Authority fallacy either .[ Look it up John . Learn something ] ……………Strange that the end of snow goalposts have been moved forward another 70 – 80 years to the end of this century [ what is termed an ” unfalsifiable hypothesis ” ..Look it up John ] after climate scientist David Viner’s prophecies announced in 2000 came to nought …….. Years ago Barack Obama’;s science advisor John Holdren [ once a eugenicist like Svante Arrehenius ..Then again eugenics was ‘consensus science ‘ in its day too ] Mike Mann and others were insistent blizzards and excessive snowfall were signs of ” obvious ” climate change . This climate change belief system must work in mysterious ways ” ……You are not just blind to reality you have no insight into your own thought processes and gullibility ……” Its so hard to just deny now ” is it John ? ……. Based on your vibe from 2003 ? The man has converted ! …… Or hes a ‘nudging’ troll
I posted the data of the 1930s vs the 2020s. See above.
Not answering my other rebuttal points out of embarrassment John ?… See above ..The United States heatwave index is unequivocal : it was abnormally hotter across the continental United States during the 30’s than any decades afterward .
Heat waves?!? What heat waves?
We’ve hit nothing near what we had in this neck of the woods in the ’70s(F).
It has been hotter than typical here, but we’re in for a spell of lovely, mid-to-upper ’70s(F) relief from the heat. Bar-b-que Summer coming up next week.
What’s going to happen this coming Winter? The recent Winter lows were very near record lows.
Could it all just be………… weather?
no. UK and mainland Europe are having another round of climate induced heatwaves, setting new records
Well, keep me posted for the next 30 or so years, griff. We’ll see if the weather turns into a change in climate.
A hot week or two or even hot over much of a Summer doesn’t tell anyone much. Now if the pattern persists for 30 or 50 or a hundred years, then we’re talking a shift.
But you know all that.
They’re not, you know.
It’s easy to set new records when you are constantly adjusting the old ones downwards.
“Climate Change Is Not Causing Summer Heatwaves”
Ah yes roll out the strawman. No, but what it did cause were the record highs.
Here is the Cliff’s point that ended up on the cutting room floor:
“…the recent European heat wave was caused by an amplification of the northern hemisphere wave pattern, with global warming contributing perhaps 5-10% of the warmth.”
In other words: caused it. That’s an unsurprising fact. But listen to the wailin’ and the gnashin’ and the ‘splainin’.
Prof Cliff Mass’ next sentence was –
He also wrote –
And –
If I were you Loydo, I’d stop quoting Prof Mass.
His position on AGW is not supportive of your beliefs.
but… but… ‘it’ keeps doing it, by a degree which last century was nearly unthinkable.
UK’s memorable hot summer peaked at at temp just over 35C… this century has seen 9 years in which we had temps more than that… and our 10 hottest years…
clear progression! Max 35 point something to 40C
Your brain has become unthinkable
Must have been caused by the excessive YUGE heatwave, and thus by the English CO2.
Haha
His brain is overheating. Which, also, has nothing to do with climate change. Griffy’s just an excitable widdle bear of little brain.
Well of course it does. You do know about the “Little Ice Age”?
And the thermometer records from 900s seem to have gone missing, so don’t know whether it was hotter then or not.
And yet the sea rises at a slow steady pace and the ice still exists in the Arctic. Nothing to see except humanity is THRIVING.
Leftist Climate (Junk) “Science”:
Climate change is the cause, or a major factor,
in anything bad that happens
Every problem in the world can be fixed,
or at least improved, by spending more money
on windmills and solar panels
Everything any government bureaucrat says about CO2
is 100% correct, only if it is negative.
The only way to save the planet, for the children,
is to have leftists governing the planet.
Greene’s Iron Law of Leftism:
If leftists are in favor of it,
and leftists are in charge of it,
then it will be a failure.
Or ‘there is detailed scientific evidence and hard evidence from weather records of a rapidly changing climate from human CO2 and action to reduce CO2 is needed and can slow the rate of climate change’
Quite warm in China as well. Stopping them building their new shiny coal-fired power stations? No, didn’t think so. ( ditto India and much of the RoW).
My wife’s family live in and around Macclesfield, they got a short period of one day of about 35C before it did what it always does in Macclesfield, it rained, heavily dropped temps by 20C.
Great thing this ‘global’ warming. The UK media were banging on about UK having higher temps than Barbados and Jamaica. Funny that if its was ‘climate’ why were they cooler than Macclesfield? Oh yes THAT is to do with weather.
I am full of admiration for how you type away in High Wycombe ( or wherever it is) and keep sane in the face of continual rebuts from people who really know.
A rouhly estimated + 1 degree C, warming since 1900, which had haphazard measurements in 1900, is not abnormal for our planet.
No one was harmed by the slight warming.
Most of the warming since 1975 was in the higher latitudes of the Northern Hemisphere, mainly during the six coldest months of the year and mainly at night.
Grifter, you are clueless about ACTUAL climate change during our lifetimes. Completely harmless. Greening of our planet. Warmer winter nights in Siberia, Meanwhile, we climate realists listened to 50+ years of scary predictions of rapid dangerous global warming from your fellow science deniers, THAT NEVER HAPPENED. Every prediction of environmental doom since the 1960s was wrong. 100% wrong. That’s YOUR team, Grifter.
Most US states had their record high temperatures set before the past 20 years — more in the 1930s than in any other decade. Those would be facts, Grifter, not always wrong computer game predictions of climate doom
You can’t rely on a record when you’re constantly adjusting the past to support your present narrative.
Tony Heller has an article that discusses the adiabatic winds that drove the record high temps in the
Pacific NW & BC in June 2021. A similar event in Santa Barbara in 1859 where newspapers
reported 133°F, the second hottest temperature ever recorded. With both of them, the event was
fairly short-lived. The Carrington Event occurred later in 1859
https://realclimatescience.com/2021/06/133-degrees-in-santa-barbara-california/
‘Tony Heller’ (rolls on floor laughing, holds sides, nearly expires from choking on morning coffee)
I can see why you almost choked on your morning coffee. You may want to be
more careful next time!
Interesting. That’s exactly our reaction to your comments !
Translation: I can’t address his post because I am a prejudiced bigot!
Yes thats such an intelligent reponse to a qualified geologist and computer scientist ….. In fact Tony’s credentials are listed on his website ….
It’s tough to take seriously someone who believes that CO2 freezes in the Antarctic!
What is the freezing temperature of carbon dioxide then ” Phil’ ?
In the Earth’s atmosphere below -140ºC.
Those were newspaper articles he cited! DOH!
UPDATE by Anthony:
While the -115F air temperature is below the freezing point of CO2 at -109F, CO2 WILL NOT FREEZE OUT OF THE AIR. The partial pressure of CO2 in our atmosphere is too low. We did an experiment back in 2009 that proved this.
See: https://wattsupwiththat.com/2009/06/13/results-lab-experiment-regarding-co2-snow-in-antarctica-at-113f-80-5c-not-possible/
Tony Heller, aka “Steve Goddard” still won’t admit to making a mistake on that issue, which is why he no longer posts here.
How do we know this?
“The model showed that the drop in temperature was related to ozone in the stratosphere, the layer of the atmosphere that is between 10 and 50 kilometers from the Earth’s surface. Ozone is created when high-energy ultraviolet light from the Sun interacts with oxygen. During the Maunder Minimum, the Sun emitted less strong ultraviolet light, and so less ozone formed. The decrease in ozone affected planetary waves, the giant wiggles in the jet stream that we are used to seeing on television weather reports.”
“The change to the planetary waves kicked the North Atlantic Oscillation (NAO)—the balance between a permanent low-pressure system near Greenland and a permanent high-pressure system to its south—into a negative phase. When the NAO is negative, both pressure systems are relatively weak. Under these conditions, winter storms crossing the Atlantic generally head eastward toward Europe, which experiences a more severe winter. (When the NAO is positive, winter storms track farther north, making winters in Europe milder.) The model results, shown above, illustrate that the NAO was more negative on average during the Maunder Minimum, and Europe remained unusually cold. These results matched the paleoclimate record.”
https://earthobservatory.nasa.gov/images/7122/chilly-temperatures-during-the-maunder-minimum
“When the NAO is negative, both pressure systems are relatively weak.”
An old proverb in the UK says ” One Swallow does not make a summer”
And the Media seem to have forgotten this, with the recent coverage. To put things in perspective, Mean CET temperatures for this year June were 14.9 C and July is currently at 18.2 C The hottest summer in the UK was 1976 and the second hottest was 1846
Of the 32 hottest summers ever recorded since about 1650. with an average CET
temperature of 16,5 C and over, Two were during the 1600s – Eleven during the 1700s – Six during the 1800s – Ten during the 1900s and Three since 2000
It seems that on average, July this year will remain normal in 2022.
http://en.sat24.com/en/eu/infraPolair
43 places beating the heat record of just 3 years ago, UK hitting 40C is a flock of swallows...
2000 swallows ahead of Capistrano Griff? (h/t Theme Time Radio Hour with your host Bob Dylan, Bob’s dad jokes are wonderful)
Flight or gulp of swallows, there is no such thing as a flock. You really are an uneducated ass, Griffy.
The circulation forecast for the lower stratosphere indicates a latitudinal circulation in the North Atlantic until the end of July, and even longer.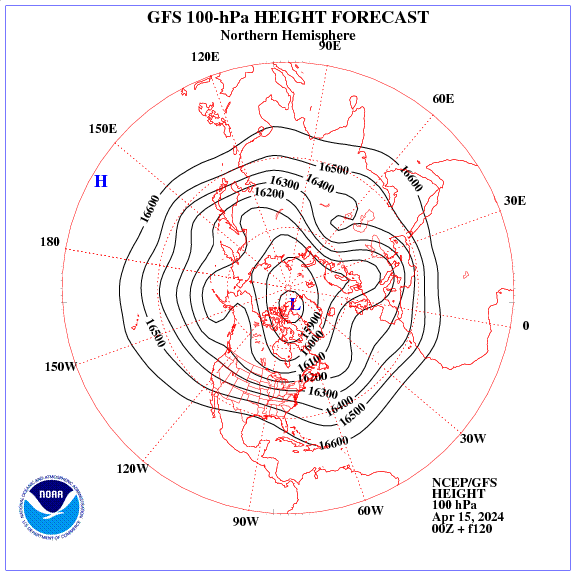
Also visible are the highs in the west of North America.
The Guardian has proudly declared back in 2020 it is the coordinator of all media stories worldwide relating to weather and climate.
They and their sister broadcasting organisation boast about their role and even define the words to be used when conveying coverage of weather and so called climate impact events.
The mass media have been consolidated purposely to ensure a single message is put out.
The science is settled and it is what the coordinating agents decide it is as far as media coverage is concerned.
The Guardian joins forces with hundreds of newsrooms to …https://www.theguardian.com › environment › apr › the…
19 Apr 2020 — The Guardian is the lead partner in Covering Climate Now, an initiative founded last year by Columbia Journalism Review
And?
And, it shows how single sided and uniform the ‘official’ coverage of weather related incidents across the entire globe now is.
The Guardian and it’s broadcasting partner the BBC are ensuring their ‘settled science’ position, is the only message being distributed or heard in the MSM.
I don’t consider that acceptable. Do you?
No, it shows how single sided and uniform the science is. Climate scientists have been predicting exactly this sort of ratcheting up of heat records for decades.
Yep our children will not know what snow is 😉
Loydo, how long is your record?
You should read Bernays explanation of what propaganda is –
You think record temperatures are propaganda? Have you actually read that book?
Yes I have.
And I can save you reading it by sharing the essential points –
So now tell us how the “Covering Climate Now” media cabal aren’t using all the above tricks.
CNN is on board with scary climate stories.
The figure 1 illustration is not showing up here, but does on the original article at:
https://climaterealism.com/2022/07/wrong-legacy-media-climate-change-is-not-causing-summer-heatwaves-in-the-u-s-and-europe/
Strange then how the US and europe are seeing increasingly frequent and severe heatwaves…
Repeatedly new temperature records have been set this century and in the last 5 years across Europe…
UK broke its previous record of 3 years ago in 43 places last week, by up to 1.5 degrees… Europe set a new record last year, as did Greece… many places in Spain etc etc etc getting new records (notably Arctic Norway).
climate skeptics have no explanation for all this except ‘its just weather’… which from the UK point of view and direct experience is nonsense
Ever tried to engage your brain? (It must be in there somewhere)
Griff
Records are made to be broken. Every time we get a new record in western canada the one it broke was usually in the 1890s or 1930s
So then I ask why was it so hot back then and why did it take 90-130 years to break those records?
Even though we have extreme unprecedented global warming caused by humans we are only now barely breaking records?
But there is no upward trend in droughts or heatwaves, so yes this is just weather
When this year ends up being cooler than last year when last year was only the “7th hottest ever”, even with the Adjustment Bureau working 24/7, what will be your response then?
Look at the UAH graph and tell me you’re suprised more heat records are falling.
I have expained it Griff but you choose to ignore it.
The heat source was from North Africa, one of the hottest and driest places in the world.
That is why records have been broken because this didn’t not happen in 2003 or 1976.
Regarding heatwaves you are wrong in three instances.
1) Heatwaves need to be at least 5 days and that didn’t happen in the UK.
2) Heatwaves for some reason are not lasting as long, they are actually becoming shorter in length.
3) Very short hot weather days are being incorrectly named heatwaves.
Yourself is making up nonsense when any hot day is proclaimed to be an heatwave.
Given before, but it looks like I’ll have to provide it again.
URL to the NCDC’s “Daily Weather Records” website :
https://www.ncdc.noaa.gov/cdo-web/datatools/records
A screenshot of the last table on the “Global Records Summaries” tab is copied below for those too lazy to click on the above link.
Note that “Global All Time Records” for the category “Hottest EVAH !” (the “HIGH MAX” column) occur at an annual rate averaging (just over) three per week.
The Urban Heat Island (UHI) effect, alone, shifts the probability distribution of measured temperatures to the right. (Note: to the right)
The right-tail of the distribution extends farther to the “high” side. These higher measurements become “expected values” but with low probability. Still, they are now there. Because these are now “expected” there should be no surprise, excitement, or angst. Statistics 101, whether you were there or not.
Just me talking….
Consider that I was born, raised and spent the last 30 years working (as a Beef Farmer) in North West England (half mile north of the line of Hadrian’s Wall)
Cumbria is famous for its ‘Cool Climate’ It is west facing and hilly (the natives call them ‘Fells’ or ‘Hows’
The prevailing wind is off the North Atlantic and obviously as it is forced to rise up the and over the Fells, its cools, makes clouds and rains.
(20 miles to the east of where I was (Northumberland) is the east facing downslope and the Foehn Effect rules – it is A Whole Different World. Really it is.)
It dawned on me (18 years ago to this very day) while I was in a hospital bed having suffered a (TIA) stroke, that Cumbrian Weather was ‘going to be the end of me‘
The stress it induced compounded by Governmental Pettiness, Insanity and Bureaucracy (now directed with even more venom and ferocity) were at the root of why I simply ‘fell over’ one day and didn’t / couldn’t understand why
(Strokes don’t hurt, there is no pain. No gain either, quite the contrary)
Thus I found myself in sunny Nottinghamshire, with one half the annual rain-fall and an annual average temp 2°C warmer than Cumbria = barely 140 miles away.
On July 18, as per usual for the weather obsessed (now ex) peasant that I am, I watched the heatwave unfold from various sources, not least via dataloggers in my own (now 2 in number) gardens.
I pottered outside, progressed my home-moving, watered the flowers, went exploring my new neighbourhood throughout that Hideous Heat© and frankly, I lapped it up.
It was Completely No Problemo for me.
Yet here I am, hypertensive (according to my doc) age 60+ with a blood clotting disorder, Atrial Fibration and A History of Stroke
(At least now I know how I will die and as I said and unlike e.g. Cancer, Strokes Don’t Hurt)
I am The Very Person all these (what’s the word) Health Warnings are aimed at – I should have perished in that Heat Storm but didn’t
Without air conditioning also.
<engage Rhetorical Mode>
So why is that. Why did a walking talking heart health calamity simply lap up 40°+C heat – in fact, Tru Fax, I felt cold the very next day.
Everything in this world is now junk and wrong
PS Get a load of this, the BBC is getting (even more) desperate.
https://www.bbc.co.uk/news/science-environment-62225696
Patently though ‘one’ does have to be careful in this ‘wrong world’
Mr Trump would have called that story out for what it is, desperation still trying to force a false narrative that is 30+ years ‘in the wrong’
See what happened there. scary depressing sad
take care peeps
At Sheerness on Isle of Sheppey (North Coast of Kent) on 19th July the temperature recorded by the well equipped IOS weathercam site went from 38.0C at 1412 to 30.1C at 1516 because the wind (Force 4) shifted from SE (off the land) to E (off Thames Estuary). Interesting but nothing to do with ‘Climate’.
https://www.iossc.org.uk/weather/?sn=tri-view
Quite agree. I was at a cricket match in Durham (Eng Vs SA) on Tuesday it was 38C. Yesterday it was 18C and raining on and off. That’s a 20C swing in three days.
Getting spikier, which suggests measurement changes, ie picks up one second temps.
Overall CET trend reflects some changes of locations and UHI effects ( plus general increase in population and movement to 24/7 lifestyle). England is a crowded country, it would be inconceivable that ground temps would not increase over the last 150 years. Its a ‘man made’ trend, but nothing to do with a trace gas.
So, we had a couple of nice days surrounding one uncomfortably hot (for us in England) day. In Newspeak, this is a heatwave. It also requires new instruments, and new UHI effect, airports, etc. to make this into a record temperature. It is just one unusually hot summer’s day, but not a patch on ’76 (from memory rather than instruments) which seemed to move the climatologists on from talking about the looming ice age glaciation.
We have two distinct types of heatwaves in western Europe, a more sustained heatwave under positive North Atlantic Oscillation conditions, or very brief Saharan plumes under negative NAO conditions, as in 2022, 2019, and 1808. The latter of which by default cannot be attributed to rising CO2 forcing which is expected to increase positive NAO (NAM) conditions.
https://archive.ipcc.ch/publications_and_data/ar4/wg1/en/ch10s10-3-5-6.html
Europe’s hottest heatwaves, 1361, 1540-41, 1757, plus the US 1936 heatwave, and the hottest month in CET in July 2006, were discretely solar driven, and all occurred on exactly the same type of heliocentric T-square of Saturn in superior conjunction with Neptune, roughly in quadrature with Jupiter.
https://www.fourmilab.ch/cgi-bin/Solar
(change the date as required, change size to say 800, and click update)
The heatwaves of 1934, 1948-49, 1976, 2003, and 2018, all occurred at Jupiter in superior conjunction with Uranus, roughly in quadrature with Saturn:
https://docs.google.com/document/d/e/2PACX-1vQemMt_PNwwBKNOS7GSP7gbWDmcDBJ80UJzkqDIQ75_Sctjn89VoM5MIYHQWHkpn88cMQXkKjXznM-u/pub
I have my own 52 year temperature recordings, I live within the CET area and my records closely follow the CET. My own 52 year record was 34.5c and was broken by 2c coming out at 36.5c it lasted all of ten minutes around 2.40pm and dropped away soon after.
Records can be broken both hot and cold almost anywhere given the right conditions, whether or not there is a human element.
CET temperatures have been stable for for 25 years, Globally we are in a near eight year hiatus. Given this current global stability, when it is exceptionally hot in one part it has to be exceptionally cold in another, (as was the case in this UK hot spell, it was very cold east of the ridge), balancing out the hotter conditions under the ridge, otherwise global temperatures would have to increase. It seems that incoming radiation equals outgoing radiation at the moment as the CERES data suggests.
Not to mention the current increase in the Arctic Sea Ice or a cooling Antarctica. If only climate science was settled it would make life a lot easier.
My question is: why doesn’t the increase in CO2 affect winter temperatures in the southern hemisphere?

1) The Arctic relies on heat energy from ocean circulation to warm it via the NAD, AMOC and Gulf Stream towards the Arctic ocean.
2) CO2 is not warming the ocean to any noticable amount whereas the decline in global cloud albedo (~5%) is responsible for increasing SWR.
3) During Winter no solar radiation keeps the poles very cold but the Arctic has 1) to warm it, whereas there is no ocean warming source for Antarctica.
4) Antarctica virtually relies only on CO2 for warming in Winter and therefore this is obviously having no or very little affect.
5) With the southern hemisphere having significantly more ocean it takes longer to warm especially with low solar radiation levels during Winter.
https://www.science.org/content/article/rising-atmospheric-carbon-dioxide-actually-cools-part-antarctica
This is an interesting article and since when does CO2 works both ways?
It simple can’t it either cools or warms unless it reaches a certain threshold or limit. With it increasing vaporation then it causes cooling.
If this article was correct then this is the evidence required the CO2 causes cooling not warming.
The reason why this would be observed here is for my reasoning number 3 & 4.
This is not true, as the sea current drains warm waters into Antarctica, as shown in the graphic.
The Antarctic Circumpolar Current (ACC) circles around Antartica.
“The current is circumpolar due to the lack of any landmass connecting with Antarctica and this keeps warm ocean waters away from Antarctica, enabling that continent to maintain its huge ice sheet.”
The ACC drains warm currents into it moving it away from Antarctica itself and becomes a huge barrier between the continent and circumpolar current.
No warm ocean currents go within the circular ocean current shown on the map link below.
The reason why ocean surface temperatures are so cold around Antartica a long way from land.
Currently, the temperature at a depth of 150 meters off the Antarctic Pacific coast is higher than the temperature in the Arctic Pacific.
The higher temperatures are near 50S on line with the tip of South America, still a long way from the Antarctic coastline.
The ACC deep current keeps the warmer temperatures away as shown below.
https://upload.wikimedia.org/wikipedia/commons/a/ab/Thermohaline_circulation.svg
“It is amazing how often theorists discount anything to do with the oceans and their movement and the result of their force and those forces acting upon it. Yet, the process is one of high degree, which results are inescapable.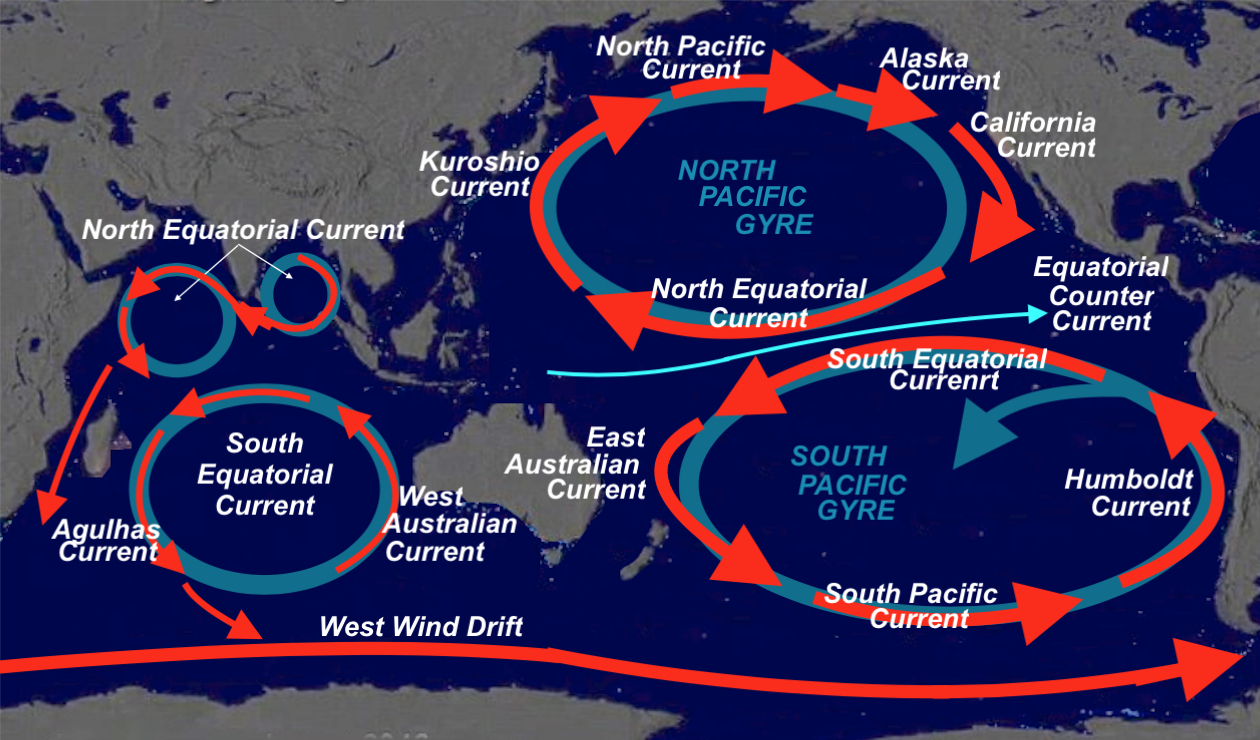
As an example, as the earth rotates from west to east, water near the equator tends to move from east to west, due to the prevailing winds. This leads to the formation of Equatorial currents, both North and South of the equator. Obviously, to the north is the North Pacific Gyre, which rotates clockwise, while to the south, is the South Pacific Gyre, which water rotates counter-clockwise.”
http://nephicode.blogspot.com/2019/07/lehi-and-counter-current-pasrt-i.html
I agree, the ocean has a huge influence on the planet.
Shows ocean temperatures leading atmospheric temperatures.
https://www.woodfortrees.org/plot/wti/plot/hadsst3gl/from:1980
Shows how the warming since 1980 come about with the AMO moving to its positive phase.
https://www.woodfortrees.org/plot/wti/plot/hadsst3gl/from:1980/plot/esrl-amo
After all, the Earth is a planet of water, and the surface of the ocean does not exceed 31 degrees C, and at this temperature high convection turns on. This limitation is due to the Earth’s average atmospheric pressure.
The ACC deep current has a huge influence on the Antarctic preventing warm ocean currents from reaching it via the Aqulhas current or the South Pacific current.
During La Niña, surface currents merge with circulation in the atmosphere.
The planet does seem to have a self regulation energy mechanism with negative feedback. Surface temperatures warm so far increasing evaporation and then form clouds with a limit has been reached preventing them from heating the surface any more. The limit looks like around 30c and will never likely be any higher in future.
Also correct about La Nina where trade winds causing more upwelling bring up water from lower depths to the surface and interact with the atmosphere.
The current sea ice extent in the Antarctic is at the record low for the day in the satellite record.
This is evidence that an ocean current is pulling warm water from the western Pacific to Antarctica.
“It is amazing how often theorists discount anything to do with the oceans and their movement and the result of their force and those forces acting upon it. Yet, the process is one of high degree, which results are inescapable.
As an example, as the earth rotates from west to east, water near the equator tends to move from east to west, due to the prevailing winds. This leads to the formation of Equatorial currents, both North and South of the equator. Obviously, to the north is the North Pacific Gyre, which rotates clockwise, while to the south, is the South Pacific Gyre, which water rotates counter-clockwise.”
The average air temperature anomaly in the Southern Hemisphere this winter at 2 meters ranges from -0.3 to 0.1 degrees C ( relative to the 1979-2000 base). No warming of any kind. Antarctic temperature anomalies are negative.
It is really surprising with all this “global heating” “weird weather” going on that the Arctic sea ice is not continuing its “death spiral”.
Here is sea-ice volume from cryosat2:

lower line is October of each year, the nearest this dataset has to September minima.
The questions Nick and the other alarmed have to answer are simple.
(1) The phenomenon itself.
Do you believe the blocking ridge plus southwestern low were caused by the amount of warming of the global climate we have seen in the last 50 years?
If so, what is the mechanism that you think has caused this specific configuration of weather patterns? How exactly has a small rise in global temps caused it? How do you account for the existence of this pattern in previous periods?
(2) The scale of the phenomenon.
Do you believe that the cause of the high temps we are seeing recorded in the UK thanks to this phenomenon is the amount of warming of the global climate?
If so, by how much, in degrees C, do you think the global climate warming has raised them?
Here the difficulty you face is to show that we are not dealing with a standard weather phenomenon, just happening in an unusual way and producing a small peak in temperatures across a wide area of the UK.
It seems to me that, when discussing the UK weather, people have a quite false concept of it being very stable. it simply is not. The UK is on the edge of a vast ocean, under the jet stream, and to the north it has the Arctic and to the south the Sahara. The result is that weather systems blow in from the west all the time, in varying configurations. Sometimes they bring long spells of very cold temperatures. Sometimes they bring very long wet periods. Sometimes they bring heat up from the Sahara. And dust for that matter.
Nick and the others by implication are arguing that if we see many readings of 41 compared to previous less widespread readings of 39, then this cannot be simply caused by fluctuations in the above mechanism.
Fine, give some evidence to support your view. I don’t believe you can. I think summers with just such heat spells have occurred many times in the last 1,000 years., in periods where we don’t have observational records, but we do have anecdotal accounts. And slightly less hot ones have occurred several times a century, again in periods where we have written accounts. The default position has to be that this is unusual local weather, and nothing to do with global warming or global climate changes.
It is 100% unusual local weather and there is so much variety in it that 1000 years still may not include every possible scenario.
One good question for Nick and others below:-
When was the last time the air source come directly from North Africa in Summer and moved all the way to the UK northwards htting most of England and Wales?
1976.
There are quite frequent episodes of Saharan dust and sand being brought up to quite a lot of the UK by the lows coming in from the west. They aren’t always accompanied by very hot weather. This one has not brought sand, or not that I have heard. But sometimes you do get quite noticeable sand and dust.
Think about it. Lows come in from the west. There are also highs coming in from the north. There is the jet stream. Sometimes the highs are blocking and sometimes they form ridges. There is arctic cold and Saharan heat being brought in by these events.
Its just not a stable climate, and its idiotic to get excited about every little variation in it. They are inevitable. People have an entirely false idea that calm regular weather would be normal. It would not be, its simply impossible for a territory situated where this one is.
Saharan dust is relatively common in the UK often happening a few times a year when big dust storms in the Sahara coincide with southerly wind patterns.
Southerly wind patterns very rarely bring air up northwards direct from North Africa like it did on this occasion. These events are very rare indeed and I actually don’t know when this last happened. I have checked historic records back to 1906 and this didn’t occur with any of them during Summer.
Another geomagnetic storm and an increase in activity in the Atlantic.
Another low from the northwest is approaching the UK.
https://pl.sat24.com/pl/eu/infraPolair
The “hot” summer in the UK is over.
Temporarily. Warmer than average temps will come back according to the models. Those in the US from Texas up through the midwest will also get a break. While those in the NW US that have been having lower than normal temps will get a blast of warmer than normal temps. But that too will flip after 8-10 days.
Early teleconnections are indicating the continental US is in for a harsher winter than we have had in some time. Possibly one like the winter of 2013-14.
For my area – central Washington State — there is a very colorful map here: Pendleton, OR (weather.gov)
Click to enlarge.
This will not be as hot as June 2021. Still, it is uncomfortable.
I’ll have to check on the “harsher winter” to come. I may need more wood for the stove.
The decline in Arctic sea ice extent has stopped.
https://www.forecast.co.uk/pressure/
Take a look at the weather systems around the UK.
You can even animate it to see the highs and the low moving. This is how weather is on the edge of the Atlantic under the jet stream. Get used to it.
As solar activity increases, a zonal circulation will be activated and lows from the west will move more rapidly eastward.
https://i.ibb.co/QrMG27s/hgt300.webp
https://www.netweather.tv/charts-and-data/jetstream
But who has the loudest bullhorn?
Not passing peer review because the content is not up to standard, is not censoring. It is about maintaining high quality.
No it isn’t, or a good 90% of the published articles would never pass. It is completely about censorship and silencing dissenting views.
Peer review is a process that weeds out the…. well, weeds.
Here’s the thing… anyone can say AGW is crap(you see it countless times here a week), but then the sciency people with lots of letters behind their name say “that’s all very well, but you have to now say?” And that’s where AGW deniers fall over. They haven’t quite worked that bit out yet.
Anthony/Moderator – figure 1 needs checking/replacing:
Figure 1: Comparison of TV weather Maps from the BBC in summer 2012, left, and summer 2022 right. Source: BBC
There is duplicate text instead of the figure referenced?
(Thank you for the tip, have passed on this to the Admins) SUNMOD
La Niña is back.
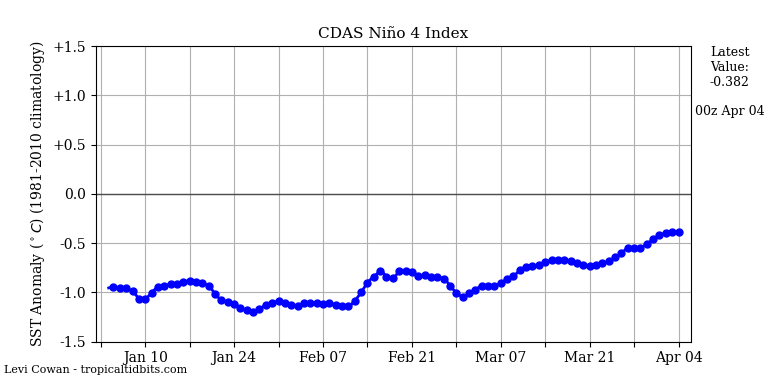
Weather IS climate when it helps the global warming cause, and it IS NOT climate when it doesn’t.
Hot Summer NOT caused by climate change/the science
https://www.marketforum.com/forum/topic/87422/
The Irish Met office declared a record breaker by 0.3 Deg C in the phoenix Park in Dublin, I call it utter Bollocks, it’s easy to falsify a 0.3 Deg record than 1 deg C.
The Irish Government are in bed with the WEF and UN and we’ve been bought and paid for and Our Government will do as they’re told.
Funny that next week starting 25th July the Irish Government have to declare a 30% reduction in Co2 emissions and low and behold Farming is one area being targeted, no way, just like the Netherlands ?
Yeah I drive an electric car but I do so because of the cost of Diesel here is a joke and EV is saving me a fortune, seriously, and after 8 months and 32,000 Kms there is no battery capacity loss nor was there in my BMW i3 2017 which was almost 5 years old when I sold it with over 90,000 Miles, the range was as good as new + I love how electrics drive and being able to pre heat and precool the interior prior to departure, so anyway I don’t drive EV because I’m trying to save the earth I drive EV because I love how they drive and how they save my wallet + I get a lot of free electricity in work, my fuel bills are around 10 Euro’s a week compared to around 120 a week with diesel.
Hopefully Google maps comes up with the location.
Coningsby
https://www.google.co.uk/maps/place/53%C2%B005'37.5%22N+0%C2%B010'04.1%22W/@53.09375,-0.1699934,391m/data=!3m2!1e3!4b1!4m14!1m7!3m6!1s0x4878725b3a3d293d:0xd0e85c36046c428a!2sConingsby,+UK!3b1!8m2!3d53.105091!4d-0.175141!3m5!1s0x0:0xf8d2dc1dc6a95b47!7e2!8m2!3d53.0937386!4d-0.1677906?hl=en-GB
Regarding the European heatwave and drought in 1540, as I recall the Rhine and the Seine ran dry. In Paris, people were walking down the bed of the Seine. Astonishing.