by Michael F. Cochrane, Ph.D.
“Much climate reporting today highlights short-term changes when they fit the narrative of a broken climate but then ignores or plays down changes when they don’t, often dismissing them as ‘just weather’,” wrote theoretical physicist Steven Koonin, former Under Secretary for Science at the Department of Energy in the Obama administration, in a Wall Street Journal op-ed earlier this year. Such reporting frequently occurs regarding polar ice melt and its impact on sea-level rise.
Reporting on melting polar ice often falls into this category. It is frequently cited as prima facie evidence for global warming. In its 2021 “Arctic Report Card,” the National Oceanic and Atmospheric Administration (NOAA) concluded, “Rapid and pronounced warming continues to drive the evolution of the Arctic environment.”
The authors of the NOAA report card documented the change in mass of the Greenland Ice Sheet (GIS) from 1 September 2020 to 31 August 2021, reporting a total mass loss of 85 gigatons (Gt) plus or minus 16 Gt (a gigaton is about the weight of 1 cubic kilometer of water). Though the authors note that the 85 Gt annual mass loss of the GIS was less than the 264 Gt/year average loss over the period from 2002 to 2021, they still concluded, “the ice sheet has now lost mass almost every year since 1998, with tied years of record ice loss in 2012 and 2019). … Ice loss is exposing land, adding substantial freshwater into the ocean, and raising sea levels globally.”
“While a warming globe might eventually be the dominant cause of Greenland’s shrinking ice,” Koonin acknowledges, nonetheless “natural cycles in temperatures and currents in the North Atlantic that extend for decades have been a much more important influence since 1900. Those cycles, together with the recent slowdown, make it plausible that the next few decades will see a further, perhaps dramatic slowing of ice loss.”
Possible evidence for such a dramatic slowing of ice loss in the GIS came recently with a report from the climate website electroverse.net, where Cap Allon announced a record-breaking 7 Gt gain in surface ice mass in a single day, June 18, 2022. Using data from Denmark’s Polar Portal, an Arctic climate and ice monitoring resource, Allon documented that “Impressive surface mass balance (SMB) readings… have been posted across the Greenland ice sheet all season,” but the 18 June record gain of 7 Gt is highly unusual, “particularly when you consider the glacier should be losing mass at this time of year.”. (Polar Portal explains, “The term surface mass balance is used to describe the isolated gain and melting of the surface of the ice sheet—i.e., not including the losses that occur when glaciers calve icebergs and melt when meeting relatively warm seawater.”
As can be seen in this graph from the Danish Meteorological Institute (DMI), this season’s gains in ice mass have pushed the Greenland Ice Sheet’s SMB above the 1981–2010 average for this time of year:

The report concludes that this year’s gain is not an anomaly. The SMB for the years between 2016 and 2018 shows annual SMB ranges consistently greater than the mean:


The National Snow & Ice Data Center (NSIDC) had similar findings, reporting last year that the surface melting and total melt-day area for the GIS at the end of the 2021 spring season was below the 1981 to 2010 average. “Snowfall and rain (minus runoff) added mass to the ice sheet. As of June 20 [2021], total mass gain for the ice sheet since September 2020 was slightly above average.”
The importance of monitoring and documenting changes in SMB of the polar ice sheets is not simply to provide evidence of a warming planet, but to attempt to predict the degree to which these changes contribute to rising sea levels. Koonin, in his 2021 book, Unsettled: What Climate Science Tells Us, What It Doesn’t, and Why It Matters, acknowledges that global warming would, indeed, put more water into the oceans, resulting in rising sea levels, but cautions that any prediction of future sea-level rise “largely depends upon how much of the ice on the land melts as temperatures increase, together with the expansion of the warming oceans.”
Citing recent work on glacial ice mass changes, Koonin, points out in Unsettled that “the contribution from glacier melting has slightly declined since 1900 and is the same now as it was fifty years ago; the contribution from Greenland went through a minimum around 1985 and is now no higher than it was in 1935.”
His point is that the predictability of future global sea-level rise is highly uncertain because of two key factors: the uncertain dynamics of the Greenland and Antarctic ice sheets, as well as the uncertainties inherent in the temperature predictions of global climate models.
It should come as no surprise that a scientist would underscore the importance of uncertainty in drawing conclusions from observational data. After all, the scientific method—based on observation, hypothesis, and experimentation (where possible)—demands that any conclusions drawn from this process are, by definition, uncertain. Yet governmental organizations such as NOAA and the Intergovernmental Panel on Climate Change (IPCC) continue to couch their findings and conclusions in terms that practically beg media outlets to report on them as if they were absolutely certain.
Acknowledging the uncertainty surrounding climate science should lead to a strong sense of humility. Scientists are not advocates. They must provide policy makers with the best evidence, but do so humbly, acknowledging that their conclusions will likely have a major impact, not only on the world economy, but also on the flourishing of billions of vulnerable human beings.Michael Cochrane, Ph.D., Engineering Management and Systems Engineering, a defense and technology reporter for World News Group, is founder of Value Function Analytics and a Contributing Writer for The Cornwall Alliance for the Stewardship of Creation.
But what if you look at Koonin’s uncertainty and it doesn’t feel right?
Ahh, there is an ‘adjustment’ we can apply to that….
The Danish aerials photos of coastal Greenland from 1938 show significant melting in that era. This is well known. More nonsense
Yes, it is well within normal variability that can be completely explained with natural and recurring phenomena.
Yes. With climate change occurring for thousands of years the variations within are both unpredictable and of unknown frequency or magnitude
Is it not possible that warmer ocean air temps would melt at the coats but also carry more moisture inland to fall as snow? This climate “pretend science” is full of cherry picked facts taken in isolation. In fact, the entire pseudo science is based on exactly that. A singular fact about the absorption band of CO2 is taken as a proof, without any regard for a thousand other factors that go into the gain and loss of heat on planet Earth. Now the planet is cooling again. Making a mockery of billions of dollars spent by fools and liars on “research”.
“The term surface mass balance is used to describe the isolated gain and melting of the surface of the ice sheet—i.e., not including the losses that occur when glaciers calve icebergs and melt when meeting relatively warm seawater.”
___________________________________________________________
As if surface mass balance gain and melting hasn’t been going on forever. Not to mention some of the claims of enhanced basal lubrication and the contribution of the Greenland ice sheet to sea-level rise. Since central Greenland is below sea level the lubricated ice sheet would need to flow uphill.
Alternatively, the ice can shear at about the elevation of the bedrock rim. Once passed the rim, the basal ice can be lubricated by water.
I naturally have a different perspective than many on ice having worked for several years in the St. Elias Mtns and Juneau Icefields–the Canadian side, on GSC projects. There is just a small percentage left of Wisconsin/Fraser glaciation ice; it is still melting. I often ask the question to people that if it is agreed that we are still recovering from the last glaciation, what should be the ‘warmest year ever’? The answer for all my geological career has been ‘this year’. If Greenland ice starts growing again–be very worried; we might not like the implications.
There is no ‘climate crisis’; there is ‘climate’. The planet doesn’t care where man built his cities or where he presently grows his crops; it isn’t here for our convenience, it’s just here. We adapt or perish.
Everyone who accepts the existence of a crisis is encouraged to hunt up the Smithsonian-published graph of the last 550 million years of earth’s climate history, and try to convince yourself there is any evidence on that graph that climate should be constant. If still convinced that it should be, then find the precedent that it should be stable at its present level.
Just had to. One year ice loss is given as 85 Gton, approximately equal to 85 cubic km.
Ice area is 1.71E6 sq km. The loss represents 85/1.71E6 or….5 cm; 2″.
This is on an ice sheet between 2,000 to 3,000m thick, or 6600 to 9,800′.
IF THIS CRISIS CONTINUES the ice sheet will be completely gone in somewhere between 39,600 and 58,800 years!
(Last I checked, the science is not yet settled whether the Antarctic ice mass will grow or shrink under these same conditions.)
I had previously done some ‘back of envelope’ extrapolations based on estimates of GIS retreat. I came up with a number of about 15,000 years. However, either my numbers or yours are so far into the future that they are essentially meaningless for planning purposes. Who knows what the climate will be in 10’s of thousands of years. Will it really be an issue moving cities back from the coast after the high-rises exceed their design life? Who know what the world population will be after WWIII. There are more important things to worry about.
Yes Clyde, there are many ways to do such a calculation, with more or less estimate and accuracy. My exercise was meant to demonstrate that this hand-wringing and angst about GIS melting has to be taken in context. I intended to show that, with a simple middle-high-school math calculation, at the discussed rate of that one year, it would take some 40,000 years or more to melt all the ice.
I left it for the reader to realise that that is twice the time it took for the entire Wisconsin glaciation to begin, build to maximum, stabilize for 10,000 years, and then melt away to the condition where it attracts all this attention today.
It then is difficult to understand the constant Thomas Aquinas style discussion of GIS melting. I also noted from the ‘Methods’ section of original article that there is actually no-one on the ice doing any of this, it is all from interpretations of data from various satellites measuring indirect parameters from hundreds of miles above. Everything is derived from people thousands of miles away from Greenland sitting in climate-controlled offices staring at computer screens.
I wonder if we could rename IPCC to IPPD–Intergovernmental Panel on Pixie Dust. IPPP would work too.
Well it’s been more than just one year:
https://forum.arctic-sea-ice.net/index.php?action=dlattach;topic=3643.0;attach=338694;image
Yes Phil it has–for probably about 15,000 years. What does your logic predict should be happening? What is the logical prediction for ‘this year’?
That exact same graph trend is what melted over a kilometre thickness of ice over most of Canada and northern US starting about 15,000 years ago when much of North America looked just like Greenland looks today. I have found nobody that thinks that was a crisis; why should the logical progression of that trend be considered one today?
https://www.climatedepot.com/2021/01/30/noaa-temperature-chart-shows-earths-history-much-hotter-than-today-much-too-warm-for-ice-sheets-or-perennial-sea-ice/
every body should take a deep breath and look at what a ice age can do for you DEATH TO EVERYBODY ON EARTH i would like to live as well as my grand kids would CO2 is life
Hey it’s summer;time for a misleading study on ice loss to surface…..
The Greenland Ice sheet melt bugaboo is another alarmist nonsense that keeps getting recycled. I covered the basics alarmists never mention in essay ‘Tipping Points’ in ebook Blowing Smoke,
There is a quasi cyclic Arctic warming/cooling cycle with an approximate period of ~65 years peak to peak. This is evident from sea ice observations going back to the last centuries whaling ships. The first paper on its ‘climate’ consequences was Alaska Arctic expert Akasofu in 2010. There was a significant refinement with Wyatt and Curry’s 2013 stadium wave paper. I covered more amusing stuff circa 2014 in essay ‘Northwest Passage’ in ebook Blowing Smoke.
GIS is very much a part of this cycle. Unfortunately for alarmists, they started raising alarm about Arctic summer sea ice and GIS melt around 1980, about when cooling peaked and the warming half of the Arctic cycle started roughly coincident with satellite summer sea ice observation. Well, 32 years later was 2012, the nadir for summer Arctic sea ice. It has been increasing since, and correspondingly GIS losses have slowed significantly.
Natural variation is provably real. And the model attribution problem dragged in by unavoidable parameter tuning is now biting alarmists very hard. Unsettling them, to paraphrase Koonin. Their predictions are all wrong. Nice post.
Almost the entirety of the surface ice loss can be attributed to soot and stupid people driving around on it.
Rather than cherry-picking only the SMB data, much better to focus on the overall mass loss. https://grace.jpl.nasa.gov/resources/30/greenland-ice-loss-2002-2021/ Also, as stated, SMB gain includes rain – which has been increasing in recent years. Rain water adds heat energy into the ice mass when it freezes in-situ and it provides lubrication. Both eventually increasing mass loss not captured in SMB data.
Yeah, and GRACE also shows large mass loss in central India, where there is no ice.
It’s measuring ground water loss there, but your point is that if its showing the actual decline over a longer period it can’t be accurate. Oh its accurate, accurate to reveal this sort of tosh from Koonin: “…plausible that the next few decades will see a further, perhaps dramatic slowing of ice loss.” as the disinformation it is.
you should really start charging Koonin rent in your head … old boy … (who says tosh ?)
Check the live cams at Nuuk Airport…little ice or snow these days which seem to last 24 hours. Nyuk Nyuk,
GRACE has known accuracy issues. ( many, and among them is what is the mantel doing under the land.)
Did you know that the center of gravitational attraction inside the Earth moves west 351° per day and is not located at the mathematical center of the planet? It also has a very small monthly analemma.
how can rain water which falls on TOP of the ice sheet lubricate the bottom of the sheet several thousand feet down ?
Well, it rinses all those heavier than water oils and soots off the surface and star dust is well known for its lubricative properties as well! /sarc
Loydo did you a dark one and is providing incorrect information.
In a column of water, ice will float off the bottom as the density of water is higher. So it isn’t so much lubrication as hydraulic suspension in the case of Greenland.
NB : I have done variants of this calculation in the past under other articles. Some posters have done similar calculations in other sub-threads “above” (I’m in “Sort by : Oldest” mode) your post in this article’s comments section …
OK, let’s “focus on the overall mass loss”.
Your link says “Greenland shed approximately 280 gigatons of ice per year”.
1 Gt of ice (or water) has a volume of roughly 1 cubic kilometre.
The Greenland ice sheet has an estimated total volume of roughly 2.85 million cubic kilometres, i.e. a mass of roughly 2,850,000 Gt.
2,850,000 Gt / 280 Gt per year ~= 10178 years.
What was the level of human technology around 8000 BC ?
How much do you think it may have advanced by the year 12200 AD ?
Here’s a graph for the Acc SMB after 2018, with 2018-19 being the only year much less than
average. Also, a paper showed the warming rate from 1920-30 was 50% higher than that from
1995-2005. It seems like alarmist have a Chicken Little fetish!
https://realclimatescience.com/2021/04/greenland-warmed-much-faster-from-1920-to-1930/
Even 2018-19 ended up positive at nearly +200Gt.
That was the zero starting point for the next year which also ended positive at +400Gt, the zero starting point for the next year and so on ad infinitum.
According to DMI the worst year was 2011-12 which saw a small gain of around 25Gt
Steven E. Koonin’s book, Unsettled: What Climate Science Tells Us, What It Doesn’t, and Why It Matters is magnificent.
If you haven’t read it, you should.
It should be required reading for every citizen (and, certainly, for members of Congress, Senators, staff members, academics, teachers, and all journalists who touch on the subject).
John, You’re making a fatal mistake: you’re assuming they can read……
I got to walk up to the Greenland Ice Sheet in July 2005. Granted, 17 years ago, and this was northern Greenland, when I was in the USAF at Thule Air Base. People had shown me photos of the Wolstenholme Fjord from the 1950s, and…it was the same in 2005. The ice sheet was still pressed up against its moraine, and all of that despite claims that the ice had supposedly retreated a great deal in that area. The long story short, be careful of word-of-mouth, people’s memories, and cherry-picked data and timelines…
Did you make it to Camp Tuto while you were there?
No, I didn’t. Some of the guys in my unit (12th Space Warning Squadron) made it to the Danish station Nord.
I want Greenland to be green again
Or change the name.
The estimated ice mass loss in a year is very tiny
relative to the estimated total mass
The estimated ice mass loss in a year is very tiny
What?
It sure likes gain to me, and a good bit.
The DMI charts all show annual ice gain from 1981 to 2010 ranging from +130 gigatons to as high as +600 gigatons. Even the “meltiest” year of 2010-2011 showed a gain over the year of about 50 gigatons. Who to believe, NOAA or DMI?
…. but all that “fresh water” came out of the ocean to begin with.
On the other hand it would be good if the water locked up in the poles was slowly released to the biosphere – increased rainfall worldwide but especially in desert and other dry areas would be very beneficial.
Make Sahara Green Again?
Al Gore said in 2009 that “the North Pole will be ice-free in the summer by 2013 because of man-made global warming.”
What’s the latest ETA? Asking for a friend.
Where is the water?
As can be seen here there is a periodicity:
https://tidesandcurrents.noaa.gov/sltrends/sltrends_station.shtml?plot=50yr&id=140-012
Is it temperature or melting?
Greenland gains ice mass only from snow deposited during the “cold” months. If the weather patterns setup to deliver a lot of snow over Greenland during this period the mass gain is high. If a high pressure system locks in over Greenland during the NH winter, mass gain is low. Also late snows keeps the albedo up during the melt season. It really isn’t the temperature so much as where the lows track, since away from the coast it isn’t that warm anyway.
for the northern third of the ice, there are 12 cold months
I would love to see a meteorology explanation as to how a high pressure could “lock”
“The study analysed changes in weather systems over Greenland since 1851, using a measure called the Greenland Blocking Index (GBI). The index measures the occurrence and strength of atmospheric high pressure systems, which tend to remain stationary when they occur, causing long runs of relatively stable and calm weather conditions. The high pressure also blocks storm systems from moving in on the region.”
“lock”
Over an extended periode of time.
You Indian? The monsoon “locks” for several months?
Oddgeir
https://www.federalreserve.gov/aboutthefed/educational-tools/chairmans-lecture-series-about.htm
Testing…
https://www.federalreserve.gov/aboutthefed/educational-tools/chairmans-lecture-series-about.htm
Had to clear “pressablecdn.com” on No-Script to post this:
All ice on Earth is already displacing its mass in Magma, the thicker the glacier the less impact it will actually have on sea level compared to thinner melts.
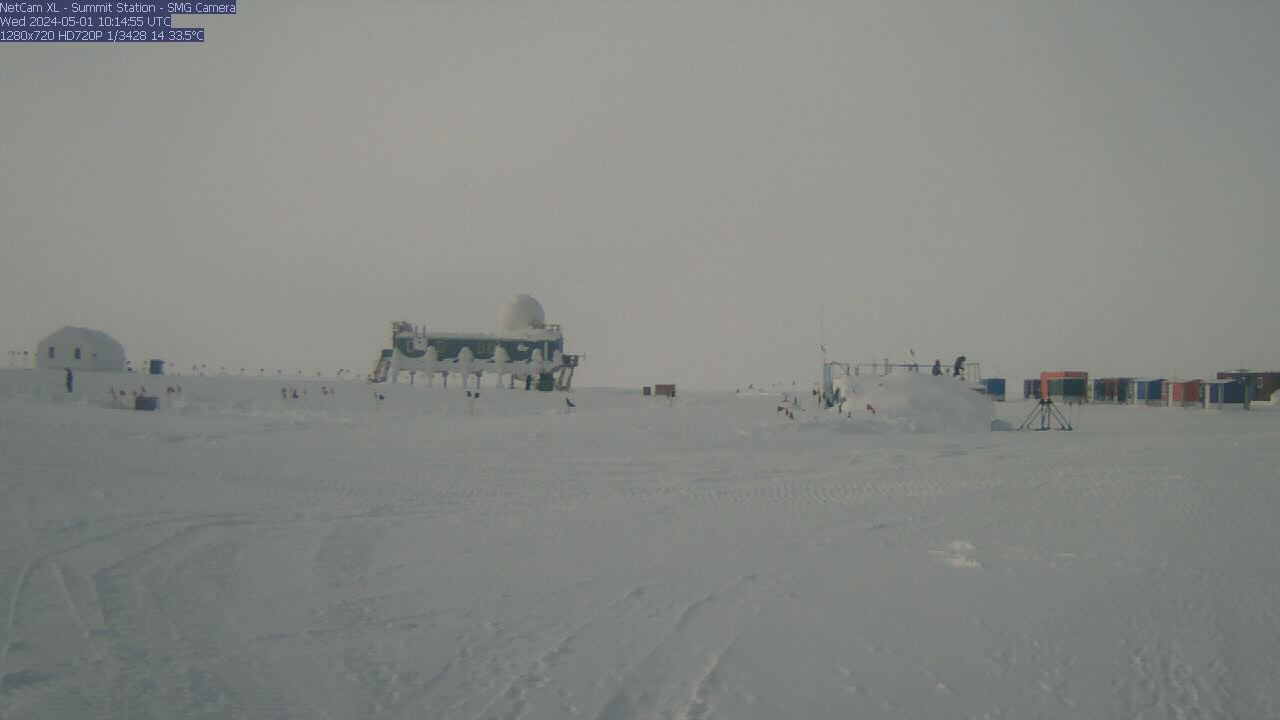
Here is the view of Summit Camp from their web cam as I write this.
 ?t=1656625484
Summit Camp is located near the apex of the Greenland ice sheet. It is important to note that the greatest proportion of the increase in the SMB has occurred not inland where Summit Camp lies, but nearer to the shores.
The bottom line is that according to all the alarmist claims, this should not be happening. It is in fact the exact opposite of what they have predicted. And thus it is not news.
Oh and BTW, the Petermann glacier is growing again and is now longer than it was the last time the terminus broke off in 2012. An event the BBC called “disturbing”.
“It’s dramatic. It’s disturbing,” | Real Climate Science
Summit… I used to follow snow depth, i.e. instrument data. Instruments were- and are lifted a few meters every once in a while to prevent said instrument from being burried under fresh ice-sheet, i.e.snow.
Can’t find the data any longer. Meaning it has been redacted to save climate fictionists, ups climate scientists, from being embarrassed?
gorwell
Did anyone, ANYONE at all, notice that the SMB for the red line (2012), the lowest reading since the dawn of climate fiction, ups climate science…..
Is just shy of POSITIVE 50 gigaton?
Where the heck can anyone, ANYONE at all, find “85 Gt annual mass loss of the GIS was less than the 264 Gt/year average loss over the period from 2002 to 2021”?
There seems to me to be no loss in no year. There seems to me to be SMB gain each year, EVERY year.
Please, WTF is it that I do not understand from this?
Oddgeir