
Any global reduction of cloud cover increases global warming. And reduction of local clouds can cause heat waves. The Big 5 Natural Causes of climate change together, do explain most of the 150 years of global warming, and changes in cloud cover amplify that warming.
When the causes of natural climate change are fully accounted for, as good rigorous science traditionally demands, CO2 can only contribute much smaller amounts of heat than what’s repeated by the narratives of alarmists seeking to control energy policies. Clearly when you follow all the science, there is no climate crisis
Jim Steele is Director emeritus of San Francisco State University’s Sierra Nevada Field Campus, authored Landscapes and Cycles: An Environmentalist’s Journey to Climate Skepticism, and proud member of the CO2 Coalition.
Below is the transcript from the video
Welcome everyone to the final part of the Big 5 Natural Causes of Climate Change – here I examine the impacts of changing cloud cover.
On balance, clouds cool our climate
Conversely, fewer clouds will produce global warming, as well as extreme local heat waves.
As climate scientist Kevin Trenberth explained in 2009, “Global warming is mainly caused from increases in absorbed solar radiation due to decreasing cloud cover.”
Most climate scientists admit, the great difficulties in estimating cloud effects have caused significant uncertainty regards global warming calculations.

Because the amount of water vapor in the atmosphere rapidly declines with altitude, High clouds are usually thin and reflect a minimum of sunlight, but still have a greenhouse effect. Whereas low clouds are denser and will significantly reduce the solar radiation absorbed at the earth’s surface
According to calculations in wild 2019, on average clouds reduce about 54 watts per meter squared of the sun’s energy
One quick side note here: Non-scientists are often put-off by the unfamiliar measurement used by all climate scientists of watts per meter squared. But it is just a measure of energy flowing each second into and out of the earth. For our purposes, all one needs to understand is the greater the number of watts, the greater the energy flow.
To determine if humans are disrupting the earth’s energy balance, scientists construct energy budgets as illustrated here. But the amount of information is so dense, it readily confuses the general public. To help clarify, I’ll guide you through the important points.
It is also important to pay attention to the plus or minus numbers that reflect how uncertain each calculation is.

For example, here they calculate that the earth’s surface absorbs just 6 tenths of a watt more than it emits back to space with that imbalance causing the earth to warm. But being good scientists, Stephens (2012) also published that their calculations could be 17 watts too high or 17 watts too low, reflecting just how unsettled the science is. So, beware of the scientists’ illustrations that do not accurately publish their uncertainty.
Some estimates are very accurate. Satellite measurements of solar radiation have very little uncertainty. After averaging for day and night, and differences between the equator and the poles, energy budgets begin with an average solar input of 340 watts per meter squared at the top of our atmosphere.
After subtracting estimates of the energy absorbed by the atmosphere and reflected by clouds or the earth’s surface, they estimate each square meter of the earth’s surface absorbs on average between 159 and 165 watts.
What confuses most people is why isn’t the earth cooling if the surface absorbs about 160 watts of solar energy, but then releases more than twice that energy away as infrared?
The confusion arises due to the greenhouse effect. Primarily water vapor and clouds, plus carbon dioxide and other minor greenhouse gases readily absorb most infrared energy. But in less than a microsecond, greenhouse gases immediately lose that energy either via a collision with O2 and N2, or emit that energy, with half that energy being directed back towards the surface and recycled. The recycling of infrared energy is called greenhouse warming, but it would be more accurately called delayed cooling. The more energy that is recycled the slower the surface cools.
Click-bait mainstream media and politicians greatly mislead the public when suggesting CO2 traps heat energy. Each time heat energy is recycled back towards the surface, the earth quickly emits 10% to 30% of that energy as infrared energy in wavelengths that greenhouse gases cannot absorb. So, with every recycling of downward infrared energy, 10 to 30% leaks back to space uninhibited and it exits at nearly the speed of light.
Clouds increase the amount of greenhouse heat that gets recycled, and according to wild 2019, on average clouds re-direct 28 watts per meter squared back to the surface.
However, because clouds reflect away twice as much solar energy as they recycle, on balance, clouds cool the earth by 26 watts per meter squared.
Eventually it is estimated that 239.7 watts per squared, and an uncertain plus or minus 3.3 watts, escape to space. The claim that CO2 is causing a warming crisis by creating a heating energy imbalance of 0.6 watts per meter squared is questionable simply due a level of uncertainty that is 5 times greater than their claim
Furthermore, when compared to the IPCC’s estimated 2.5 watts of added greenhouse gas warming, reduced cloud cover can also amplify solar heating. A cloudless sky can have 10 times the heating effect of CO2.

The earth’s atmospheric circulation causes both moist regions with dense cooling clouds and hotter drier regions with clear skies. The primary driver of atmospheric circulation is the Hadley Circulation. The intertropical convergence zone or ITCZ is a region near the equator where the north and south trade winds converge, driving moist air upwards and generating towering cumulonimbus rain clouds.
Thus, the ITCZ covers a region of heavy precipitation which sustains the earth’s equatorial rainforests.

What goes up must come down. After the moisture rains out, the air is dry and sinks to the north and south of the ITCZ. The sinking dry air prevents cloud formation, minimizes rainfall, and increases extreme solar heating, characteristic of the world’s deserts.
When incoming solar energy is averaged across the globe, it obscures critical local dynamics caused by clouds. Whereas the global average of surface solar heating is about 160 watts per meter squared, at midday under clear tropical skies, the surface can receive 1000 watts. Under the clearer skies at the edge of the Sahara Desert, Aswan, Egypt constantly receives 160% of the averaged solar heating (or 263 watts per meter squared)

Cloudless desert skies also cause extreme weather swings. According to NASA, deserts experience the most extreme annual maximum temperatures, averaging 38 Celsius or over 100 degrees Fahrenheit. With fewer clouds, surface heat more rapidly cools at night as less infrared heat is recycled. And temperatures can drop by 75 degrees Fahrenheit falling below freezing.
In 1913, Death Valley reported the world’s record high daily temperature of 56.7 Celsius or 134 Fahrenheit. Just 6 months earlier, similar dry cloud free conditions produced Death Valley’s coldest minimum temperature of minus 9 degrees Celsius or 15 Fahrenheit.
On smaller scales, heat domes form wherever descending air currents prevent convection and reduce cloud cover, causing extreme solar heating,

Jet stream troughs promote rising convection, more clouds, and cooler temperatures. Jet stream ridges cause dry descending air, less cloudy skies, and high temperatures
The cloudless skies beneath a stalled jet stream ridge caused the stifling heat dome over northwestern north America in 2021. As detailed in part 2, that heat dome generated Canada’s record high temperatures of 49.6 Celsius or 121.3 Fahrenheit.
On a global scale several studies have reported cloud cover has been decreasing since at least 1980, with the advent of satellite coverage. A 2014 study determined there was a 6.8% decrease in cloud cover over the northern hemisphere which increased solar heating by 5.4 watts. That declining cloud effect adds twice as much solar energy than what the IPCC attributes to rising greenhouse gases, and over 3 times the heating attributed to rising CO2.

A 2022 paper reported a similar decrease in cloud cover, noticing the rise in global temperatures correlated with decreasing cloud cover. Thus, researchers also argued cloud cover has a greater radiative effect on global warming than rising CO2.

However, different types of clouds have different causes and very different heating and cooling effects, so more detailed analyses beyond total cloud cover are needed to correctly assess the effects of changing cloud cover. Low level clouds below 2000 meters, significantly reduce solar heating and minimally add to any greenhouse warming.

Stratus clouds form in flat layers when moist air sits over cooler surfaces causing, water vapor to condense into liquid drops. Moist air traveling over regions of cold ocean upwelling produces low stratus clouds, also known as fog. Also, when a warm air mass gradually moves over a cold air mass stratus clouds form.
In contrast, the lumpier tops of cumulus clouds form when heated surfaces cause several currents of rising moist air that condense at higher altitudes.
If there is an abundant supply of moisture, such as over tropical oceans, the latent heat released from condensing moisture powers the rising momentum that grows a low-level cumulus cloud into a towering cumulonimbus that rises to the stratosphere. Because the stratosphere is warmer than the rising air, these cumulonimbus clouds flatten out at the stratosphere boundary causing the characteristic flat anvil top.
High altitude cirrus clouds are thinner and don’t reflect much solar heat but do have a small greenhouse effect causing net warming. Cirrus clouds are often produced by the outflow from the anvil top of cumulonimbus clouds. Because cirrus clouds are composed of ice crystals and slow to evaporate, cirrus are often transported far from their point of origin.
Observing the narrowing of the ITCZ during the decades of recent warming and the resulting reduction of cirrus cloud production, MIT’s Dr. Lindzen postulated the “iris effect”, a negative feedback mechanism promoting climate balance by reducing cirrus caused greenhouse warming.
Adding to the complexities of cloud science is the diversity of cloud life cycles, with most individual clouds growing and dissipating in less than one hour. Their varied lifetimes are being better determined by geo-stationary satellites. The Madden Julian Oscillation, first discovered in 1971, is a natural climate dynamic causing growing and dying clouds to move across the tropical ocean at speeds between 14 to 19 kilometers an hour, creating alternating regions of heavy rains and marine heat waves.

Heated waters of the Indian ocean warm pool initiate rising convection that gives birth to a cumulonimbus cloud. As the cloud grows, it reduces the amount of infrared heat that escapes to space. However, it also increasingly blocks solar heating, and on balance causes the ocean surface to cool which initiates the clouds decay.
After the moisture rained out of the rising air in the growing cloud, the remaining dry air descends further to the east suppressing convection The cloudless skies beneath the descending air causes intense solar heating of the ocean surface. According to Wirasatriya (2017) 60% of the equatorial hot events with sea surface temperatures exceeding 30 degrees Celsius for 6 to 30 days, are associated with this phase of the MJO Eventually surface heating initiates a new region of convection and new cumulus cloud formation
The intense convection of the Madden Julian oscillation also initiates other wave trains of rising and sinking air that stretches across the hemisphere. The wave train’s high-pressure areas can create heatwaves as far away as the Atlantic.

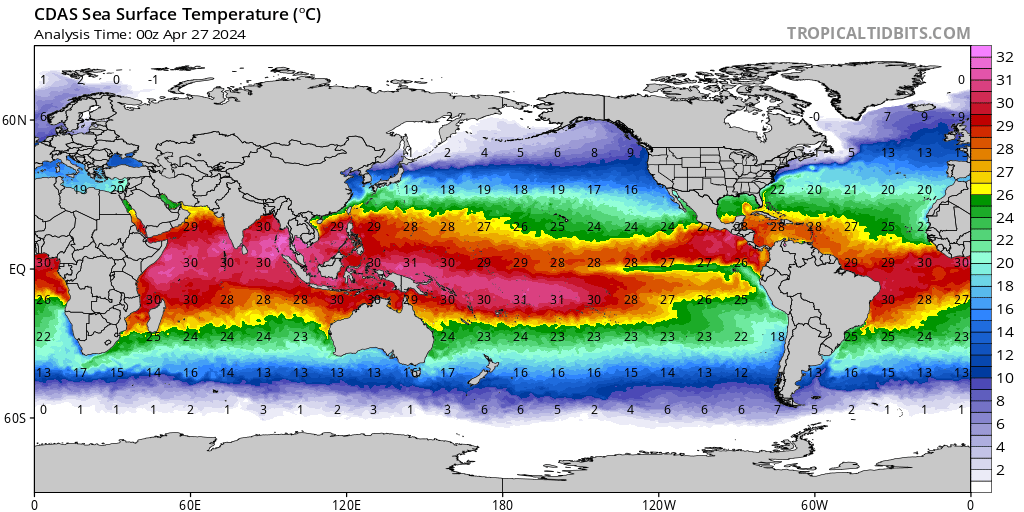
The greatest amount of solar heat flux into the ocean happens along the equatorial Pacific, and that heat then gets transported across the globe and to warms the earth. The cloudless areas of intense solar heating during the Madden Julian Oscillation’s hot events contribute to the increased heat flux into the western and central Pacific. But due to upwelling of colder waters in the eastern Pacific, the Madden Julian oscillation doesn’t reach that region.

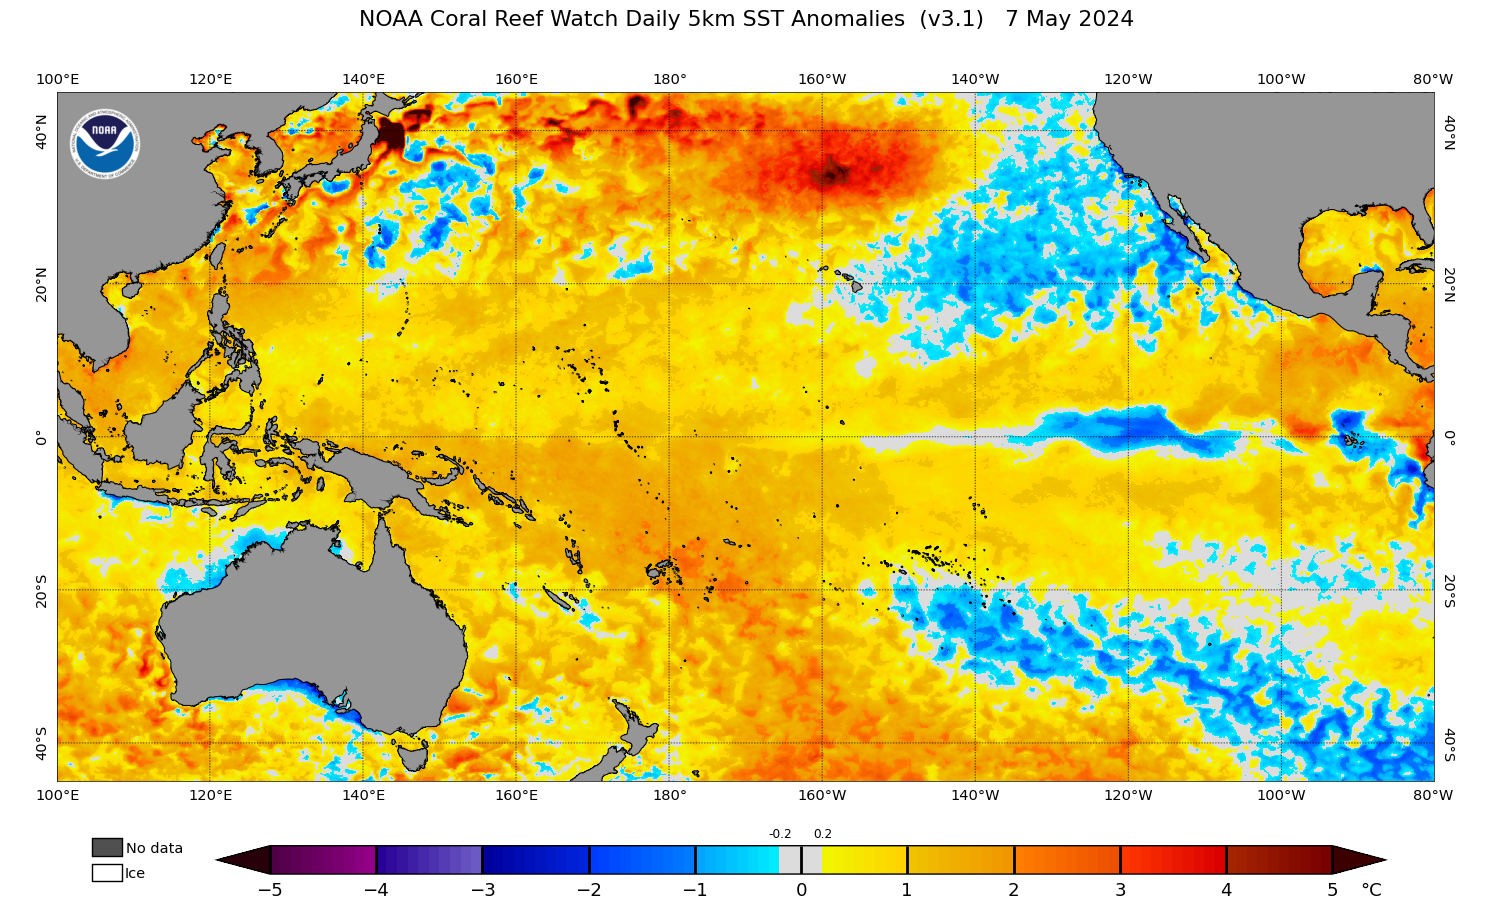
As detailed in part 3 of this series, it is the clearer skies in the eastern Pacific associated with La Nina like ocean conditions that enables the greatest amount of heat flux into the eastern Pacific.
Not only do La Nina like conditions in the Pacific increase ocean heating, La Ninas and the related negative Pacific Decadal Oscillation, expand the Hadley circulation’s region of reduced clouds and increased solar heating

And same as the Madden Julian Oscillation, La Nina’s center of intense convection in the western Pacific, initiates hemispheric wave trains and alternating regions of high and low pressure. The descending air under one high pressure region resulted in clear skies, increased solar heating and calm winds that reduce evaporative cooling, and produced a notorious long-lived heat wave in the north-eastern Pacific dubbed “The Blob”

Every 3 to 7 years an El Nino causes an eastward flow of warm water, that increases cloudiness and reduces heat flux into the eastern Pacific. The first extreme El Nino of the 21st century happened in 2015 and 2016
That El Nino shifted the center of intense convection eastward, which also produces different wave train pathways. Accordingly, the 2016 El Nino’s new wave train ended the hot Blob’s existence.


Coral reefs of Fiji, Tonga & Rarotonga have recorded 150 years of ocean warming and are sensitive to temperature changes caused by the Pacific Decadal Oscillation.
La Nina-like conditions during each negative Pacific Decadal Oscillation (PDO) phase reduce clouds in the eastern Pacific. Accordingly, during each negative Pacific Decadal Oscillation phase, ocean heat content has increased

El Nino-like conditions dominate during each positive PDO phase, generating a cloudier eastern Pacific & reduced ocean heating
Several studies have reported that the Hadley circulation is widening, Especially during La Ninas and negative Pacific Decadal Oscillations As the regions of descending air currents and reduced-cloud cover expand poleward, heat flux into the Pacific increases.
Both observational and modeling studies find That as the world warmed the Hadley circulation intensified and the ITCZ narrowed. As illustrated by Su (2017) the narrowing of the ITCZ causes the region of cumulonimbus clouds to narrow but extend further upwards (the darker blue cloud), while reducing the cirrus clouds that before had extended away from the anvil tops (the gray cloud outlines). That dynamic is similar to Lindzen’s “Iris Effect” that would reduce cirrus greenhouse warming.

But there would also be a greater warming effect caused by the reduction in low level subtropical clouds that allows greater solar heating. As Shin 2012 and others have reported, the Hadley Circulation’s intensification widens the regions of descending air currents, reducing cloud cover and expanding the dry lands as illustrated by the change from larger low level clouds areas before (colored gray) evolving into smaller low level cloud cover (illustrated in darker blue).
The regions with the greatest reduction in global cloud cover occur where heat flux into the oceans is greatest.
So, to whatever degree the cause of global warming, whether the Big 5 Natural Causes or added CO2, the resulting reduction in low level tropical cloud cover would serve as positive feedback amplifying any warming.
The Big 5 Natural Causes of climate change together, do explain most of the 150 years of global warming.

When the causes of natural climate change are fully accounted for, as good rigorous science traditionally demands, it constrains to what degree warming effects can be attributed to rising CO2.. Constrained by natural climate change, CO2 can only contribute much smaller amounts of heat than what’s repeated by the narratives of alarmists seeking to control energy policies. Clearly when you follow all the science, there is no climate crisis
Up next: Well, I’m taking a 2-week vacation will determine the topic of my next video when I return. But I encourage you to send me suggestions for topics that you feel are needed to further clarify climate science
Until then, heed renowned scientist Thomas Huxley’s advice, skepticism is the highest of duties and blind faith the one unpardonable sin.
And if you appreciate the science clearly presented here, and rarely presented in mainstream media then please, give it a like, give it a share or copy the URL and email it to friends, subscribe to my channel to find all my videos or read my book Landscapes and Cycles: an Environmentalist’s Journey to Climate Skepticism.Thank you
Please reconsider to point you are trying to make. I know it seems to make sense, but it IS wrong.
What clouds “radiate back” to the surface is irrelevant. There is no “back radiation” driven GHE! You could already take this from Wikipedia on the Schwarzschild Equation..
For “back radiation” however the lapse rate is largely irrelevant.
It is roughly accurate that clouds additionally(!!!) reduce emissions by about 30W/m2. That’s what they “add” to the GHE. However the “additional” here is pivotal. Actually the CRE is much larger than this, about 75W/m2. 60% of it, or about 45W/m2, are overlapped with GHGs. In the literature the terms would be “single factor removal” (net) and “single factor addition” (gross).
It turns out the CRE gross is larger than the albedo effect of clouds. The claim of clouds cooling is unsubstantiated. And indeed we see clouds are actually warming if we analyze weather records.
https://greenhousedefect.com/the-beast-under-the-bed-part-1
https://greenhousedefect.com/basic-greenhouse-defects/the-beast-under-the-bed-part-2
(again, I think 75W/m2 is likely more accurate than 80W/m2)
Please go outside. When its cloudy during the day it is cooler outside. If your calculations don’t match these observations, then your calculations are not right.
There are not just days, but also nights.. (little hint)
Night time = max +1c
Day time = max -10c
Shaffer, Anyone who argues that “There is no “back radiation” joins my whackadoodle list of people who deny the most basic evidence to push their own theories. They are a detriment to the skeptical arguments and make skeptics look like flat earthers.
Back radiation is measured by pyrgeometers, by scientists of all ilks.
You can argue to what degree back radiation has an effect, but you are crazy wrong to deny it exists.
And when you insert a “lapse rate” strawman, clearly you have an agenda of pushing your personal agenda supported only by your assertions that everyone else is wrong.
Where would I deny the existence of “back radiation”? I know it is measured, of course it exists. The problem is in the other direction, as “back radiation” is everywhere. Everything radiates back and forth. Neither is the atmosphere specific in this regard, nor would you argue a “GHE” in any other instance..
By alleging me saying something I do not, you dudge the argument, which is perfectly accurate. Not just that, this is pivotal to understand the very basics of cliamte physics.
And this is part of a much bigger problem. The state of “consensus science” is very bad. But the “critical side” is even behind it. Instead of rightfully sorting out the flaws in the “science”, you are not aware of, you introduce new theories without need.
I should have quoted you more precisely. Your exact words, “There is no “back radiation” driven GHE!”
As stated in the video, back radiation slows the cooling process. And because a minimum temperature does not drop as low as before by the time the sunrises it is misleading called global warming.
Indeed it is pivotal “to understand the very basics of climate physics” and you are blinded by your own arrogance. There is not one shred of evidence presented by you that shows the bascis science presented in the video is not correct.
There is no arrogance in pointing out mistakes. You may feel offended because you take it personal, and that is what blocks discussion and progress. It is the wrong attitude in science.
With regard to the “back radiation” issue there is in fact an overkill of evidence. Even the IPCC has corrected its position on it by now, without making much noise over it (understandably). Therefore it is also a great example how “consensus” science can be overturned, when tackling actual mistakes.
As to the evidence I have named a couple of perspectives in the posts here. Feel free to take them on. Or ignore them and follow your beliefs..
And you still offer no scientific evidence, just BS narratives. You are either a troll or blindly arrogant because “you may feel offended” that your ideas are not scientifically supported.
Perhaps you can explain your grossly flawed reasoning on how back radiation “cannot” slow the earth’s cooling which then results in a higher minimum temperature???
No, YOU need to explain how increasing heat absorption in already ice-cold air can reduce cooling. That explanation is needed before any explanations about “back-radiation”.
This is how insulation works:
Thermal insulation provides a region of insulation in which thermal conduction is reduced, creating a thermal break or thermal barrier,[1] or thermal radiation is reflected rather than absorbed by the lower-temperature body.
Thermal insulation – Wikipedia
As you see, the way to reduce heat loss is to MINIMIZE heat absorption in the surroundings of a hot body. Greenhouse gases do the opposite, they INCREASE heat absorption in the surroundings of the hot body(Earth surface).
In regards to clouds, the whole water cycle is a cooling process.
Evaporation causes both the water surface and the air to drop in temperature, this is demonstrated in evaporative coolers. Then the heat is transported away from the surface and dumped at colder altitudes when clouds form. The clouds block heat from entering the system, and then cold rain falls on the surface and cools it even more.
Everything about the water cycle is cooling, we live on a planet with both air-cooling and water-cooling. This planet would be much hotter without the freezing cold atmosphere and the oceans. Just think about the massive volumes of water in the oceans which are on average almost 4km deep and have an average temperature of 3C, sitting on the thin crust of the ocean floor with the hot mantle below. Imagine how hot the ocean floor would be without 4km of 3C water sitting on top of it. Just like a water cooled combustion engine.
Geesh this high school level physics. That I need to explain this to you and your ilk reveals how truly clueless you all are.
Unless a surface is at absolute zero it emits IR. It doesnt matter if an object is cooler, it emits radiative heat that is added to the warmer surface. However because warmer surfaces emit more than they are absorbing from the cooler surface that is emitting less, the cooler surface surface can not cause the warm surface to get warmer, it just causes it to cools more slowly.
I suggest you audit a high school physics class to start.
But increased heat absorption in the surroundings of a hot body increases cooling. Co2 increases heat absorption. The way to reduce cooling is to minimize heat absorption in the surroundings, like how you use insulation to reduce heat transfer. Co2 and water vapor does the opposite of what insulation does.
Wow . I can only assume by such nonsense you are purposively trying to make skeptics look foolish.
One of the concepts employed by climate researchers is the magical “backradiation”, which I knew from the beginning violated the Second Law of Thermodynamics. Even the esteemed Dr. Roy Spencer embraced this questionable “lukewarmist” concept. I met Dr. Spencer in 2009 in NY at ICCC-09, at which time I got a signed copy of his “The Great Global Warming Blunder” book.
After digesting his book I had to confront Dr. Spencer on his website when it was still interactive. I actually remember what I said ….” Roy I love you man…..but you are dead wrong about this backradiation thing”. Of course he didn’t agree. I knew that in time I would be vindicated, especially since Al Einstein (while still alive) and I agree there is no more perfect theory than Thermodynamics.
Roy has done a renaissance since then, especially when an article I posted to this thread, revealed that the manufacturer of temperature instruments were being improperly interpreted by climate researchers, i.e., the conclusions deduced were simply incorrect. The attached link provides demonstrated, experimental, empirical data to back the manufacture’s claim.
The linked independent study by Mexican Professor Nasif Nahle reports:
“I demonstrate that warming backradiation emitted from Earth’s atmosphere back toward the earth’s surface and the idea that a cooler system can warm a warmer system are unphysical concepts.”
Professor Nahle discovered that what climate researchers have been claiming as ‘backradiation’ heating from their infrared meters is “contamination” from the instrument itself and not the byproduct signal of any supposed ‘back radiation’ heating.
The link posted is further evidence of the fallacy of the failed CAGW theory, undermining one of its basic foundations, i.e., the “greenhouse gas effect”.
Professor Nahle continues:
Does thermal radiation emitted by a cooler atmosphere warm up a warmer surface by backradiation? No, thermal radiation emitted by the atmosphere does not warm up the warmer surface.
This argument is unphysical because the thermal radiation emitted by the atmosphere is never higher than the thermal radiation emitted by the surface and it decreases in time in accordance to the thermal radiation emitted by the surface; additionally, the negative change of temperature of the atmosphere increases in time, contrary to what would happen if it were warming up the surface.
What makes it more convincing is that its empirical evidence back up by experimentation– one of the precepts of the Scientific Method checklist that Drs. J. Scott Armstrong & Kersten Green postulated.
And I didn’t have to go to three discussion groups to determine the faux science behind CAGW. The wonderful education in Chemical Engineering that I received decades ago provided the critical thinking skills to conclude the obvious.
Carbon Bigfoot
One of the Dispellers of the Magical Back Radiation Mystery Tour
Bigfoot, You completely misunderstand that arguments. No One, be they alarmist or skeptic argues that a ” cooler object can warm a warmer object”
As has been told countless times to your flat-earther-cult that incessantly tries to eliminate back radiation, the heat from a cooler object does not cause warming, but undeniably and most definitely delay cooling. That delayed cooling causes a higher minimum temperature, which because it is averaged with a maximum temperature causes a warmer global average, then gets incorrectly described as warming.
Your arguments not only make Prof. Nahle look really stupid but call into question your understanding of the Second Law of Thermodynamics
Jim insults don’t become you. I’ve spent 50 years in this business and your understanding of thermodynamics is typical of a non-engineer. And your not alone.
Of course, we can swap insults instead of debating the science. However you just do it in a passive aggressive egomaniac way suggesting its you who knows more than everyone else.
Whereas I presented the undeniable science that radiative heat from a cooler body can delay cooling of a warmer body and be misinterpreted as warming, none of the Principia cult address that dynamic but goes off on weird tangents while trying to dismiss measured back radiation.
“the heat from a cooler object does not cause warming”
There is no heat coming from a cooler object to a warmer object. The definition of heat is: the energy in transfer from high to low temperature.
What happens is that the rate of transfer from the hot object is reduced when the temperature of a colder object increases. When the temperature of the colder object increases it absorbs less heat, because heat absorption depends on delta T. But guess what? GHGs increase heat absorption. You can´t have both, you can´t increase heat absorption and at the same time have increasing temperature. If the atmosphere increase heat absorption from increasing GHGs, then the temperature of the atmosphere must drop. If the temperature of the atmosphere increases, then heat absorption must drop.
The atmosphere has higher entropy than the surface. A high entropy body cannot reduce the entropy of a lower entropy body. Your claim is that a low entropy body will further reduce its entropy from the influence of a high entropy body, and its wrong. Entropy always increases.
“The law that entropy always increases holds, I think, the supreme position among the laws of Nature. If someone points out to you that your pet theory of the universe is in disagreement with Maxwell’s equations – then so much the worse for Maxwell’s equations. If it is found to be contradicted by observation – well, these experimentalists do bungle things sometimes. But if your theory is found to be against the second law of thermodynamics I can give you no hope; there is nothing for it but to collapse in deepest humiliation.”
— Sir Arthur Stanley Eddington, The Nature of the Physical World (1927)
Second law of thermodynamics – Wikipedia
LOL You really need to audit a low level physics class to get the basics.
Lit claims “The definition of heat is: the energy in transfer from high to low temperature”
Lit you are totally ignorant of the difference between heat transfer and NET transfer.
You engage in magical thinking that somehow a warmer body can only receive radiative energy from a warmer body, as if it knows from where the IR is coming.
These considerations are unnecessarily complicating what is trivial. The most obvious and valid description of the GHE is that of the (warm) surface being substituted by a colder atmosphere as emitter. If emissivity was 1 throughout, that would be 255K instead of 288K. This definition is in accordance with the Schwarzschild equation.
“Back radiation” believers would now argue this is just one side, while “back radiation” is the other side of the GHE. This is odd, since then we had two GHE theories. But it is also straight forward wrong.
From this definition also follows what I quoted above..
Of course the atmosphere must be colder than the surface to provide a GHE. If the atmosphere was isothermic there could be no GHE, again this is well established. Also, if the lapse rate is negative (temperature would increase with altitude), the GHE turns negative.
What happens to “back radiation” as we rotate the lapse rate? As most “back radiation” comes from the lowest atmosphere, it will not change a lot. Yet, with an isothermic atmosphere, it would grow a little bit, while the GHE turns to zero. With a negative lapse rate, it would grow a bit more, while the GHE turns negative.
It is from this consideration alone that we can definitely tell, GHE and “back radiation” are not related, and in fact negatively correlated with regard to the pivotal parameter, which is lapse rate. Also for this reason there is no need to deny the existance of “back radiation”, which can be measured..
Jim Steele while you’re on vacation enrich your science and life:
https://principia-scientific.com/publications/New_Concise_Experiment_on_Backradiation.pdf
Jim Steele take your argument to Principia-Scientific.Where the real experts reside.
LOL, No need. It appears the Principia-Scientific cult has descended here with their same tired mission of attacking any mention of “back radiation”
It seems like you dont know how a pyrgeometer works. It´s a stack of thermocouples(thermopile) that measures a gradient across itself. When pointed to a lower temperature(the sky) it has a negative gradient as it measures the lower temperature of the sky from a distance. It can only measure a short distance of about 25m into the sky. From this gradient in the thermopile it calculates the heat transfer *from* the pyrgeometer to the surrounding atmosphere, and from the rate of heat transfer it can calculate the temperature of the air above. It does not measure radiation from the sky, it measures heat transfer from the pyrgeometer TO the sky. By twisting the arm of the Stefan-Boltzmann equation for radiative heat transfer it then takes the detected temperature of the measured air and implies that this is the amount of radiation downwards. The S-B equation cannot be used like this. It can only calculate the heat transfer from high to low temperature. So, as you see, the pyrgeometer doesn´t measure back-radiation, it measures how cold the atmosphere is from a distance of up to 25m. And 25m is under optimal conditions, it´s mostly much less.
The only sensor inside a pyrgeometer is a thermopile. Can a thermopile measure incoming radiation from a lower temperature than the sensor itself has? Of course not.
Then there are other more sensitive spectral sensors that are used. These sensors need to be cooled to cryogenic temperatures to get rid of the noise. If I remember rigth, they´re cooled to about -70C. Do you know what the problem with those are? No you don´t, so I´ll tell you. They don´t measure the radiation that is received by the earth surface, they measure the radiation that the earth surface would receive if it was -70C. You see how that works? There is no heat transferred from a low temperature atmosphere to a high temperature earth surface, because you can only measure that heat radiation when you cool your sensor to a much lower temperature than the atmosphere.
It is common that climate scientists have no knowledge of the instruments they refer to. Maybe you should learn how a pyrgeometer works before you refer to them as evidence of your fantasies.
It appears it is you have a very incomplete understanding of a pyrgeometer
The impact of atmospheric water pivots around 45mm TPW. That is where the atmosphere changes gear and enables cyclic deep convection. Cyclic deep convection is net cooling.
At the present time. There are three months of the year when atmospheric water provides net heating trend and nine months when it provides net cooling – annually atmospheric water is net cooling. It is detailed in this paper:
http://www.bomwatch.com.au/wp-content/uploads/2021/08/Bomwatch-Willoughby-Main-article-FINAL.pdf
The gear change is detailed in the last section. All the E-M data for the charts is top of the atmosphere. There is surface data from moored buoys to show the temperature limiting process.
Part 3 of the paper shows the global ocean effect of atmospheric water by months.
Or you simply consider how WV influences the lapse rate. The smaller the lapse rate, the smaller the GHE. In fact lapse rate feedback (LRF) is an acknowledged mitigator of “global warming”, as with the IPCC. While basically true, it is not really a “feedback”, but that is another story..
Bringing in lapse rate is far more complex than the very simply fact that open ocean surfaces are limited to 30C apart from fleeting excursion as the deep convection kicks in. That is all anyone needs to know to realise there can be no thermal runaway.
No one can dispute this as the evidence is abundantly clear and proven every day of every year:
Exceptions such as the Persian Gulf where LFCs cannot form give insight into the temperature limiting process.
The lapse rate is not complex in meteorology, a well established science I would assume. There are formulas and tables telling you what is going to happen depending on how much vapor there is. A classical emagram…
https://en.wikipedia.org/wiki/Emagram
Why would we need to re-invent the wheel, or ignore existing knowledge?
The process of deep convection is most often quantified in Skew-T plots but these do not identify the critical fact – open ocean surfaces cannot exceed 30C as a result of deep convection causing surface energy balance at that temperature..
The unique feature of convective potential that drives deep convection is the break point in the lapse rate at the level of free convection observed on the skew_T plots.
http://tornado.sfsu.edu/Geosciences/classes/m201/buoyancy/SoundingAnalysis/SoundingAnalysis4.jpg
There is dry air above the LFC and most air below. This convective instability eventually leads to explosive vertical ejection of moist air into the dry zone driven by the latent heat of the condensing water but the lapse rate suddenly shifts to the saturated air lapse rate resulting in high level water vapour above the freezing level that forms persistent cirrus cloud as it solidifies.
TPW of 45mm and above supports cyclic deep convection. The more moisture, the shorter the cycle and the higher the cloud. So radiating temperature reduces but the reflected sunlight increases faster than the reduction of OLR with increasing moisture above 45mm. The surface energy balance over open ocean water is zero at 30C. That is as warm as it can get and no climate model incorporates this fundamental limit.
Unsubstantiated ? Whatever are you talking about ? How about 21 years of Ceres data, courtesy of Willis E.? Negative is cooling.
He is only quoting the erroneous data, and erroneous they are for the reasons named above. Beyond that, I would not quote anyone who still believes in a “back radiation” GHE..
ES,
for 2 parallel surfaces radiating heat between them
q/a= [k/(1/ehot+1/ecold-1] x (Thot^4-Tcold^4)
Back radiation is simply the (-Tcold^4) part.
Using Trenberths Sankey diagram, at 15C average the IR upwards from the ground as seen looking down is about 396 watts.
And from the ground view, the sky appears to be about 4 C average which is 333 watts going downwards.
The net is approx 63 watts upwards.
Not believing in the energy of those back radiation photons is not believing in one of the cornerstones of modern physics.
And I can confidentially tell you, that believing in “back radiation” as a source of energy, is the equivalent to believing in free energy.
As with this diagram, the surface would “heat” the atmosphere with 350W/m2, and the atmosphere “heat” the surface with 324W/m2. Not incidentally these figures are very close, and if they were more accurate, they would be even closer.
Now the intellectual issue people have, is to see these are not two independent flows (and sources!) of energy running against each other(!?), but rather it is only radiation pressure which is a function of temperature. Not vice versa.
I believe in photons….
Also in the end you are saying in the above Sankey diagram, that you should erase the 324 back radiation and change the 390 to 66 (of which 40 escapes through the atmospheric window). If you specify this change as “Net Heat Flow”, you will be correct….However, a first year physics or engineering student would point out that at 15 C the ground radiates 390 watts upwards according to what they just learned about Planck’s law… (so how does your 66 net make sense ? would be their question)…..so Trenberth and others had to include the radiation from sky to ground. Both theory and instruments show it’s existence.
By the second year he would hopefully learn to take emissivity into account.. 😉
The maximum heat emission at 255K from a perfect emitter, a blackbody, is about 240W/m^2. That illustration claims that the atmosphere emits almost 100W/m^2 more than a blackbody.
Yes indeed. The Earth’s atmosphere must have been much cloudier and denser during the Hot House periods.
And then you have exhibit B, Venus, where very little sunlight reaches the surface due to thick clouds but obviously the surface is hotter than the sun alone can make it.
Clouds have a net warming effect at the surface.
Yeah, maybe the example of Venus is helpful in understanding the issue. “Back radiation” on Venus must amount to about 15.000W/m2. We know this because of the temperature there. By comparison solar radiation is almost negligible, as only 2% reach the surface, or about 13W/m2.
“Back radiation” believers would argue it is so hot, because of the massive “back radiation”. However, “back radiation” is definitely so large because of the temperature. What a mess.. 😉
Venus is hot because it has 90 times as much atmosphere as Earth, over 95% of which is IR absorbing CO2 compared to Earth’s paltry .04% CO2. Back radiation isn’t the primary calculation involved on either planet.
Planetary Albedo and atmospheric absorption in the IR bands from surface to TOA and convection are what determine surface temp, and resultant “back radiation” that results from the “sky temp” as viewed from the ground.
Measured Change = natural change + man made change + [measurement errors]
They claim measurement errors are zero. OK.
I’ve the graphs of measured change. So where’s the graph of natural change or man made change?
I suspect they don’t want us to see their claims for natural change flat lining. That would be hard to explain.
That is the whole point of Dr. Mann’s fraudulent* hockey stick. The Medieval Warm Period is an inconvenient example of natural climate change. When someone complained about that, Mann dutifully produced his bogus science purporting to show that global temperature had hardly changed at all until the modern era.
*Mann sued Tim Ball for his remark that Mann belonged in state pen rather than Penn State. Then Mann avoided going to court and presenting evidence under his control. That gives rise to adverse inference. We may infer that the reason Mann did not present evidence under his control was that it did not support his case. ie. Mann does indeed belong in the state pen.
MN must have tons of clouds because it was 70 flipping degrees! I demand global warming now.
It isn’t lots of clouds- the ice has only been off the lakes up north for ~1 month. There was low fog
over the lakes this am @ 41°F. It hit 72°F & I easily survived 31°F GW! 😮
Where is the data that demonstrates this belief?
Open oceans surfaces have a temperature limit of 30C. This is a result of the persistence of cloud in deep convecting zones. Cyclic convection kicks in when TPW reaches 45mm and cloud persistence balances energy in and out when the surface temperature reaches 30C.
So the clouds will be whatever they need to be to limit open ocean surface temperature to 30C. It is the reason there is no thermal runaway.
That is all anyone needs to know to be certain there is no climate crisis.
Climate models fail this basic test. The attached charts compare measured surface temperature in the Nino 4 region during the satellite era with the hindcasst and forecast of the ACCESS model using CMIP6 input. This is the Western Pacific and the surface occasional reaches the 30C limit. The climate model has the present temperature in the ballpark but the 1980 hindacst is 1C cooler than actual in 1980 and the future gets to 32C by 2100 (a physical impossibility with present atmospheric mass).
All climate models show warming trends in the tropical Pacific during the satellite (moored buoy) era where there has been no warming. In fact the Nino34 region has cooled during the satellite era:
http://bmcnoldy.rsmas.miami.edu/tropics/oni/ONI_NINO34_1854-2022.txt
Overall atmospheric water has a cooling effect on ocean surface temperature. Climate models separate atmospheric water into its phases with solid and liquid water (clouds) unrelated to water vapour.
When it comes to the clouds and global warming/cooling, there’s tremendous uncertainty and disagreement as will be on display in the posts here.
Another reason that high clouds have a net warming, is that they are located in a location of the atmosphere where it’s extremely cold.
Clouds emit energy in proportion to their temperature.
The cloud tops of low warm clouds emit more thermal energy than high, cold cloud tops.
Of course thin, high clouds allow most of the more powerful, solar short wave energy to pass thru during the day.
SInce something like 2/3rds of the planet is covered by clouds much of the time, they make a huge deal.
There are numerous speculative theories relate to clouds. Some suggest that a warmer planet has altered lifting condensation levels and increased temperature makes it tougher to saturated air masses and has resulted in the decrease in clouds.
Others claim that same decrease in clouds…came first and it’s responsible for much of the global temperature increase.
Regardless of which one came first, they are strongly correlated and the range of outcomes between the extremes of calculating the affect is as great as the entire difference in heating from greenhouse gas warming as a result of the increase in CO2 from the IPCC using mostly man made causation assumptions to explain all the warming.
Clouds resulting from deep convection as well as the ensuing precipitation limits ocean surface temperature to 30C. This has been observed in scientific literature since 1970.
The earliest observation of this temperature limiting that I have seen was a scientific voyage up the east coast of Australia in 1871 that took hourly bucket samples through the day, 6am to 6pm, and measured the temperature. I compared the measurements with satellite data for up and return voyages with 2019 satellite data – per attached for same time of the year.
The excursion to 32C in the measured record was in the Brisbane River. It is an enclosed body of water where the mid level moisture converges to the land and prevents formation of an LFC above the warm water. It is the reason massive thunderheads form over Brisbane that lead to tennis ball size hail stones.
If climate scientists had access to high vertical resolution atmospheric models, they would understand how deep convection occurs and realise that cloud persistency simply prevents ocean surface exceeding 30C. No matter how much climate prognosticators claim it WILL eventually exceed 30C it simply CANNOT. Simple physics of water in the atmosphere prevents it exceeding 30C once cyclic deep convection sets in.
to Richard Willoughby, aka RickWillMagical belief??? The only magical belief is that there is a set ocean temperature limit of 30C and the role of clouds is to maintain that limit. You got it backwards.
As you well know the Persian Gulf exceeds your magical limit
Indeed as this video clearly argues clouds moderate the earth’s temperature.
Regards cirrus cloud effects you refer to yourself and your article as “proof. I pointed to MIT’s Richard Lindzen’s early work on his controversial “iris effect” and his most recent review article on that dynamic. The iris effect argument is based on evidence that cirrus clouds are more opaque to infrared than to shortwave. Read Lindzen and his references to find the data you are denying
The 30C is a hard limit. It is the nature of deep convection. Show me any open ocean surface that exceeds 30C over an annual cycle?
The reason the Pertsian Gulf exceeds 30C is because the mid level moisture is constant carried south and replaced with dry air from the mountains and desert to the north. This prevents the formation of a level of free convection. Similar situations are observed in less enclosed bodies of water like the Gulf of Carpentaria in Australia where it can get to 31C for a month or more. And do not tell me that it is because the water is shallow – the deep water in the gulf is not warm.
You are simp[ly unwilling to learn and understand. Typical academic who cannot think outside the box that constrains their belief.
All tropical oceans limit to 30C. They have done so for as long as humans have measured ocean temperature and the proxies show the same result apart from periods when the atmospheric pressure was higher than present.
If the ocean surface was internally heated to 32C, there would never be clear skies because the LFC is at freezing level over open ocean water There would be very little sunlight reaching the surface.
The Persian Gulf provides the perfect exception for understanding the process:
Persian Gulf at 35C:
https://earth.nullschool.net/#2021/08/14/2200Z/ocean/primary/waves/overlay=sea_surface_temp/orthographic=-309.52,25.67,1278/loc=50.685,27.423
Mid level moisture 1%:
https://earth.nullschool.net/#2021/08/14/2200Z/wind/isobaric/500hPa/overlay=relative_humidity/orthographic=-309.52,25.67,1278/loc=50.685,27.423
The mid level moisture will be up close to 100% for deep convection to kick in:
Bay of Begall at 30C on the same day as the other two and mid-level moisture at 96%:
https://earth.nullschool.net/#2021/08/14/2200Z/ocean/primary/waves/overlay=sea_surface_temp/orthographic=-309.52,25.67,1278/loc=50.685,27.423
In steady state, the existence of the atmosphere provides a medium in which to receive the latent and sensible heat.
The normal greenhouse effect can be defined as the difference between absorbed solar and the surface flux delivered to the atmosphere.
This value is roughly equal the reflected solar radiation.
Solar absorbed ~240
Surface flux to atmosphere ~340
Normal greenhouse effect ~100
Reflected solar ~100
Incoming solar ~340
Here we have lots of interesting relationships.
From space the planet shows no greenhouse effect at all. The observed all sky upward radiation is equal to the available solar radiation. All we see is avg 240 OLR, which about matches solar absorbed.
To characterize temperatures below the radiating height that we observe (240 W m-2 or ~ 255K), we have tried to use Radiative Convective Equilibrium models RCE.
The surface is thought to be about 288K.
A disadvantage of RCE is that it does not exist on Earth, and so there are no direct observations with which to compare numerical solutions.
To date, the focus has been on radiation aspect.
In meteorology, convection usually refers to fluid motions that transport heat in the vertical direction. This is primarily accomplished through clouds and their associated circulations. So, this is a most critical factor on which to focus.
Conveniently, in diagrams we are given latent and sensible heat flux, which happens to add up to 100. This matches normal greenhouse effect (and reflected solar).
It is conceivable that there is in fact no average radiative exchange between land-ocean surface and atmosphere whatsoever.
Fluid motions of the lower atmosphere are of critical importance. This has been largely neglected in favor of the convenience of radiation observation.
GHE is belief system unrelated to Earth’s energy balance or climate. It can be defined how you choose. It is like GOD – a construct of a belief system with no scientific evidence.
The undeniable fact is that open ocean surface is limited to 30C apart from beef overshoot before the inevitable deep convection sets in. No matter where warm pools occur in open oceans, they limit to 30C.
No climate model exhibits this fundamental constraint. They are all WRONG.
Clouds will always form over open ocean warm pools through the process of deep convection and the cloud persistency will limit the surface to 30C unless the atmospheric mass changes dramatically from that of the present era..
Using this conceptual framework, run the hypothesis:
Decrease reflected solar 1 unit (99);
Conceptually, normal greenhouse effect decreases 1 unit (99).
Counterintuitive?
Latent + sensible heat decreases 1 unit.
1 more unit of solar is absorbed in the system.
The question is, where? Ocean, atmosphere, terrestrial system?
—-
Now, flip it upside down.
Decrease latent heat 1 unit keeping sensible heat fixed (sensible + latent = 99)
Reflected solar diminishes 1 unit (99)
Solar absorbed increases 1 unit (241)
We see there is no need to differential cloud type, only albedo.
—-
The existence of clouds does not change the total radiation budget, they appear to only change the distribution of heat within the system.
Cloud cover radiative effects (shortwave reflected) is exactly matched by turbulent flux (latent + sensible heat in convection).
—-
You could even take it a step further and argue near surface flux with atmosphere is locked to TOA solar 340, before cloud.
Too Strange?
Thus, clouds (condensation) serve to regulate latent heat flux aloft by phase changes of water.
In this view clouds neither warm nor cool, only equilibriate (if you will).
The continuous IR spectral radiation equilibrium extends the depth of the atmosphere.
This, where all atmospheric constituent gases participate (matter).
The critical factor, as you mention, is the triple point of water. Water cycle effects.
—-
Taking it further:
We see the triple point of water is approximately at the center of mass of the fluid system ~ 5000m above the mean equipotential ellipsoid WGS84 accounting for pressure.
Coincidence?
The mean elevation of the Earth’s surface is about 2500m WGS84.
This puts the triple point of water ~ 2500m above the mean surface.
Let’s check:
Lapse rate 6.5K per km to triple point height works out 288K – 273K / 6.5 =~ 2.3km
Pressure correction at center of mass elevation puts triple point ~ 271.5K.
288K – 271.5K ÷ 6.5K/km = 2.5 km
Bingo.
—-
There is a lot of really cool stuff going on that is being missed by optical radiation theory.
Maybe it’s all just a weird coincidence.
The triple point of water, the center of mass temperature, is exactly halfway between 288K surface and 255K OLR.
288 – 271.5 = 16.5.
271.5 – 255 = 16.5.
To clarify the connection to the article, this height (temperature) is right where the critical cloud stuff is happening. 271.5K or ~2.5km height.
The 30C is a hard limit over open ocean surface. It is a cloud phenomena. No ocean surface can exceed 30C over an annual cycle while the atmospheric mass remains similar to the present era.
Everything else related to runaway global warming falls apart if you understand that basic fact.
All climate models have tropical oceans exceeding 30C – it is simply not possible.
Why confuse a storey that is so simple – NO OPEN OCEAN SURFACE CAN EXCEED 30C OVER AN ANNUAL CYCLE!
Take the time to understand convective instability and look at what happens with the LFC as the TPW increases due to rising ocean surface temperature. I have explained it in great detail in this paper:
http://www.bomwatch.com.au/wp-content/uploads/2021/08/Bomwatch-Willoughby-Main-article-FINAL.pdf
To each his own.
That’s right. Only a significant increase in atmospheric mass can raise the ocean surface temperature at the tropics.
Here is the problem.
What you have are two bodies, one hot (the surface) and one cold (the greenhouse effect)
Their temperatures are :
Solar absorbed –> 240 –> ~255 K
GHE –> 100 –> ~205 K
You can’t just add the fluxes and say that the surface is now hot enough to radiate 340, it just doesn’t work that way. You need to use the Stephan-Boltzmann Equation for heat transfer to compute the net flux.
F = σ(T(h)^4 – T(c)^4)
F = 5.67×10^-8(255^4 – 205^4) = 5.67×10^-8 (50^4) = 140 W/m^2 net upward
In order for the surface flux to reach 340, the surface would have to reach
278 K.
140 W/m^2 –> ~223 K –> -50 C
What are these temperatures.
205 – 273 = -68 C
223 – 273 = -50 C
240 – 273 = -33 C
255 – 273 = -18 C
278 – 273 = 5 C
288 – 273 = 15 C
I don’t know what those temperatures are. And I don’t know what this 205K value means.
In reality, the atmosphere exists.
Enthalpy flux between surface and atmosphere is by latent and sensible heat. This is not a radiative transport. Factors include turbulent flows, density, temperature gradients, aerodynamic resistance, vapor pressure deficits, conductivity.
People talk glibly on this page about such matters.
If the GHE radiation is 100 W/^m2, that corresponds to a temperature of 205 K or a -68 C. Does anyone ever check these figures to see if the temperatures are reasonable? This would tell you that the radiation reaching the surface is coming from the above temperatures. That’s pretty high in the atmosphere.
People seem to think that you can simply add the two irradiances from the sun and “back” radiation together and end up showing how much hotter the surface will be with “back” radiation. It just doesn’t work that way.
The Stephan-Boltzmann derivation for two bodies at different temperatures tells you how the radiation works between a hot body and cold body.
q = σ[T(hot)^4 – T(cold)^4]
According to the info in your post, the surface radiates 240 W/m^2. That means the surface is at 255 K (-18 C).
Likewise, the GHG’s radiate 100 W/m^2. That means the GHG’s radiate at 205 K (-68 C).
Put that in the equation and the net radiation is 140 W/m^2 upward, i.e., hot to cold.
It is frustrating to see this ongoing misunderstanding of essential principles in the Earth system. You are trying to treat energy balance as if we’re in outer space.
Enthalpy flux in the medium of the atmosphere is represented in units of w m-2. This of course is not an instantaneous radiative flux, despite using the same units of flux density. It is a turbulent heat transport.
The energy balance then becomes about the efficiency of global circulation, enthalpy vs entropy. People shy away from this so I don’t want to get into it to confuse matters.
Simply put: The enthalpy flux provided, ~100 w m-2, includes evaporative fluxes of water vapor in addition to sensible heat. The transport and interaction of the three phases of water in the atmosphere (system efficiency) is accounted for in that value.
You speak of a radiative greenhouse effect. I am speaking of a non radiative greenhouse enhancement. This, due to the existence of the atmosphere.
Temperature depends on net solar and enthalpy (latent and sensible heat). Radiative cooling is a function of the temperature.
Your cold side is space, the hot side is the surface. What we’re interested in is the fluid system in between. This requires hypotheses of diffusivity to honor thermodynamics in the open fluid system.
No matter how hard you try, or how much you want to believe, Stephan-Boltzmann does not provide this. MODTRAN will not provide this. Optical radiation sensors will not provide this. There is a whole area of physics for material systems which you have completely overlooked.
You can only observe temperatures with IR sensors, not the underlying mechanisms. People try to force the mechanisms into radiation theory to suit their subjective and incomplete understanding, but this is an error.
I should add further that this isn’t even controversial. It is an essential part of Radiative Convective Equilibrium concepts and CMIP models. However, because the moist convection is not directly observable people act like it doesn’t exist. What’s more, the critical factors of moist convection are all parameterized – there is yet very little understanding of these processes; and they are not yet computable at the scales necessary for climate study. This is where the skeptic arguments should be coming from, but 99% on this site have been sucked into boring old radiation schemes blissfully unaware of their huge gaps in understanding. Instantaneous radiation budgets. Lulled by easy data access to IR sensors and impressive images from satellite. The parameterized models don’t know how moist convection responds to a radiation perturbation if one exists. This is the way the consensus crowd would prefer that we argue, I suspect. They would be hardly motivated to point out where the arguments should be coming from.
I didn’t address conduction/convection because the radiation diagram does not either. If you are going to throw radiation fluxes around, then you must do so using temperatures.
And, yes, there are numerous other factors involved in radiation such as absorptivity/emissivity, areas of visibility, gradients rather than averages, T^4 constantly varying as the sun earth rotates, on and on. But, if you are going to use averages, then get them right. If a body radiates 100 w/m^2, then it has a given temperature also.
I don’t care how the energy got there, conduction, convection, or radiation, it only radiates based upon its temperature and its emissivity.
In a steady state thermodynamic system composed of ideal gases, the internal energy of a gas is the sum of the kinetic energies of the particles in the gas.
The internal energy is directly proportional to the temperature of the gas. Temperature is a state function. It depends only on the state of the system at any moment in time, not the path used to get to that state.
The paths are a matter of conjecture. It is at the heart of climate debate.
Near the surface, IR sensors observe about 340 W m-2 heat flux. This is represented in the Stephens 2012 diagram provided by Steele as 345.6 +/- 9.
Some people mistake this to imply only radiative flux paths..
If my proposal is true that continuous IR radiative equilibrium within the atmosphere extends to the surface, then this is an adequate measure of available heat near the surface. This is given by solar absorbed and net flux of sensible and latent heat.
In practical terms, the ultimate point I’m trying to make is that minor changes to temperature near the surface can be accounted for by changes to enthalpy flux of sensible and latent heat. Ongoing desertification of landscapes by human activities changes surface properties, for example, as one hypothesis. Cloud nucleation and precipitation efficiency is another. Solar changes a third. Oceanic circulations a fourth. In all likelihood, it’s an interrelated combo. The exclusive focus on IR optical properties has been an error of communication by the climate community (or on purpose). It could be a consequence of handing over the discipline to remote sensing specialists during the 1980s excitement with satellites. This is about when we all got sucked into thinking exclusively in terms of radiation flux, and turned away from the thermodynamics of material systems towards ignorance.
Further still, the clues are all in the data. Warming at night, cooling aloft. This suggests changes to turbulent flux. Specifically, the ratio of sensible to latent heat known as the Bowen Ratio. During the day, total turbulent flux is directed upwards; at night, turbulent flux is directed downwards.
Latent heat is the primary flux transmittance agent aloft to the free atmosphere under sun. Reducing this by any means leaves more enthalpy circulating in the boundary layer. Near the surface, this is best observed at night using a thermometer. Near surface daytime high temps remain about the same, night temperatures increase.
Bowen ratio is primary influenced by surface moisture availability and cloud condensation, holding density and turbulent flows constant. Conversely, a change to turbulent flows and vapor pressure deficits would have a similar effect. This, due to the global circulation pressure dynamics discussed by Steele in previous videos.
Assuming LW radiative equilibrium within the atmosphere, i.e. observed available radiation pressure around 340 near the surface using IR sensors as a consequence of all thermodynamic process, the only degree of freedom within the atmosphere is the ratio of solar input and total turbulent flux delivery aloft.
Total turbulent flux is free to vary, certainly within bounds of a few W m-2. I am under the impression that radiation theorists are not equipped to understand this.
Yes, La Niña in the summer season causes the same circulation in the North Pacific and North Atlantic (in the winter the influence on the circulation is taken over by the stratospheric polar vortex pattern, whose influence ends in May).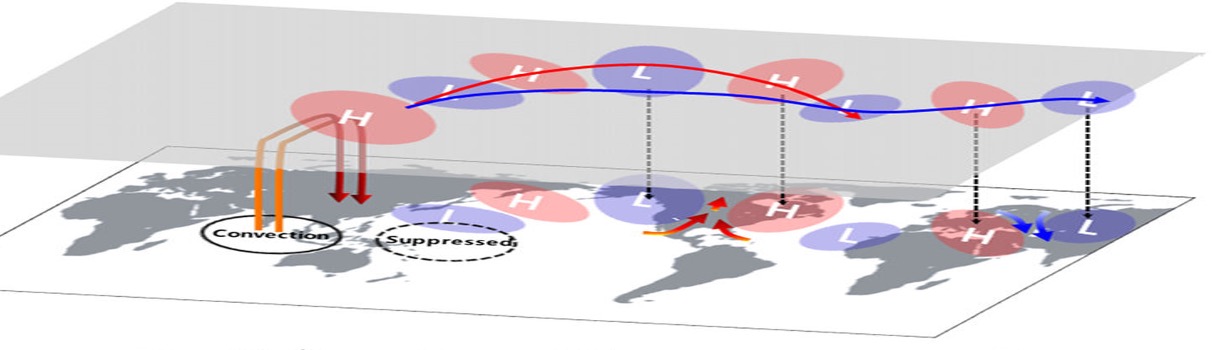

Therefore, the remnants of storm Alex will reach Europe, where the “rainy season” associated with La Niña has begun.
Thanks for all the illustrations which makes it easier for non technical people.
I hope Jim Steele will be able to explain what may happen if the average temperature increases say by 4°C and how this may produce more benefits than adverse conditions.
Plants in colder areas will benefit from the warmer weather but will warmer mean more rain in some drier areas (with more cloud)? Could this benefit large desert areas?
If it is warmer this surely does not mean it will uniformly increase across the globe so where are the areas most likely to have higher temperatures? Will this mean larger temperature gradients between areas and how is this likely to impact on cloud formation and rainfall?
Do we know enough about natural mechanisms to speak with some confidence about expectations?
I suspect the overweening confidence of climate alarmists in their certainty of a catastrophe following higher temperatures is a confidence without scientific foundation ignoring the complexities of weather and climate.
Great explanation, thank you.
One aspect of clouds that I haven’t seen referred is their different impact between day and night. Day clouds cooling effect is much talked about. But night clouds not. They warm as they trap infrared radiation from the surface. Is there any way of looking at day/ night balance?
That is what Wild and others have done. They have measured the daytime effect as reducing irradiance by 54w/m2, This effect can only happen when the sun is shining. They estimate longwave warming of 28 leading to a net cooling effect . The 28 w/m2 warming would happen over 24 hours but increase as the surface warmed and decrease as it cooled.
“What confuses most people is why isn’t the earth cooling if the surface absorbs about 160 watts of solar energy, but then releases more than twice that energy away as infrared?
The confusion arises due to the greenhouse effect. Primarily water vapor and clouds, plus carbon dioxide and other minor greenhouse gases readily absorb most infrared energy. But in less than a microsecond, greenhouse gases immediately lose that energy either via a collision with O2 and N2, or emit that energy, with half that energy being directed back towards the surface and recycled.”
The problem with this statement is that 160 watts (4×160=640) is absorbed and released. The reason satellites read twice the amount is because earth already emits a low w/o sunlight 160w (-40°C average Antarctic winter mean) (320-16 0) so adding the 160 watts you get 320 watts emitted. The next paragraph is wrong, enthalpy of water means sum of internal energy. And enthalpy change can be negative or positive. Example a desert at 5cm can heat to 51C while ocean heat to 29C, enthalpy change of water (moist air) has increased by removing 155 watts from the desert (dry air). Another example. CET winter max is 6c while Russia winter max is -35C. Russia is colder due to dry cold air while an island has moist air with increased enthalpy change. Water absorbs heat from the sun and the surface. Not most infrared radiation emitted. Carbon dioxide absorbs select bands of infrared radiation of which neither come habitable parts of the earth. O2 and O2 have 200 watts of heat to the planet.
1.4*1.26kg*(332)^2=198,567 / 1004 per watt. Where clouds reach stratosphere heat is removed lowering surrounded temperature. Lowering the recycled infrared radiation to the surface. Average 105 watts.
“As climate scientist Kevin Trenberth explained in 2009, “Global warming is mainly caused from increases in absorbed solar radiation due to decreasing cloud cover.”” [my bold]
Statements like Trenberth’s are simply hand-waving exercises. If he were right cloud cover would’ve been even higher earlier in the century, but where is the evidence? Does Trenberth have cloud data going back to 1900 so he can make this claim for the whole period of global warming since the 1930s, not just since the 1980s? The answer is no he doesn’t.
This begs the question “What makes the clouds increase or decrease?”
Are clouds truly an independent variable as treated in this article/video? No.
The entire idea that a more cloudless La Nina allows for more absorbed solar energy in the ocean that then warms it is easily refuted by the fact that in spite of the persistent La Nina, ocean temperatures thus far haven’t increased overall due under the state of relative cloudlessness; they’ve stagnated. Thus a major premise for this video and article is falsified.
If a state of cloudlessness can cause global warming (of the ocean) then it should have happened and been very noticeable by now. The very recent upticks in global SST and Nino34 were solely due to the recently high SC25 solar activity. The major 1983 El Nino, also a reaction to strong SC21 solar activity, provided the 1980s cloud spike.
The global SST has been relatively flat around 0.2C for the past 3-4 years, even with the La Nina, so there you have it, no ocean warming under more cloudless conditions.
Finally, a point of agreement, the 2021 Pacific heatwave was caused by extreme sunshine:
Bob says “If a state of cloudlessness can cause global warming (of the ocean) then it should have happened and been very noticeable by now. “
You are totally ignoring the supporting evidence provided in the video. That La Nina conditions reduce clouds in the eastern Pacific, the region where the greatest flux of heat enters the ocean. The FTR coral temperatures also record how LA Nina/negative PDO is associated with increased ocean content.
And regards Trenberth, the sole reason for using his paper was to raise the point that one of the biggest advocates of CO2 global warming actually had a more natural explanation involving clouds and the sun. I dont intend to defend Trenberth at all, as he is quite slippery with his claims.
But the video does not rest on your claim of handwaving. What is mere handwaving is your claim that you have falsified the La Nina warming effect.
I provided more detail to this effect in part 3 of how La Nina warms the oceans
La Niña is certainly not over, as seen by the cold Peruvian Current, which will carry another wave of cold water into the central Pacific.
Low solar activity means weak La Niña and little heat accumulated in the western Pacific.

Where did the heat escape from the western Pacific Ocean? Or to the poles?
I agree that as solar irradiance wanes La Nina/neutral and warming weakens. The LIA had low irradiance and El Nino-like conditions, meaning a reduced east west temperature gradient ( or perhaps weak La Nina)
The question of where did the heat go only partially examines the dynamics causing a cooler eastern Pacific. Some of the cooling is due to a shallower eastern thermocline and increased upwelling of colder waters.
During La Niña, atmospheric circulation and ocean currents reinforce each other. During the winter season, the meridional jet current can inhibit the atmospheric circulation during periods of weak solar wind. Nothing is static, as many would like to think.
https://earth.nullschool.net/#2022/06/09/0300Z/wind/isobaric/250hPa/orthographic=-148.20,-15.17,354
Dr. Steele says:”… CO2 can only contribute much smaller amounts of heat…”
Attached is a table of specific heats for various gases from a thermodynamics book. In the dry air and CO2 tables there is only one value per temperature. If IR caused CO2 to increase the heat (raise the temperature) of masses of those two gases then there would need to be at least one more column. One column for when IR is present one for when absent.
There was no mention of that capability when I checked the NIST data sheet for CO2.
You misunderstand the argument. The specific heat of CO2 is not involved or considered. It is the recycling of infrared energy back tp the surface that slows surface cooling.
Back in the early 80’s I read a science paper that hypothesized (based on lab experiments and…. well… SCIENCE) that because of the volume of water covering the earth, as temperature increases, there is a natural cooling point at 89F….. supposedly evaporation balances with condensation at that point, and you’d get advection for the first couple miles or so, blocking solar and doing all sorts of cool (heh. get it?) things to the global environment.
Mabes….?
I would not state the issue that way, but I see some possible connections, except, I do believe at all that 89F is a natural cooling point. Deserts average 100F max temp. However the low and high pressure wave trains mentioned would be regions of high pressure and solar heating contributing to evaporation and hot temperatures and lows where convection promotes condensation, more clouds and cooler surface temperatures.
It is only correct to a point – it only occurs over open ocean surfaces and it is due to cyclic deep convection that kicks in when the ocean surface reaches 28C where TPW is 45mm. It is not a linear change, rather a sharp transition once deep convection kicks in and surface energy uptake rapidly declines.
The actual energy balance occurs at 30C (86C). No ocean surface can sustain higher than 30C over an annual cycle. This has been observed in the scientific literature for decades and remains so today.
“with half that energy being directed back towards the surface and recycled. “
Need some clarification here. Yes the energy is directed toward the surface. Does it ever actually get there?
CO2 has a density gradient. There is more CO2 at the bottom of the atmosphere than at the top so the bottom layer should be the biggest contributor to absorption and to emission of IR.
So is it the CO2 and water vapor near the earth’s surface that is actually warming and cooling from IR (be it forward or backward) or is it the actual surface of the earth?
It would seem reasonable that the CO2 (and water vapor) would see more heat escaping upwards into the decreasing part of the gradient than it would see actually getting to the earths surface because that is the increasing part of the gradient and would see more absorption.
That’s why so many of these energy budgets seem rather vague, at least to me.
We live on the surface of the earth, not floating up in the atmosphere. What is *really* happening on the surface of the earth?
“is it the CO2 and water vapor near the earth’s surface that is actually warming and cooling from IR (be it forward or backward) or is it the actual surface of the earth?”
It is both. Several studies in Antarctica find the greenhouse gases in the atmosphere shed more heat than the surface simply because the surface is so much colder.
Also consider inversion layers. The surface, acting as a black body, can cool faster than the atmosphere via the atmospheric window where it can shed 10 to 30% of its heat that greenhouse gases can not. Thus the atmosphere is warmer above
Farmers intent on avoiding damaging freezing, install wind fans to draw that warmer air down to the surface. So air warmed by IR also warms the surface via condiuction.
You have to think in terms of flux and not just temperature. If the surface is receiving IR from the atmosphere but shedding more via the atmospheric window, the surface would be cooling despite the warming effects of greenhouse gases.
“Farmers intent on avoiding damaging freezing, install wind fans to draw that warmer air down to the surface. So air warmed by IR also warms the surface via condiuction.”
That’s kind of my point. The atmosphere warms more than the earth because of CO2 absorption. The two most common materials on the earth, at least that I can find, is silicon (sand) and gypsum. Neither have an absorption window at CO2 frequency so its not obvious how “back radiation” can warm them. There is a lot of surface material that does absorb back radiation but much of it exists in urban areas which are not ubiquitous.
If the CAGW folks were really worried about the surface (where we actually live) they would be tracking subsoil temperatures and not atmospheric temperatures, at least in my opinion.
We all add water vapor to the atmosphere every time we exhale. And don’t the cooling towers at coal-fired power stations add water vapor? What else can we do to increase clouds? Water sprays? Boil water?
Maybe this is too simple but heat can escape by energy moving from a less humid to drier region. But with clouds the sun can’t go around the cloud. So in simple way I think clouds have a cooling effect.
The easterly circulation along the equator in the Pacific will strengthen in mid-June as the polar vortex in the lower stratosphere in the southern hemisphere strengthens. As the solar cycle develops, the stratospheric polar vortex may be strong during winter in the southern hemisphere.
https://earth.nullschool.net/#2022/06/13/1900Z/wind/isobaric/70hPa/orthographic=-128.16,-10.00,281
Currently no spots in the northern solar hemisphere, weak spots in the southern.
Warmer sea surface temperatures reduce low cloud cover, apart from over the central tropics and over the Arctic Ocean where cloud cover increases with warmer SST’s. The global decline in low cloud cover is coincident with the AMO warming since 1995, and has allowed an increase in upper ocean heat content. The warm AMO is in response to weaker indirect solar forcing since 1995, via negative NAO conditions. So the decline in low cloud cover self amplifies the negative feedback effect of the AMO to the decline in the solar wind strength, It’s a very elegant design.
Low cloud blocks the most sunlight but also warms the surface most at night. Though I don’t think that cloud tops reflect the solar near infrared to well.
The less clouds you have, the more warming you get. The more warming you get, the more cloud cover you have because of increased evaporation. A beautiful self-regulating system.
Does anyone ever REFERENCE their work anymore?? I’d really like to see the “2014 paper” and the “2022” paper! Kinda hard to fight the good fight if the author is not going to give up the references regarding clouds.
To the Author … let me be more direct. What are these references. I can’t argue on your behalf with other regarding your point if I can’t provide the references.