Dr. Susan Crockford
The average sea ice cover at the end of March is the metric used to compare ‘winter’ ice to previous years or decades, not the single-day date of ‘most’ ice. This year, March ended with 14.6 mkm2 of sea ice, most of which (but not all) is critical polar bear habitat. Ice charts showing this are below.

But note that ice over Hudson Bay, which is an almost-enclosed sea used by thousands of polar bears at this time of year, tends to continue to thicken from March into May: these two charts for 2020 show medium green becoming dark green, indicating ice >1.2 m thick, even as some areas of open water appear.


Sea ice coverage at March 31 2022
Ice extent, via NSIDC

2022 compared to previous years, below:

To keep the above graph in perspective (which because of the scale looks like a huge decline), see the graph below showing extent for March vs. September to 2021

Ice concentration (>50%), via University Bremen

Canadian sea ice extent and thickness, via CIS
Overall

Western Canada, glossary for ice colour codes here

Hudson Bay

Eastern Canada

East Coast

Chukchi/Bering Sea, via Alaska Sea Ice Program


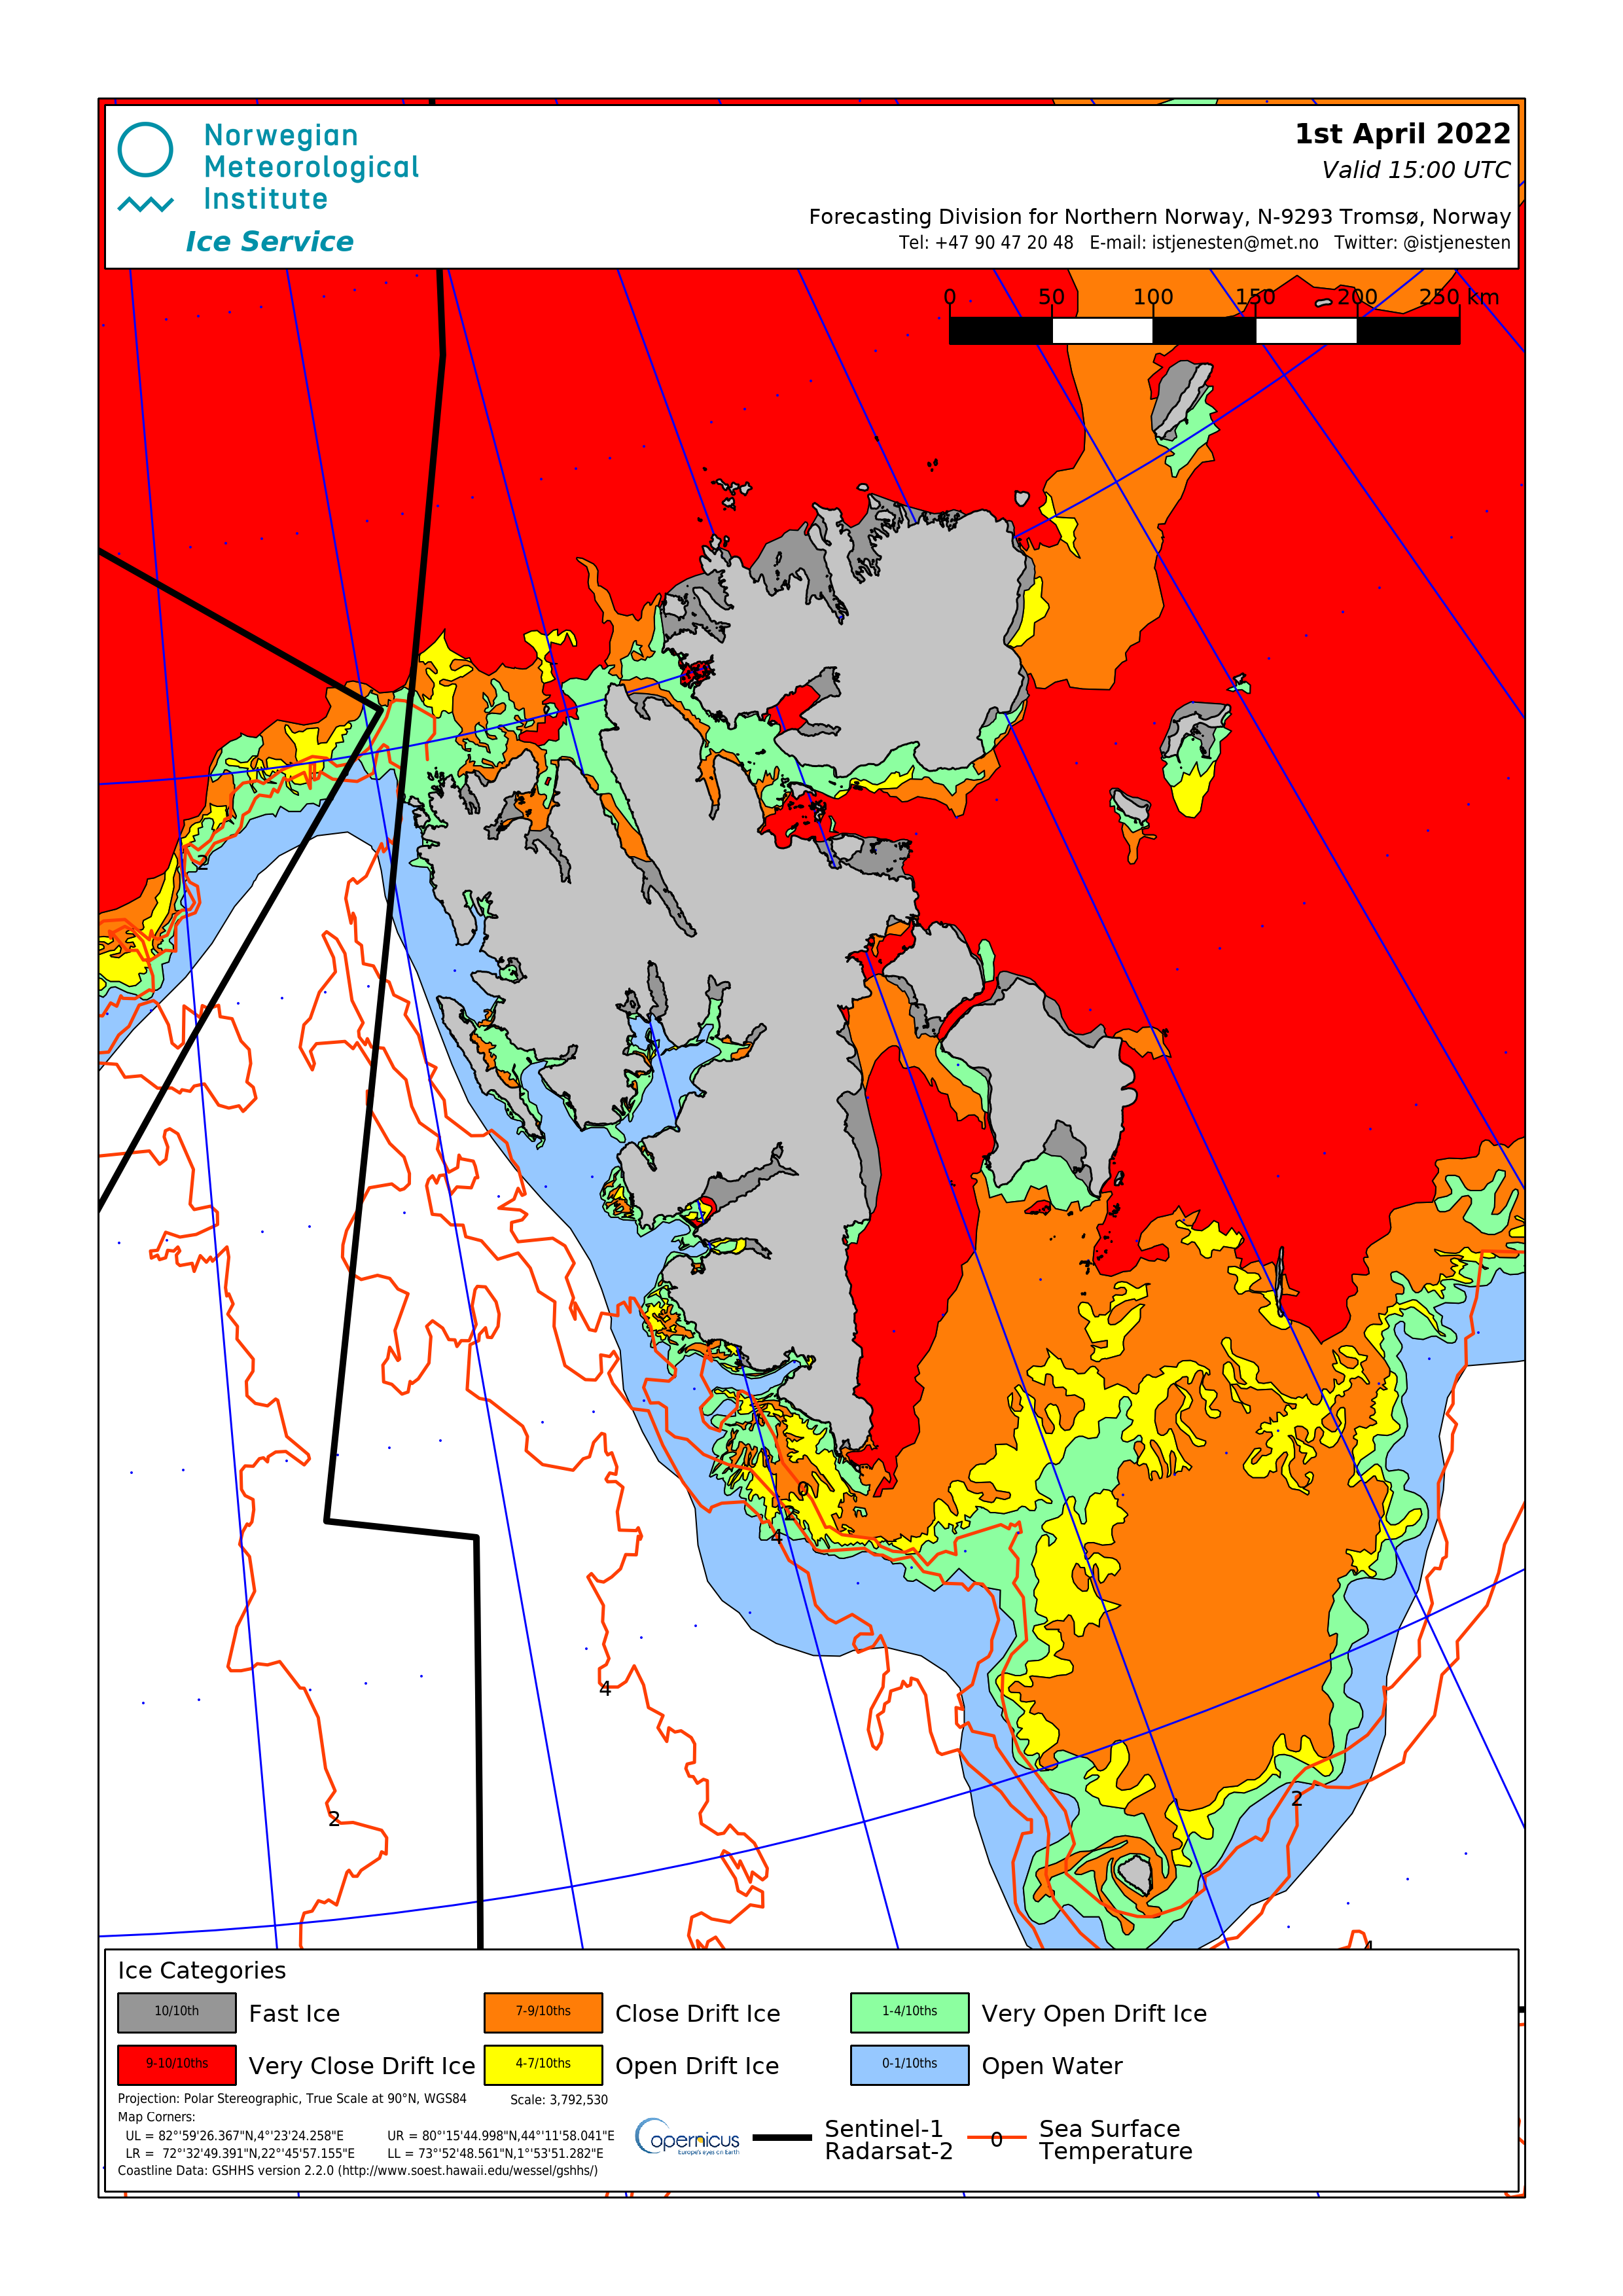
Barents/Greenland/Kara Seas, via Norwegian Ice Service

Svalbard closeup
Southern Greenland/Davis Strait closeup, via NSIDC

Overall, nothing spectacular in terms of change compared to last few years: still lots of ice for polar bears to hunt upon for newborn seals, which they will be doing now in almost all regions.

It barely fills that hole. How can it be a seal?
This is how both Ford and GM build things these days.
Looks like an oil seal.
Good one. Some things never change.
Blown, obviously.
Reminds me of a story, if I may.
A middle aged woman was driving alone through northern Alaska when her car started to overheat. She was lucky to make it to a small town that had a mechanic. She pulled in and told the mechanic the problem. He said he was just finishing up a job and would get to her car in about an hour or so. He directed her to the local restaurant for lunch. Some time later, after her lunch, she went back to the garage and asked if the mechanic had found the problem. He said. “Lady. it looks like you’ve blown a seal.” She replied wiping her lip, “Oh no, that’s just a little mayonnaise.”
This is what I come here for HARD science and a sense of humour!
James Bull
Arctic sea ice extent yesterday was higher than for the past seven years on that date, ie above 2021, 2020, 2019, 2018, 2017, 2016 and 2015. A bit below 2014.
https://nsidc.org/arcticseaicenews/charctic-interactive-sea-ice-graph/
The summer low record of 2012 still stands, and is unlikely to be broken in this decade. The trend is up, as per natural cycles.
And of those years, 2021 was closest to 2022. The trend is not the Warmunistas’ friend.
” The summer low record of 2012 still stands… ”
Indeed, it does:
But… who looks at 2012 in September should look at 2012 in March as well:
Maybe you want to see how 2012 behaved in the Antarctic? I can show that later on in a subsequent post if you want.
*
If you think I belong to the Warmunistas: why should I not think you belong to the… Coolunistas? We all have our point of view.
*
By the way, it is always good to look not only at absolute values, but to look at departures from a common mean, here that of 1981-2010:
As you can see, there has been, in 2019/2020, a shift of minimal departures which led them bypass 2012 (but only in the daily data).
2021 (the red plot) was a completely different year.
Thus before telling us about a trend based on the last two years only, I would await next October to obtain confirmation.
Source
https://masie_web.apps.nsidc.org/pub/DATASETS/NOAA/G02135/
The seasons have been see-sawing since the beginning of this year. It felt like spring back in January then the freeze set back in. Now this is the third such switch back to freezing at night after an initial warming that saw 80+ F in the day and almost 50 F at night.. This is an unusual weather pattern. … https://www.weatherbug.com/weather-forecast/10-day-weather/
But not unprecedented. There was a similar see-sawing in 2019 (albeit with slightly fewer swings) with an early warm spell followed by a colder spell and then shorter duration swings between warm and cold spells. I believe it is commonly referred to as ‘unsettled’ weather – much like ‘the science’.
One thing never mentioned is that summer storms with westerly winds can
blow a lot of ice out of the gap in the N Atlantic. AFAIK, these storms are not
temperature dependent. Thus, sea ice levels may not reflect what the
temperature is doing. Keeping that fact hidden helps the Team™ promote
the CAGW hoax as they can’t afford to discuss the underlying science.
So, climate change means fatter bears, but [catastrophic] [anthropogenic] climate cooling…. warming…. change means more seals. Choices.
The Arctic Sea Ice level is almost as over hyped as are extreme weather
events. Polar bears had low/no Arctic Ice levels in the Eemian & as Yogi
used to say, “they were smarter than the average bear” & knew where to
find the baby seals. The reality is that most of their feeding on them lasts
until late June, long before sea ice levels bottom out in September.
Yes, I questioned, in my mind, the use of “critical polar bear habitat” in the article.
Polar Bears have survived for a long time under various environmental conditions.
Might have missed this before and bear experts probably know about it, but thought it interesting about bears in thin ice. Gormezano, L. J. et al., 2016. Costs of locomotion in polar bears: when do the costs outweigh the benefits of chasing down terrestrial prey? Conservation Physiology, Volume 4, Issue 1, 2016, cow045. https://doi.org/10.1093/conphys/cow045
“In general, the thermoregulatory costs of exercise for polar bears can be somewhat dissipated by certain behaviours, but these costs probably often constrain the duration and speed of a wild goose chase, especially during warm summer days. ”
Polar bears chase geese? Who knew? We should keep a few bears in major airport perimeters to avert bird strikes like Sully’s Hudson miracle.
To keep the bears cool in summer they should be provided with ice filled swimming pools and sun loungers so that travellers could watch them before flights or geese emergencies are called. Much better than having to sit listening to piped ersatz music.
Google “Wild Goose Chase” – unless you were trying to be funny…
To get a true picture shouldn’t the Y axis in the March Average Monthly Arctic Sea Ice Extent chart start at Zero? Much less scary. A straight line of where it’s going isn’t a best fit either.
As of March 29, the Kara Sea is completely covered with ice again.


There is still a large area of ice in the Bering Sea.
Total sea ice in April 2022 in the north is melting slowly.
The ice extent in the Barents Sea has increased since late March.

The ice is growing due to the circulation of the polar vortex in the lower stratosphere and will continue to grow.
For the same reason, very low temperatures will be in April in western Europe.
I’ve started looking at the PIOMAS monthly updates for modeled Arctic ice volume.
http://psc.apl.uw.edu/research/projects/arctic-sea-ice-volume-anomaly/
“The March time series (Fig 8) for both data sets have no apparent trend over the past 11 years.” [“Both” means CryoSat-AWI and PIOMAS]
If there were a continuing trend, I might be interested in cause and effect. If not, we’re good, right?
If the ice remaining on Hudson Bay after the melting season starts accumulating year after year…that means cooling trend. In other news, NASA is sending messages to any aliens in the Universe describing earth’s location and people….clearly, NASA needs a budget cut….a big cut.
Well yes – but then all of the lowest ice figures have been within the last 20 years…
How do you know that?
griff may be using seances to obtain the “data” he uses for the last million years or so in order to make such a statement.
That is, I’m not aware that there is any paleoclimatology proxy that correlates with Arctic sea ice coverage . . . excluding, of course, periods between Ice Ages (aka “hothouse Earth” conditions).
But then again, we entered the current, on-going Ice Age, the Quaternary, some 2.6 million years ago.
When it comes to sea ice, I don’t think it makes sense to continually, exclusively focus on the Arctic. It is better to look at sea ice globally:
And here we can see a sorted annual list of what it looked like in recent years:
81-10: 23.27 Mkm²
2015: 23.03
2012: 22.42
2021: 22.07
2020: 21.70
17-21: 21.45
2016: 21.45
2018: 21.36
2017: 21.14
2019: 21.01
*
For some, it might look strange that 2012 showed such a high global sea ice extent. This is due to the fact that in the Antarctic, 2012 was higher than the 1981-2010 mean all over the year:
*
Should 2022 keep above the mean of 2017-2021 till end of year, as did 2020 and 2021, then we will be more sure that there is a global sea ice upward trend.
Source
https://masie_web.apps.nsidc.org/pub/DATASETS/NOAA/G02135/
But, but, but . . . but . . . climate change™!
Rapidly declining Arctic sea ice; Great news for China and Russia!
(Russia has >50 ice breakers, the USA has two (Coast Guard, one small, one large))
Of course I am ignoring the cherry picking (Hudson Bay, etc.).
for an unbiased view of sea ice see:
https://nsidc.org/arcticseaicenews/
And how does Arctic ice respond to CO2?
Meanwhile in France… recent frosts are almost widespread and with a national average of -1.5 ° C, night time temperatures are the coldest observed in April since the beginning of this type of measure in 1947.
… just saying