Guest Post by Willis Eschenbach [see update at end]
Over at the marvelous KNMI website, home of all kinds of climate data, they’re just finishing their transfer to a new server. I noticed that they’ve completed the migration of the Climate Model Intercomparison Project 6 (CMIP6) data to the new server, so I downloaded all of the model runs.
I thought I’d take a look at the future scenario that has the smallest increase in CO2 emissions. This is the “SSP126” scenario. KNMI has a total of 222 model runs using the SSP126 scenario. Figure 1 shows the raw model runs with the actual temperatures.

Figure 1. Raw results, 222 model runs, CMIP6 models, SSP126 scenario
So here, we have the first problem. The various models can’t even decide how warm the historical period was. Modeled 1850-1900 mean temperatures range all the way from twelve and a half degrees celsius up to fifteen and a half degrees celsius … hardly encouraging. I mean, given that the models can’t replicate the historical temperature, what chance do they have of projecting the future?
Next, I took an anomaly using the early period 1850-1880 as the anomaly baseline. That gives them all the same starting point, so I could see how they diverged over the 250-year period.

Figure 2. Anomalies, 222 model runs, CMIP6 models, SSP126 scenario
This brings up the second problem. As the density of the results on the right side of the graph shows, the models roughly divide into three groups. Why? Who knows. And by the time they’re out to the end of the period, they predict temperature increases from what is called the “pre-industrial” temperature ranging from 1.3°C up to 3.1°C … just which number are we supposed to believe?
Finally, the claim is that we can simply average the various models in the “ensemble” to find the real future temperature. So I compared the average of the 222 models to observations. I used an anomaly period of 1950-1980 so that the results wouldn’t be biased by differences or inaccuracies in the early data. And I used the Berkeley Earth and the HadCRUT surface temperature data. Figure 3 shows that result.

Figure 3. Global surface temperature observations from Berkeley Earth (red) and HadCRUT (blue), along with the average of the 222 climate models.
This brings us to the third and the biggest problem. In only a bit less than a quarter-century, the average of the models is already somewhere around 0.5°C to 0.7°C warmer than the observations … YIKES!
And they’re seriously claiming they can actually use these models to tell us what the surface temperatures will be in the year 2100?
I don’t think so …
I mean seriously, folks, these models are a joke. They are clearly not fit to base trillion-dollar public decisions on. They can’t even replicate the past, and they’re way wrong about the present. Why should anyone trust them about the future?
Here on our forested hillside, rain, beautiful rain, has come just after I finally finished pressure-washing all the walls, including the second story … timing is everything, the rain is rinsing it all down.
My warmest regards to all, and seriously, if you believe these Tinkertoy™ climate models are worth more than a bucket of bovine waste products, you really need to sit the climate debate out …
w.
Update: Rud Istvan, a valued commenter, pointed me to look at the INM climate model since it agrees well with the observations. When I took a look, I found an excellent example of the fact that past performance is no guarantee of future success …

Figure 4. Model runs from two versions of the INM-CM model.
As you can see, they both do an excellent job hindcasting the past, but give totally different versions of the future.
Further Reading: In researching this I came across an excellent open-access study entitled “Robustness of CMIP6 Historical Global Mean Temperature Simulations: Trends, Long-Term Persistence, Autocorrelation, and Distributional Shape“. It’s a very thorough in-depth examination of some of the many problems with the models. TL;DR version: very few of the model results are actually similar to real observational data.
In addition, there’s a good article in Science magazine entitled Earning The Public’s Trust on why people don’t trust science so much these days. Spoiler Alert: climate models get an honorable mention.
As Always: When you comment please quote the exact words that you are discussing. This avoids many of the misunderstandings that plague the intarwebs.
Great post!
Few know how lucky we are to live during a Mild Thaw up out of the coldest era of the past 8,000 years called the Little Ice Agehttps://businessdevelopmentinternational.biz/climate-change/
That graph doesn’t cover the last 150 years!
You’re right. According to the Berkeley Earth plot, current temperatures would be about 1° C higher, just about the same as the spike of the Medieval Warming.
http://berkeleyearth.org/wp-content/uploads/2015/03/land-and-ocean-summary-large.png
Good report, Willis. The Reality Checks are starting to add up, which is against the CAGW claim that “the science is settled”. This calls for an adult beverage.
Ron, I thought you said this calls for an adult average. That too.
In my world of adult beverages there two kinds of models, ones you look at but pretend you don’t, and the others I’m not bothered with because they have no legs to stand on.
Hey, Vuk! As much as I dissemble, my wife knows when I look. She is secretly pleased when I return to look at her.
This calls for adults using torches and pitchforks.
Sadly, the Politics are fixed (or settled, if you prefer).
Only in one party in the US. Unfortunately, it sounds like there are no alternatives in most other countries.
Willis as usual an excellent article. I always convert all data to absolute temperatures, in other words a 1 deg C variation is just over 1%. Just another way of looking at things.
Absolute temperature?
As in Kelvins?
Kelvin uses a scale where 274.15°K units, to which are added Celsius temperatures.
1° divided by 274.15° is 0.3647%. Adding in the daytime maximum temperature range brings 274.15 up to 330.85°K. Reducing each 1°K to 0.30%
If you plan to stick solely with Celsius scale, then that scale must included the entire scale of measured temperatures on Earth.
i.e., Somewhere around -93.2°C low to plus 56.7°C; with a measured Earth range of 150°C. Which makes 1°C divided by 150°C as 0.6667%.
That’s without calculating for pressure and volume
Yes I meant Kelvins. My error to say 1%. Thanks for correcting me.
Best wishes, Gerald
Climate agenda politics is not unlike Putin politics and radical Islam–moderation and introspection are unacceptable endeavors.
They are alike in another way as well…
They’re based on the precept that they shouldn’t be proven wrong but rather should be proven right
Willis included near the end his post: “I mean seriously, folks, these models are a joke.”
Yup. We’ve been pointing that out for many years here at WUWT, yet the politicians and other elites are using them as gospel for their agendas.
BTW, for those who aren’t aware of this, Geert Jan van Oldenburg of KNMI created and maintained the KNMI Climate Explorer. He was very helpful to me for many years when I using the KNMI Climate Explorer for my blog posts that were cross posted here at WUWT. We exchanged plenty of emails. Sadly Geert Jan passed away last year. Rest in Peace, Geert Jan.
Regards,
Bob
Sadly, the Dutch people believe in the KMNI.
You cannot tell them that global warming by man is a myth.
https://breadonthewater.co.za/2022/03/08/who-or-what-turned-up-the-heat/
Sorry Bob
I borrowed a phrase from you. It is only a blog post and I don’t make any money on it. Hope you don’t mind.
They may WISH we believed them, but a running joke is to expand “KNMI” to “Kan Niet Meten Instituut” (Can Not Measure Institute) for the number of times they can’t even predict tomorrow’s weather right!
Bob,
Models a joke? Much worse. As I see it they are part of the greatest “legalized” fraud scheme in the world. Sadly those responsible will be dead and buried when the full impact is felt by their grandchildren – unless their children wake up suddenly and put a spoke in the climate alarmist wheel.
Thanks, Bob, I was unaware that Geert Jan had died, sorry to hear it. But his excellent work lives on.
w.
I did not know that and appreciate being informed. KNMI is indeed a rich source of information. I only contacted Geert twice but he was obliging and informative both times.
And this comparison is for the smallest CO2 increases. If these run high compared to the measured data, can one assume that the high emissions scenarios would run implausibly hot? ( not to mention failing to even come close to actual temperature)
You do not need to to assume; you can make your own assessment.
Any model that shows an increasing SST trend in the Nino34 region over the last 40 years is wrong – they are are all wrong. The actual CO2 in this century is tracking the highest CO2 scenario SSP585.
Any model that has the tropical west Pacific SST (150E to 180E, 5S to 5N) exceeding 30C on an annual basis is wrong – most fail this test.
Any model that does not balance precipitation and evaporation over a period of a few years is wrong – on average all CMIP5 models are wrong on this test but some individual models do balance.
But aren’t HadCRUT and BEST adjusted from measured data. Therefore, they are not data?
Worse still aren’t BEST based on a computer model?
At least according to Mosher.
Quote “in stead we use all raw data. And then we we build a model to predict
the temperature.”
How much would you pay for this used car? 20, 30 50 Trillion dollars?
Yes, very clear.
Perhaps Nick Stokes will have a comment? Be interested to read it.
Because this really raises the same old question: why not pick the model that has most accurately matched current temps given historical data inputs, and go with it? Why keep on using or promoting or publishing ones that are clearly not fit for purpose? Still less averaging them with ones that do seem to be fit for purpose.
And if the reply is, we don’t know, and that fit to present temps is not a valid criterion (which is what I think was said the last time I raised this), then the logical problem is even greater. If the high and the low and points between are all equally plausible, then our ignorance is profound and we have no guides for any policies from these models.
Its like saying Covid could kill 2% of the population or maybe 50%, and either estimate or points between are equally valid. And so we have to do total lockdown for the indefinite future. Just in case.
No, we have to figure out which is the more accurate model as tested against observations, and then use it. Its very inconvenient that its Russian, but some good things have come out of Russia. Tolstoy, for instance… Maybe their model is one of these rare sparks of light in the darkness.
The reason not to pick a single model is political, not scientific. The process of picking one model would cause much debate on how to define the merit of each model. This debate would detract from other climate work. Secondly, the research groups of the models not selected would be likely to loose much of their funding, which would make the debate on how to determine model quality even more fierce.
Why not award future funding based on past performance?
Because you can tweak models to replicate any historical data you choose. Wag that elephant’s trunk, CliSciFi profiteer.
The average of junk is still junk. GIGO
The real question why are any of these models funded? They don’t work.
They don’t work if the goal is accurately predict future climate impacts based on today’s actions. They work great if the goal is gain power today at the expense of being proven wrong in the future.
That is my definition of unethical behavior: Trading a long-term loss for a near-term gain.
See how Leftist politics corrupts CliSciFi (and every other facet of society)?
Plus the teams who built and used the models that were not selected would have their feelings hurt.
Plus, you’d have to do this reasonableness test every time there is a new CMIP, as all the models get changed in between.
If my understanding is correct, the models are tweaked for past climate therefore I’m not sure that’s a good measure of a model’s reliability or accuracy.
But the models should be tested for accuracy. A climate model is a hypothesis. That is, if the climate works the way the model says then the measured climate and the model results will agree. I don’t know of any model that passes this test.
In real science, an hypothesis it tested. If the results aren’t what the hypothesis predicts then the hypothesis is wrong.
I wrote about this here years ago in guest post ‘The trouble with climate models’. The CFL constraint on numerical solutions means that modeling on correct phenomenological scales (2-4km) means they are about seven orders of magnitude computationally intractable. So they have to be parameterized. The parameters are tuned two different ways to best hindcast 30 years. That process drags in the attribution problem between anthropogenic and natural change. A good detailed discussion is in old guest post ‘Why models run hot’.
[Link to Rud’s excellent post is here. w.]
Rud, I added a link to your post. Well done.
w.
Willis,
Rud’s post was excellent, the first line of which is this:
“EPA administrator Pruitt wants to “Red Team” the catastrophic anthropogenic global warming (CAGW) consensus best reflected in the IPCC assessment reports (AR).”
Obviously, the Deep State was concerned enough by this guy that they ran him out of town within 18 months on the basis of allegations, e.g., flying frst class, that would characterize him as a complete amateur by the standards of the Brandon and Clinton families.
It is indeed an excellent post. So what is a valid method of comparing different models?
Or is it really like brokerage performance, that the underlying process is a random walk and so any agreement of any particular forecast with a series of events is just coincidence and so no guide to the future, when it will inevitably be falsified?
Can you run the different models with the same parameters, and if so, do they then differ much?
michel March 16, 2022 10:45 am
We don’t want to do that for the reason that the ads for brokerage houses in the US are required by law to state …
“Past Performance Is No Guarantee Of Future Success”
w.
Do they not look at tree ring data that best matches the thermometer record then reckon that set is the most accurate?
It has been shown that tree ring data does not reflect temperatures. For example, all of the Hockey Stick charts truncate tree ring results at or before 1960. Tree ring “reconstructions” show that temperatures started to decline in the 1960s and continued to decline through the 1980s.
I was having a dig at how it’s logical in one case but not the other.
Is it possible to run the different models with the same parameters and thus see what the differences are between them? What difference there is in their forecasts. Has anyone done this?
Killing 2% of the population would be a monumental disaster.
Observed reality triumphs models 7 days a week:
The below graph shows the average annual incoming sunshine at a number of Swedish cities during a 40-year period. The dotted line shows the average and its progress over the last 40 years. The increase over the 40 years is approx 20 %, linear.
(Source: The National Wheather Service, SMHI)
I bet this curve correlates to a very high extent with the Mauna Loa CO2 curve and the average global temperature curve. Mystery to be solved.
Rossmore, no mystery there: there is some short time correlation between temperature and CO2 rate of change, that is the variability around the CO2 trend of about +/- 1.5 ppmv and both curves go up. The latter is 90% human caused, 10% temperature caused, as the ratio between sea surface temperature and CO2 increase is not more than 12-16 ppmv/K according to Henry’s law. All the rest is human…
If the temperature increase is caused by more solar input or reverse, that still is an open question…
Lol…and the CO2 keeps rising 😉
Reduction in cloud cover at low level – stratocumulus responding to fewer CCNs as fewer breaking waves. Lower albedo of oceans and seas. Both caused by oil/lipid/surfactant pollution, including the feeding of diatoms with agricultural nitrate and dissolved silica. Reduced evaporation.
The effect is seen clearly in Black Sea surface temperature trends and in particular the Sea of Marmara. Baltic. Bits of Med. Red Sea. Lake Michigan.
HTH
JF
The Northern Hemisphere has been getting increasing sunlight for the last 500 years. The increase in the boreal spring is greater than the reduction in the boreal autumn so a net increase. This is the result of orbital precession and will continue for the next 10,000 years.
The actual top of atmosphere sunlight change at 60N is down since 1980 so reducing cloud will be the cause of more surface sunlight. That is a consequence of the reducing net precipitation over the northern land masses during the boreal summer.
You seem to be claiming atmospheric processes affect TOA insolation. Am I missing something? BTW, in case people don’t know, Engelbeen is the best CO2 scientist to lurk around these parts. I’d like to hear a more thorough explanation. –AGF
Nope – perihelion is trending later. It was last before the austral summer solstice over 500 years ago. So the sun’s most intense view is shifting from the Southern Hemisphere toward the Northern Hemisphere. It will reach peak intensity over the NH in about 10,000 years.
The change in ToA sunlight at 60N since 1980 is very small. It would not be the cause of more surface sunlight at 60N. However the net precipitation over the northern land masses has declined during the boreal summer over the last 50 years. However Sweden is one of the few places in Europe where summer precipitation has not declined.
There has been air quality improvements in Sweden that are the likely cause of increased surface sunlight.
Willis,
Fig. 1 appears to have a trace with an average of about 15°C from 1850 to about 1975. It is gone in Fig. 2. Both figures have a triple-trace after about 2000. What happened to the pre-1975 trace?
Thanks, Clyde. One is actual temperatures. The second is anomalies around the 1850-1880 average temperature. Very different things.
w.
I’m afraid I don’t understand why the triple trace shows up in both figures, but the double trace in Fig. 1 disappears. Can you be more explicit than “Very different things.”?
More global warming…
JMA: “WEAKENED JET STREAM LED TO JAPAN’S RECORD COLD AND SNOWY WINTER”; SAUDI ARABIA BREAKS 1985 LOW TEMPERATURE RECORD — YET SCIENTISTS ARE “ALREADY CERTAIN” 2022 WILL BE AMONG TOP 10 HOTTEST YEARS ON RECORD…
March 16, 2022 Cap Allon
JMA: “WEAKENED JET STREAM LED TO JAPAN’S RECORD COLD AND SNOWY WINTER”
This winter was far colder and snowier than usual across the majority of Japan, which, according to the Japan Meteorological Agency (JMA), was due in no small part to “westerly winds snaking in a southward direction, making it easier for cold air to flow into the country”.
The will homogenized temperature record pas and present until they get the answer they want.
That’s why I use UAH satellite temperature data. I trust Roy Spencer and John Christy completely. All the others – not much. I am quite sensitive about this – if anyone slags Spencer or Christy, we’ll go “Hockey Rules”. *
*Hockey Rules”
Ever wonder why Canadians are so polite, and don’t jabber at each other like some other cultures do? It’s because we play by Hockey Rules – if someone is rude, we don’t jabber at them – we just punch them in the face.
“Everyone’s got a plan, until you punch them in the face.” – Mike Tyson 🙂
“Liberty once lost is lost forever. When the People once surrender their share in the Legislature, and their Right of defending the Limitations upon the Government, and of resisting every Encroachment upon them, they can never regain it.”
– John Adams,1775
It can be regained. Unfortunately the process usually involves lots of bloodshed.
Yes. So be it.
.
https://wattsupwiththat.com/2021/07/14/biden-administration-working-to-undermine-america/#comment-3292134
“Never give up! Never give up! Never give up!”
– Sir Winston Churchill
Millions of good men fought and died to preserve your liberty.
Stand your ground against this tyranny.
Stand and fight!
This is THE hill to die on.
Yours aye,
Allan MacRae
____________________________
This story shall the good man teach his son;
And Crispin Crispian shall ne’er go by,
From this day to the ending of the world,
But we in it shall be rememberèd—
We few, we happy few, we band of brothers;
For he to-day that sheds his blood with me
Shall be my brother; be he ne’er so vile,
This day shall gentle his condition;
And gentlemen in England now a-bed
Shall think themselves accurs’d they were not here,
And hold their manhoods cheap whiles any speaks
That fought with us upon Saint Crispin’s day.
– William Shakespeare, Henry V
More accurate to say “climate models aren’t” as they do not model anything at all.
ALL model error bars go from Absolute Zero to Voyager 1.
Actually, its pretty cold on Voyager 1 right now, according to NASA, ” … The spectrometer is likely operating at a temperature somewhat lower than minus 79 degrees Celsius, or minus 110 degrees Fahrenheit, but the temperature detector does not go any lower. …” Other parts of the spacecraft may be warmer if the heater in those parts are still running.
https://scitechdaily.com/nasas-voyager-1-spacecraft-operating-at-coldest-temperature-ever/
Politicians have long maintained that they can predict the future. It has only been recently that they also claim that they can control the weather.
In reality, all politicians can do is to take your earnings and spend them on something for you or someone else, under the threat of force. Whether you think you are getting a good deal or not is where the rubber hits the road. Why anyone thinks you will ever get a good deal from purveyors of fantasy is beyond me. They are either lying or foolish; neither one is a quality that is noted as a hallmark of good leadership.
The purpose of the models is entirely political and they fulfil that purpose admirably.
Well said Uncle. Keep the money flowing’.
The data are obviously skewed. If the lower two traces represent models that are different from the top trace, then there is a strong suggestion that the models creating the two lower traces are more skilled than the one’s producing the top trace.
Models don’t agree with observations? No problem. Change the observations.
As Tony Heller has demonstrated, that’s exactly what has been done. It used to be excused by calling it “data homogenization” but now the correct term is “climate justice”.
Now Dr. Roy, don’t be confusing the good people … you and those dang fact thingies are getting the entire field into trouble.
w.
“Change the observations.”
They have already tried that.
What Willis’s graph call “observations” from Berkley and HadCrut are really a series of very tainted urban readings, fabricated, infilled, adjusted and smeared together in a vain attempt try to keep up with the models.
Their “adjusted” data at individual sites has very little resemblance to any real data.
Berkeley and HadCRUT are science fiction.
Roy Spencer:
[snip Blathering activist crap insults followed by links to activist screeds]
https://www.facingsouth.org/2011/09/climate-science-contrarian-roy-spencers-oil-industry-ties.html
And…
https://grist.org/article/they-blinded-me-with-bad-science/?fbclid=IwAR2bv_CHYbtN89p4LQL7Tg9qQ2Ok32eHv2hCrsDKKv2AnWxwm-la6BCGy3c
And…
https://www.nytimes.com/2005/08/12/science/earth/errors-cited-in-assessing-climate-data.html?fbclid=IwAR19TZgOBJH2_uUQK4hIdaktF70Db1ThGDv0Zb3Pw5vGYVb0BgSBTlepkrI
Roy, if any of these are off-base, just let me know and I’ll happily remove the offending material and apologize for the trouble.
Wow, Barry thinks linking ad hominem articles from 2005, 2008 and 2011 in 2022 is essential current news.
That ought to tell you all you need to know about Barry. Hung by his own petard.
Blown up by his own petard.
A petard is a bomb or a firework. “Hoisted by his own Petard”, is the saying.
BareRant appears to be a brainwashed green who is unable to process any information that counters his climate religion. Just this morning I called him on his lie about grid-scale backup batteries but I have no doubt that he’ll repeat the lie again.
Joe Romm.. one of the biggest losers of the AGW climate scammers. Seriously.. The guy is a nothing-burger. Purely sour grapes from his utter defeat.
Then Revkin.. a scientific non-entity propagandist. Paid journalist hack of the anti-CO2 wind and solar lobby.
You really have to get your hate-mail from people of some consequence.
The sad thing is that Barry has absolutely no idea how badly he has embarrassed himself.
Once upon a time, Barry was quite adamant that only peer reviewed studies from reputable journals were worthy of quoting.
I guess that standard was only for one only fossil fuel shills were required to follow.
For the great Barry, anything he agreed with was good enough.
No matter how wrong or poorly sourced, as long as it supported what Barry was trying to preach, he would cite it.
Yes he started out that he was all about science and then it was shown what he was saying was not the science. Then everything became oil industry shills and now we have the full descent into dribbling rambling rants.
Barry Anthony: as a favor, I served on the Marshall Institute’s board of directors after Tom Clancy served his term. I received no income from that post. I don’t recall even influencing any of the organization’s decisions. It was a surprisingly poorly funded think tank (compared to, say, Heritage Foundation), which was finally dissolved from lack of support. Dont be spreading rumors about things you are not informed about.
[snip: activist lying libelous crap]
I could go on in considerable detail, but, frankly, I highly doubt the admins will let even this much of a reply through unmolested by their redacting.
[yup]
Poor, poor Barry, he just can’t accept that the lies he’s been told to believe aren’t true.
The admins are redacting my posts over and over and you think I’m the one that’s been lied to? Think about that for a minute. Does that sound like something an organization with Truth within their mission statement would do?
Barry Anthony March 16, 2022 6:05 pm
If the posts were as full of vile ad hominems as yours usually are, of course they’d do it. They’d be negligent not to.
Stick to the science, leave the personal attacks 100% out of your posts … you might be surprised.
Or not, since by now you’ve totally poisoned the well.
w.
“Stick to the science, leave the personal attacks 100% out of your posts”
The science doesn’t support Barry’s position and he gets angry when this is pointed out to him.
I think eliminating personal attacks is a “bridge too far” for Barry. Of course, he could prove me wrong by being nice, but I’m not holding my breath waiting for that to happen.
Point out one claim of mine that isn’t backed by references to credible, independent, and peer-reviewed research. I’ll wait.
Meanwhile where is your downloaded effort of the data Willis giving you to see if what he posted is honest and viable, we are watching for you to do it.
If you think Union of Concerned Scientists are credible, independent and peer-reviewed, I feel sorry for who ever claims to have educated you.
If you feel Forbes magazine is credible, independent and peer-reviewed, I feel sorry for who ever gave birth to you.
None of your sources meet up with the criteria you have set up.
We don’t have any problems approving opposite viewpoints from anyone INCLUDING YOU, the problem is your nasty mouth where the first couple sentences to a paragraph and sometimes more sprinkled in the rest of the comment of heavy personal attacks ad homs and more it is too much anger hates and attacking people is why you are getting a lot of moderator attention.
I have sent whole comments to the trash bin because of it which is WHY you are now in Moderation meaning your comments needs Moderator approval before the public sees it.
Stop being so angry then your comments can improve!
Now reduced to whining and crying…
Google…Facebook…Twitter just to name a f e w
Removing insults doesn’t prove that you aren’t quoting lies.
Even you should be able to figure that out.
Your clown act is boring.
And never once questioning the massive funding that these AGW shills get to promote the agenda.
One can support the oil, gas, coal industries that have built and continue to build and support modern society..
Or one can choose to join the parasitic wind and solar brigade, sucking on the tax-payer and destroying western energy security.
We know which one Barry will choose.. always the parasite.
What have you got against science, Barry? What has it done to be treated so badly by you?
It has not bowed down to his superior intellect and wisdom.
This rather reminds me of St. Fauci announcing to Congress … “Hear me and obey; I am science!”
How do so many on the Left become infected with the Dunning Kruger bug?
“his superior intellect and wisdom”
Neither of which exist.
But you will never convince him of that.
Speaking of “adjustments” does anyone know what happened with USCRN.
There seems to be a strange change in the data in the last month or so.
Here is a graph of the old, (blue) v new (red)
And here is a graph of the alterations.
Those adjustments seem to have metronomic regularity. It must be some algorithm applied en banc. It doesn’t seem to be carefully considered on a case-by-case basis at all. And something very funky seems to be going on around 2016.
The “best” measuring systems in the world require adjustments?
I suspect they have found a rouge site and removed it from the whole of the data.
Still, people like Anthony and Roy need to be aware of it and hopefully chase up the reason.
Not sure how best to draw it to there attention.
Moderators ?
How in the world does one get a “rouge site” when each site has triple redundancy?
Not sure, was only a suggestion.
But something “strange” has happened.
That “difference” graph is quite unusual, and I’m struggling to come up with a rational explanation.
Wouldn’t a rouge site just need cosmetic changes?
Not necessarily, depending on aesthetics, but a rogue site would need taming.
Willis-
How much of climate science is held hostage to the fact that we don’t
understand the total effect of clouds that well? AFAIK, there isn’t any plan to
get satellites with 100x-300x better resolution. Also, I read that even if we
got this level of resolution, we wouldn’t have the computing power to run the
models with that many times the extra data. Any comments/solutions/ideas?
Getting a better understanding of clouds would also leave less to argue about
concerning the effect of the sun, too.
Running way too hot in the lowest emission scenario means they are running even hotter in the higher emission scenarios. Scary—NOT!
The only CMIP6 models that seem semi realistic are INM CM4.8 and CM5.0. ECS 1.8 and 1.9 respectively compared to EBM observational ECS~1.7, and NO tropical troposphere hot spot—as proven by a comment reference to Andy May’s recent post here on that topic. We also know the two main INM differences to all the other modeling groups (there are 49 total groups running over 60 ‘different’ models) is higher ocean thermal inertia and more realistic ocean precipitation compared to ARGO (meaning lower water vapor positive feedback). In CMIP5, except for INM the ocean precipitation averaged about twice ARGO observed.
I took a look at the two INM models, and while they track historical temperatures well, I found something quite surprising …
Go figure … if nothing else, this demonstrates that wildly differing models can do a reasonable job of hindcasting similar pasts, but their futures are completely different.
“Physics based models”? Don’t think so …
w.
WE, thanks. I was hoping you might post that before I had to go dig,it out myself. Gracias.
My pleasure, Rud. At this point I’ve written enough functions to do the heavy lifting that it doesn’t take me long to put together a graph.
My best to you and that good lady who is gracious enough to put up with you, as all of our good ladies do,
w.
If they didn’t, we’d all starve to death and never procreate. Be afraid, very afraid.
Rud, I’ve added this to the head post, with a h/t to you. Many thanks.
w.
“I took a look at the two INM models, and while they track historical temperatures well,”
They are not tracking historical temperatures. They are tracking science fiction.
They should try to track the real historical temperatures as represented by this graph.:
I’m with you Tom.
2020 1 degree higher globally than 1950?? BULLSHIT!
Anyone who has seriously looked at the temperature record knows it was just as warm in the Early Twentieth Century as it is today. This means there is no unprecedented warming today and also means CO2 is a minor player in the Earth’s atmosphere, that does not require regulation.
I am at a loss to explain why otherwise intelligent people insist on using a bastardized Hockey Stick temperauture record, that does not represent reality, and was created in a computer, by people who we know were conspiring to change the Earth’s temperature profile into something scary, as a means of promoting the Human-caused Climate Change scam.
And we have good people going right along with the scammers. I don’t understand it. It must be related to “group-think” in some way.
Tom, you must understand the full importance of the old story: A gambler, when asked why he gambled at an obviously crooked dice location, responded “Its the only game in town.” You ain’t gonna change the game no matter how sincere or “right” you are.
The radiosonde and UAH6 atmospheric records from about 1979 forward (additionally with ARGO beginning in the early 20th Century) are putting a lie to the adjusted surface temperature records and the bogus atmospheric temperature record at RSS. That is why CliSciFi is attempting to destroy UAH6. Dirty bastards.
“Tom, you must understand the full importance of the old story: A gambler, when asked why he gambled at an obviously crooked dice location, responded “Its the only game in town.” You ain’t gonna change the game no matter how sincere or “right” you are.”
I think you nailed it, Dave. That’s exactly what is going on.
Unfortunately, that doesn’t help with our search for the truth.
“That is why CliSciFi is attempting to destroy UAH6. Dirty bastards.”
I agree.
Tom Abbot claims:
“Anyone who has seriously looked at the temperature record knows it was just as warm in the Early Twentieth Century as it is today.”
Any farmer or gardener who has been paying careful attention knows that this claim cannot possibly be correct. Last Spring Frosts have been occuring earlier and earlier, First Fall Frosts have been arriving later and later, and Annual Growing Degree Days have been increasing. See the data at research study cited below:
Kukal, M.S., Irmak, S. U.S. Agro-Climate in 20th Century: Growing Degree Days, First and Last Frost, Growing Season Length, and Impacts on Crop Yields. Sci Rep8, 6977 (2018). https://doi.org/10.1038/s41598-018-25212-2
“On average, First Fall Frost has been occurring later (by 5.4 days century−1), and Last Spring Frost has been occurring earlier (by 6.9 days century−1), resulting in the average lengthening of the Climatological Growing Season (by 12.7 days century−1). Annual Growing Degree Days has been increasing by 50 °C century−1.”
The only way that graph can be true is if net forcings in about the 2030s changes drastically between the two different models.
I’d be willing to bet the divergence into three groupings ultimately comes down to ECS assumptions. Top being Hansen, bottom being Manabe and middle being an average of the two.
ECS is an emergent property of models, not an input assumption.
In terms of inputs into the models this is true, but not in terms of tuning the model.
Tim, the tuning is only for hindcasting, to best match historical observations.The CMIP ‘design’ is back 3 decades.
I doubt it. I think if multiple runs following that hindcasting tuning result in too much or too little warming (or indeed the model blowing up) then they’d further tune.
Also its worth clarifying with the point that the tuning isn’t to get the best historical matches, its to get acceptable historical matches whilst not being outrageous (or blowing up) in the future.
That’s easily seen by the raw data that goes all over the shop.
Ouch, again, Rud! Tuning caries forward to the future math of the models.
“best match historical observations”
If they match to Best, HadCrut or Giss.. they are wrong before they even start.
None of these bear much resemblance to any real historic observations.
Ouch, Rud! All the input assumptions lead to an assumed ECS. The modelers say that tuning is done to reach an ECS that “seems about right.”
Rud, are you attempting to parody Gavin Schmidt as sarcasm?
Gavin Schmidt said that ECS is an emergent property of the models. Bullshit; it is programmed into the models, plus manipulated by parameter assumptions targeting a particular ECS. Models that don’t replicate history are, de facto, wrong. Models that simulate history based on adjustment are, de facto, suspect.
After they have populated the fantasy world of model based “science” for 50 years, they’re very familiar with the limited parameters they manipulate … like lab rats. They can provide any result needed to suit whatever narrative is required by their pay masters.
Rory, one may consider the models as black boxes that give a linear relationship between assumed CO2 concentrations and temperatures. Obviously crap, but well-paid crap.
Just so, Dave … and they sound so sciency. They’re so easy to sell to the useful idiots as “data”. They provide graphic representations for logical fallacies, with an easily manipulated set of ‘dials’ for quick adjustment.
Willis Eschenbach, what is the difference between the SS126 and actual emissions?
I believe that historically they use the actual emissions …
w.
‘Actual’ for CO2, but only aerosol guesstimates, which get fiddled historically high to cool hot model hindcasts (cause nobody has real good historical aerosol estimates, cause way complicated—black soot, SOx, natural turpenes, isoprenes, and ocean dimethyl sulfide). Summer Appalachian Great Smokey Mountains national park is ‘smokey’ because of deciduous tree leaf isoprenes reacting with SE US summer high humidity to produce visibly ‘smokey’ aerosols.
In other words, the past is whatever you want it to be in CliSciFi. The future is also whatever you want it to be. The present does not match CliSciFi, therefore it is ignored.
Exactly.
This is modern-day alarmist climate science.
“‘Actual’ for CO2, but only aerosol guesstimates, which get fiddled historically high to cool hot model hindcasts (cause nobody has real good historical aerosol estimates, cause way complicated—black soot, SOx, natural turpenes, isoprenes, and ocean dimethyl sulfide).”
Yes, let’s all keep this in mind when discussing aerosols.
Some people seem so sure of themselves when discussing aerosols, but as Rud points out, nobody has good historical aerosol estimates.
There are too many people making too many guesses about aerosols and presenting them as facts in climate science.
Presenting assumptions and guesses about CO2 and aerosols as facts seems to be standard operating procedure for those who think humans control Earth’s climate.
They have no facts.
I am curious as to why in all the graphs there is a cool down starting about 2075.
Simple. This is the lowest emission scenario, well below business as usual. So assumed strong CO2 mitigation. If things didn’t eventually start to cool down, then CO2 mitigation would be pointless. Alarmists cannot have that result. Nope.
The tax taking operation is completed then.
[snip. You are either willfully misunderstanding, too ignorant, or simply too ideological to understand of what full transparency means.]
Reality check:
https://www.nationalgeographic.com/environment/article/how-climate-models-got-so-accurate-they-earned-a-nobel-prize?fbclid=IwAR0gfeYNX2LdQnc44f271C31ec0mGtNGLa-HvqLJcIVec7SGLeo-bUqa_qk
And…
https://earther.gizmodo.com/exxon-predicted-2019-s-ominous-co2-milestone-in-1982-1834748763
And…
https://www.sciencemag.org/news/2019/12/even-50-year-old-climate-models-correctly-predicted-global-warming
And…
https://journals.ametsoc.org/doi/pdf/10.1175/BAMS-D-14-00154.1
And…
https://www.independent.co.uk/environment/climate-change-computer-model-princeton-stouffer-manabe-vindicated-30-years-global-warming-a7609976.html
If 50 year old climate models correctly predicted global warming, then it cannot be worse than we thought.
You cannot have it both ways.
All Willis did was plot some readily available information about models and observations. There’s no complicated formulas, or adjustments or anything new involved. You have the hard data right here. What you should be doing is posting links to Willis’ post in the comment sections of the links you posted, which clearly refute what the articles say.
Barry, all I do is report the facts. I see that you don’t like the fact that the CMIP6 climate models are running far too hot, a fact which has been reported elsewhere.
But that doesn’t change the facts … and neither do “50-year-old climate models”. I’m talking about the CMIP6 models, the latest models.
And if you claim that my analysis of those models is wrong, you need to DEMONSTRATE that rather than just post random articles from the web. This is why I put up, as is my custom, the link to the data I used.
Download the data, analyze it, and demonstrate where I went wrong, or go bother someone else.
Best regards,
w.
By all means, Willis, please provide all necessary source materials to reproduce your findings. We’ll wait eagerly for your submission.
He has, you mindless slime. This is why you’e being mistreated, or more accurately, appropriately treated.
I gave you the link to the data. I eagerly await your analysis.
w.
Didn’t you read the very first paragraph?
“Over at the marvelous KNMI website, home of all kinds of climate data, they’re just finishing their transfer to a new server. I noticed that they’ve completed the migration of the Climate Model Intercomparison Project 6 (CMIP6) data to the new server, so I downloaded all of the model runs. I thought I’d take a look at the future scenario that has the smallest increase in CO2 emissions. This is the “SSP126” scenario. KNMI has a total of 222 model runs using the SSP126 scenario. Figure 1 shows the raw model runs with the actual temperatures.”
===
It appears neither YOU nor your possible hidden masters can’t do what Willis can do while he is still waiting for the appropriate response to his work he posted here for free.
I predict that you will NEVER do what Willis did because you don’t have the ability to do the work.
In all cases you post a bunch of links that doesn’t address the content of what Willis writes while I have had to moderate some of your ugly attacks that will never see the light of day.
Congratulations on not totally deleting or banning all his posts. Which would be the norm of how dissent is treated on a site such as Ars Technica or the Guardian or Real Climate.
Here you all are going to the trouble of clipping out the abuse and permitting him still to post, and that is one of the things that is admirable about this site.
I agree. The moderators are going out of their way to allow Barry to post his links.
Most places would just delete his whole post on sight.
Why don’t you go back to trolling Willis on FB? Did FB get tired of your bs as well?
It has been TWO days yet NOTHING from you about the KNMI data download Willis used to make his charts how come you didn’t download them and make YOUR case against what Willis wrote?
I think you are blowing white smoke and nothing more.
We’ll wait eagerly or your apology to Willis.
And yet these perfect models still can’t predict the climate.
Didn’t Gavin Schmidt say the models are running way too hot?
As did the UN IPCC CliSciFi AR6, which had to reject the really egregious ones.
4 Eyes,
I believe that Gavin has said RCP 8.5 is “wrong” and I note Dave Fair’s reference to UN IPCC CliSciFi AR6 that the really egregious ones are a dead letter.
The issue was discussed by Gavin on Real Climate on 30 January 2020 under “BAU wow,wow”after Hausfather and Peters posted in Nature,“Emissions- the ‘business as usual’ story is misleading”, 29 January, 2020.
They had said RCP 8.5 had painted ‘a dystopian future’ which was fossil fuel intensive and that RCP 8.5 was intended to explore an unlikely high risk future scenario which had unfortunately been misused by the media(!).
Several discussions by Gavin about AR6 say some models are not consistent with observed data.
For obvious reasons, this is a thorny topic for Schmidt, Mann et al.
This just highlights the political window of opportunity for the Climate Crusades in graphical form.
The ~ 1970 cooling is very evident.
I just can not believe that we know the average temp of the whole earth back before 1960, certainly not back to 1850, no way, imagine how many GOOD data points one would need for that, does not exist.
Oh, by the way, interesting article over at SP!KED about cost of oil –
The runaway cost of virtue-signalling – spiked (spiked-online.com)
Here is a graph showing the percentage of temporal coverage in each grid node for HadCRUT4 from 1850. So its the count of how many monthly slices the grid node has a value present, divided by the total number of years*months.
What is quite clear is that surface observations are only close to continuous in NH Europe and America plus shipping lanes (Atlantic, to some extent trade routes to the Far East). Africa, South America, Indian sub-continent etc and that fairly large ocean called the Pacific have much less than 50% temporal coverage.
Almost all the main surface datasets will be similar I suspect as I am sure they must share the same basic thermometer records.
And this is a graph of the proportion (not percent as in the title) of grid coverage over the globe (number of 5 x 5 degree cells with data) month by month since 1850 for HadCRUT4. Note this is a simple grid cell count, its not area weighted.
So we don’t really get above even 50% grid cell coverage until about 1950 – so your estimate of 1960 was pretty good.
ah, well you see, in the future they’ll have better models!
for a good laugh try adding the UAH lower troposphere record 1979-2022
eyeballing the graph, the satellite-era warming trend of .16 per decade barely gets into the blue and is hilariously uncorrelated to the models
but don’t worry, any minute now half the population of the OECD will suddenly realize they’ve already wasted trillions of dollars and are planning to waste tens of trillions more
“for a good laugh try adding the UAH lower troposphere record 1979-2022”
They should combine Hansen 1999 and the UAH data and see if their models match that combination of data, representing 1880 to the present. This is the real temperature profile of the Earth. Unmodified, written, historical, regional surface temperature records from all over the world resemble the temperature profile of the U.S. regional chart, Hansen 1999, which shows it was just as warm in the Early Twentieth Century as it is today. No unprecedented warming. No need to worry about CO2. That’s what they show.
“I downloaded all of the model runs.”
I doubt it. I believe that only carefully selected model runs make it to CMIP6. Please prove me wrong, or maybe tell me who makes the selection.
Of course it’s not ALL the model runs. Lots of them ended up on the cutting room floor. I meant I downloaded all the listed CMIP6 model runs.
w.
One can only speculate the ratio of attempts to eventual useful product their models must perform … in the 100s or even the 1000s, yet still nothing useful comes from it.
An interesting point. Each model group selects what they chose to submit. That said, there are required submissions in the CMIP6 ‘experimental design’. So they freeze the parameters to best hindcast (a required submission) and then use that one for all the other submissions.
But wait. As I understand it, hindcasting is the same as comparing model output to past data records, but running the model in reverse. So is the data used the original data to the point of exit from the hindcast or is the data one or more of the thousands of adjusted data sets?
I dont think they run them in reverse per se.
They start up the model and let it run until it comes to an equilibrium because GCMs dont do climate change unless they’re explicitly forced. And by “forced” I mean adding forcings such as increasing CO2 levels.
Then they’ll introduce the “known” inputs from the historic period. eg CO2 increases, Aerosol changes which are not really “known” just chosen with post hoc justifications. The “date” will be the date of those prescribed, “known” observations as the model runs.
And they’re run through the past, present and out to the future (eg 2100) and the state of them is periodically sampled for later analysis. The future inputs are all configurable input guesses.
You do not run any sequential model ‘backwards’.
If it was warm today at 20C what was it yesterday and before?
What formula(s) would you use?,
Although many climate models including especially most of the CMIP6 ones have been working poorly, this is not because climate models can’t work. I see the problem being one of a groupthink of ignoring multidecadal oscillations. Most CMIP3, CMIP5 and CMIP6 models were selected and/or tuned for hindcasting, and mostly for hindcasting the 30 years before their hindcast-forecast transitions. During the last 30 years of the hindcasts of the CMIP3, CMIP5 and CMIP6 models, multidecadal oscillations were mostly on an upswing which is ignored in these models, so these models modeled warming caused by multidecadal upswing as being caused instead by positive feedbacks to warming from increase of greenhouse gases. Modeling the water vapor positive feedback as greater than it actually is causes the models to show a great tropical upper troposphere “hotspot of extra warming” while that hardly actually exists, as well as more warming overall after the hindcast-forecast transition dates of these models than has actually been happening.
I thought that models hope to be based on physics. What would be a physical base for multidecadal oscillations? These oscillations should be the output of models, not a built-in feature.
CG, the physics based claim was ALWAYS a canard. To be truly physics based, models have to compute stuff on a sub 4km grid cell (convection cells and Tstorms). Thanks to the CFL numerical solutions to partial differential equations constraint, they cannot—computationally intractable by 6-7 orders of magnitude. So they are forced to parameterize (references to previous posts explaining this above). And parameterization by definition isn’t physics. It’s guesstimates.
But they pay the rent, Rud. The politicians get what they pay for. Anybody that disagrees just doesn’t understand how the world works. The basics of human nature have been known for millennia.
GCMs predictions are based on “physics” in the same sense that an NPC in a Roblox game follows “physics”
not exactly tackling Navier-Stokes head on
as Feynman said, give me three parameters and I’ll give you an elephant, four and I’ll make it wag its tail
The parameterizations would work better if they’re done without ignoring what multidecadal oscillations did in the past while considering what sulfate aerosols, solar irradiance variations and greenhouse gas concentration change did in the past.
They couldn’t predict/project/hindcast/anycast tomorrow’s sunrise …
… the only things they have to calibrate themselves are the Hockey Stick and horribly adjusted temperature data – supposedly correlated/causated with CO2 data
So by time there’s no definitive or quantitative connection between CO2 and temperature (which there never can be) and that they’ve got the source of the CO2 wrong….
….there aren’t words to describe the wrongness
The various models can’t even decide how warm the historical period was.
_____________________________________________________________
From my file of quotes factoids and smart remarks:
Mark Steyn famously said: How are we supposed to have confidence in what
the temperature will be in 2100 when we don’t know it WILL be in 1950!!
Funny, I was just reading something on the movie Back to the Future.
“It turns out director Robert Zemeckis’ fantasy of the future failed to match up to reality. Not only are we deprived of such fanciful gadgets (hover boards and self tying shoelaces) and a Jaws 19 sequel, in this version of 2015 we apparently still read newspapers and have fax machines in every room. Fax machines! No internet. No Twitter. No insufferable influencers.”
Are science fiction stories set in 2022 more dystopian than real 2022? – ABC Everyday https://www.abc.net.au/everyday/what-did-science-fiction-get-right-about-2022/100882010
The future is not the past extrapolated.
There are an infinite number of possible futures. That’s why predicting it is a fools game.
People who claim to be able to predict the future are never seen placing bets at racetracks. That should tell you all you need to know.
He got the Cubs World Series win wrong by only one year, though.
(Their manager, Joe Maddon, was actually shooting for the 2015 win mentioned in the first sequel, for that very purpose!)
Hmmm… The difference in thermal emission (with emissivity at 0.95) at 12.5C is 358.6 W/m2. At 15.5C it is 373.9C. That’s a difference of over 15 W/m2.
But both models are trying to evaluate the effect of a change of less than 2 W/m2 (so far) from increased CO2!
Definitely a major problem …
w.
Very good.
Are the models improving over time (I sure hope so)?
If they are, and if the latest ones diverge ~0.5C from observations over just 25 years, just how bad were the old ones?
Ed Lorenz’ 1963 paper “Deterministic Nonperiodic Flow” says no. The only thing that has improved is the number and amounts of government grants funding computer playtime for academics, who always insist they need more.
As regards the IPCC, do get up climateaudit.org and take a look at Steve McIntyre’s exposure of another disgraceful fraud- the AR6 Summary frontispiece Hockey Stick. Fake. Why do we pay any attention to this self-important puffed up incompetent organization? And don’t forget the two books by Donna Laframboise which authoritavely catalogue multiple dishonesties
As I posted earlier, its the only game in town. Just keep hammering at their lies and the whole edifice will eventually collapse.
Even more crazy than the BS of climate models is the fact that renewable energy has been accepted as the answer. When one says well they are so variable the advocates just say they will be firmed with energy storage. The variability of wind and solar is such that that is not a viable solution. I have the data for this in the Australian context and find as Europe has recently experienced the extent of wind droughts. If you do the sums a 100 MW wind station which has no wind for 30 hours 831 megawatt hours to firm it. That is just not achievable on scale. The advocates also do not seem to be concerned that despite the large amount of work that has been done to reduce emissions it is not detectable in the atmospheric record.
“Even more crazy than the BS of climate models is the fact that renewable energy has been accepted as the answer.”
That is even more crazy.
There are a lot of delusional people running around the world. There are a lot of people taking advantage of those delusional people, too.
“I mean seriously, folks, these models are a joke.”
Great post and I really like your analysis!
If I understood correctly you picked a model ensemble with an unrealistic low CO2 scenario, correct? (If so the discrepancies to the real world are even worse for more realistic scenarios)
Last not least while of course I understand what you are saying, there is really nothing funny at all about this.
Until climate modelers use unadjusted data for benchmarking their models are going to run hot. I wonder if they even know that the data they are using for training the models has an artificially induced correlation with CO2 through the adjustment process. I would like to see what happens if they use the UAH data for training. My guess is that CO2 sensitivity would drop dramatically.
Subtract the mean of the models from the individual model runs and plot the residuals.
If they are like CMIP5 models the residuals will unstructured random noise. See my graph on Andy May’s recent post.
This is because the only information creating structure in the model outputs are the input forcing curves, which are common to all the models. This is the prior for the climate forward modelling. Without it, the models do nothing.
Except add noise.
Here is the graph I mentioned. This is for the 39 core models in CMIP5. I have subtracted the model mean to give the residuals for the 39 models. They are unstructured random noise. I suspect if WE does the same for the models in this post, the residuals will also be unstructured random noise.
Climate models are forward models. They only do what they are told to do by the input priors. Plus they add random noise. The spread of the models represents the lack of understanding of the physics to compute the temperature of the earth from first principles. That spread is greater than the entire C20th warming.
So when you average the models you filter the random part out (stack it out) and end up with just the low frequency. Which can be closely reconstructed simply by linear regression of the input priors – as WE has pointed out in a post at WUWT before.
As far as I can tell, climate models don’t add anything that isn’t already in the priors.
I have wondered what is the source of all the random variation.
Numerical instability?
Pseudo-stochastic parameters?
Epsilon-like round off errors and truncation?
Weird non-linear threshold decisions?
Who knows?
Bizarre random walks?
A modest proposal: Quit paying for all the models with results between +1 and -1; the 6 or 7 remaining, extreme models could then be used as inputs to all the senseless arguments about ECS and CAGW.
Using the SSP126 scenario highlights the poor agreement on the present temperature (a clear fail for consensus science) but reality, in terms of CO2, is closer to SSP585.
Even if Net Zero becomes the global mantra, it will take a massive amount of carbon to build all the energy extractors. In fact, trying to get to Net Zero increases carbon requirement because the low intensity, intermittent energy extractors and associated storage consume more energy than they can produce.
“This brings us to the third and the biggest problem. In only a bit less than a quarter-century, the average of the models is already somewhere around 0.5°C to 0.7°C warmer than the observations”
The problem is that this comparison is between the observed land/ocean and the modelled TAS. The first uses SST (sea temperatures) for the ocean component, and the second models air temperature throughout. It is just an observed fact that SST is warming less rapidly that air temperature.
This is true in the models too. They list a variable TOS, which is the equivalent of SST. Unfortunately, KNMI takes a while to post this variable. But it is available, and it agrees well with observed SST.
The appropriate way to compare, as in Cowtan et al 2015, is to blend TOS for ocean and TAS for land. This emulates the HADCRUT calculation. If you do, as I did here, the results agree much better (GISS is the dark curve):
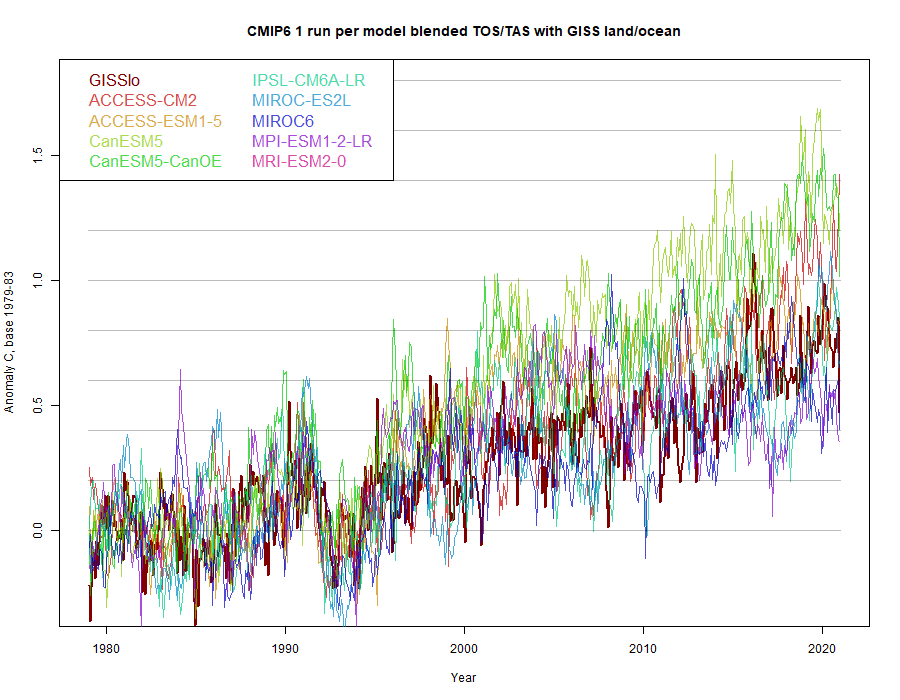
ps this is over all scenarios, not just SSP126.
And, still, the GISS looks nothing like the models after the tuning period. Mash some hot models after the tuning period with some more realistic ones and they might look like the adjusted GISS crap. None of this proves CAGW. Nick is a sophisticated shill.
And Tom Karl used Night Marine Air (NMA) temperatures to adjust SST numbers. Jaysus, Nick, you can’t keep up with the changing dogma.
No, GISS looks very like the models to present, especially if you take out the outlier Canadian model.
Nick, you know damned good and well that the UN IPCC CliSciFi models are a scientific disaster yet you deny the obvious. Please show that, beyond the tuning period, that CMIP models reflect the variations of temperature and rainfall, much less those in the cryosphere. Post 2000 deviations are obvious.
You ignore the fact that Tom Karl used the Night Marine Air Temperatures (NMAT) to adjust SSTs. Subsequent to 2015, NMAT has deviated significantly from SSTs. WTF?
And if you squint real hard, touch your nose with the left index finger, while standing on your right foot, the models will tell you anything you want them to.
What do you people have against actual science?
“GISS looks very like the models to present,”
Its adjusted/manipulated/fabricated to be that way !
And they still miss.
Thanks, Nick. Around which period are the anomalies taken? And why did you start in 1980?
Next, I’m not clear why this should make a difference. The air temperature over the ocean tracks the ocean temperature very closely. Their differences are rarely more than a degree C, and are relatively stable in each location. See my post “TAO Sea and Air Temperature Differences“. That’s why the observational datasets (HadCRUT, Berkeley Earth etc.) are using SSTs as a proxy for air temperature.
This is even more relevant when we consider that we are interested in temperature increases, and when SST increases, TAS increases. Again, this is why they’re used in global observational temperature reconstructions, which consider anomalies rather than raw data.
Best regards,
w.
“Around which period are the anomalies taken? And why did you start in 1980?”
The anomaly base period is 1979-83. I used that, and post-1980, because I was comparing with the results of Roy Spencer, who chose those times.
“Next, I’m not clear why this should make a difference”
Well, indeed they are close, which is the basis for letting the better-measured SST stand in for SAT. But the relevant question here is whether they are different in the models, because if so, TOS for sea is clearly the right comparison with land/ocean indices. And the fact that blending makes a difference, as indicated, clearly says that this is so. I can’t easily locate a direct comparison of SST and TAS over ocean, but the linked paper of Cowtan et al shows the same effect of blending as I get:
Thanks, Nick. Using your base anomaly 1979-1983, by the end of the period, the observations are still a half degree below the average of your models.
So even with your measurements, the models are running hot.
Also, yes, I see that the air-ocean difference increases IN THE MODELS. But:
• In the quarter-century of the deviation shown in Figure 3, the air-ocean difference only changes trivially.
• I simply can’t imagine a physical reason why the modeled difference would change so much over time.
• Once again, we see a huge spread in the modeled results, with the air-sea difference going from a single lonely model showing ~ -0.5°C to the max difference of 0.25°C. I sure wouldn’t buy a used car if they told me “it has between 50,000 and 250,000 miles on the odometer” …
• This graph implies that there is a shift around the year 1975 from the ocean warming the air above it, to the air warming the ocean … please explain in simple terms how this massive shift might occur.
Seems to me you need to dial up your skepticism about the model results … as Alfred Korzybski sagely remarked, “The map is not the territory”.
My best to you,
w.
Willis,
Thanks. I was also saddened to hear of the death of Geert, whose work with CMIP especially I greatly appreciated. I don’t know if it is connected, but I found that it is not currently the most up to date with CMIP6. There is a site here which I last used about a year ago which seems to have a larger collection of results, including TOS.
Thanks for the link, Nick, I’ll take a look at that site. Sure wish the CMIP6 folks would put together an easily-accessible site to download ALL of the various model outputs.
Regards,
w.
Meaningless computer games.. Nothing more.
Ahh Nick. I have been posting this on and off for years in response to your ‘model’ posts and you have never answered.
I will try again, though I suspect there will be silence again.
“The Models are wrong. This is a fact not an opinion and it is a fact that can be shown.
Of course you cannot falsify them yet by just checking their forecasts against the real world as not enough time has passed to be definite. Also you cannot run an experiment with the Earth to falsify them.
However, there is another way to disprove any hypothesis. All you need to do is show that it produces an impossible result.
So what would be an impossible result for an accurate and correct model?
Well, what does a climate model output? It outputs a climate signal quantified by the Earth’s global temperature. This output is compared and graphed to past actual temperature data and is then taken forward to predict the future.
All the current climate models do very well on the hind cast against data. Remarkably so really, over the 20th century as the temperature data shows rises and falls so do the models track it with little variation except for the shortest periods. Is that good?…….. NO!
You see the models average out a lot of the natural variation factors, mainly ENSO. The designers original argument for this is that it makes the model simpler (true) and that anyway natural variation was so small it did not affect the main signal significantly. (false)
Now it is accepted that natural variation is strong enough to mask the true signal and for quite long periods, way longer than a decade.
So now both sceptics and warmists agree that natural variation (mainly ENSO) can completely alter the underlying modelled climate signal.
So we can see that the models and the temperature records are outputting different signals. One, a climate signal plus averaged variation and the other, the climate signal plus actual variation. It is now accepted that actual variation can cause the models to drift well away from reality for quite lengthy periods (see the long ‘pause’ at the start of this century). Therefore the fact that the models are currently drifting away from reality does not prove they are wrong. Indeed it is a behaviour that only an accurate model would display in anything other than neutral variation. It doesn’t prove it is correct but it certainly doesn’t prove it is incorrect
So what would be an impossible result for an accurate and correct model to output. Well clearly that would be a signal that does closely match the actual temperature data over the short to medium term. An apple doesn’t equal an orange no matter how you cut it. Only in the long run would the signals align. In the short to medium term an accurate model must run either hot or cold
So, given that ENSO has been doing its thing over the 20th century, the fact that on the back cast run the models track the temperature record very closely in all its up and down movements proves that these models are in fact false. That is an impossible result for an accurate model.
In their hubris, the warmists, when fiddling with their free parameters to make a great fit with the historical data, overlooked that they were trying to fit an apple to an orange! Or perhaps they didn’t think anyone would take much notice of them if they couldn’t even match the past.”
“Well, what does a climate model output? It outputs a climate signal quantified by the Earth’s global temperature. This output is compared and graphed to past actual temperature data and is then taken forward to predict the future.”
I think you have a poor understanding of models. They produce a great deal more than Earth’s average temperature, and the last sentence is totally wrong.
“You see the models average out a lot of the natural variation factors, mainly ENSO.”
Just not true. The models do ENSO. They aren’t synchronised, with each other or Earth, so it washes out in any kind of average, but each model has similar ENSO behaviour to Earth.
“historical data”
The historical data has been modified to fit the climate models(and vice versa), and is properly described as “adjusted” data.
There is a very big difference between the two.
The historical data shows we have nothing to worry about from CO2, because it is no warmer now than in the recent past even though there is more CO2 in the air now than then.
The adjusted data shows we are living in the hottest times in 1,000 years.
Here’s a visual, the U.S. surface temperature chart (Hansen 1999) along side a bogus, bastardized Hockey Stick chart. The U.S. chart shows CO2 is not causing unprecedented warming, and the bogus Hockey Stick shows just the opposite.
The historical temperature data was written down by people who did not have a human-caused climate change bias; who never heard of human-caused climate change.
The adjusted data, created in a computer, was formulated by people who DO have a human-caused climate change bias.
Is it any wonder the climate models are so far off? The Alarmists are living in a make-believe world of their own creation, and it doesn’t correspond with the real world.
The alarmists want us to live in that fantasy world, too. They want us scared and compliant. They think we are stupid.
Would anyone reading this site buy a car, boat, airplane, computer, computer model, etc. with as large a relative discrepancy of stated expected specs and actually delivered performance? Why are the politicians buying this Bovine excrement? I would have been fired if the computer programs I wrote were this bad. And the NRC would have shut down the plant and forced new models and safety analyses be performed, along with a hefty fine.
“Why are the politicians buying this Bovine excrement?”
Because it suits their purposes. Or, they are too ignorant and/or cowardly to go against the alarmist narrative.
Of course the models are a joke. Anyone who builds and uses models knows that relying on them for predictions of a non-deterministic system with so many variables, such as climate, is total and utter nonsense. As Willis says they can’t even model the past.
How anyone claiming to be a scientist can possibly believe the models are remotely accurate is a total and utter fool. I guess that would be all climate scientists, then.
I’m not sure that “fool” describes anyone that makes a lucrative career on misstating facts.
Frauds, is a better description. At least for some of them. I’m sure there are a few dupes thrown in there somewhere.
But the main players are frauds. They know better. They’ve seen all the data all the rest of us have seen (the historical temperature data). There is no unprecedented warming and they know it, yet they pretend there is.
<i>KNMI has a total of 222 model runs using the SSP126 scenario.</i>
This is the first puzzler since KNMI only has 144 SSP126 runs. Based on the caption it appears the ensemble here has been built from an unstructured web folder rather than the actual KNMI SSP126 ensemble. Based on the numbers I think there is a duplication of the already large number of CanESM5 runs, such that this single model (out of 30+ in CMIP6) produced 100 of the 222 runs used here. Importantly this model has the highest climate sensitivity of all models in CMIP6.
<i> the models roughly divide into three groups. Why? Who knows.</i>
See above for a big part of the reason. 45% of the runs come from a single model.
<i>Finally, the claim is that we can simply average the various models in the “ensemble” to find the real future temperature.</i>
Nobody has made that claim. In fact, with regards CMIP6, numerous mainstream climate scientists have clearly stated a belief that the CMIP6 ensemble mean produces too much warming, based on a number of models having higher climate sensitivity than the IPCC-assessed very likely range, as well as the rate of warming since the 1970s. Indeed the AR6 Summary for policymakers projections use observational constraints on the CMIP6 ensemble, for example indicating a best estimate of 1.8C (range 1.3-2.4C) for SSP126, versus 2.5C for the ad-hoc ensemble shown here.
<i>And I used the Berkeley Earth and the HadCRUT surface temperature data.<i>
This appears to be using HadCRUT4. The current version is HadCRUT5.
<i>In only a bit less than a quarter-century, the average of the models is already somewhere around 0.5°C to 0.7°C</i>
This is basically a function of the ad-hoc ensemble used here being massively over-weighted by the highest sensitivity models. Much better to use the one run per model ensemble mean at KNMI. This produces 2100 warming of 2C, with the current anomaly from 1950-1980 being about 0.1C above Berkeley/HadCRUT. In a historical difference plot between model mean and obs the current discrepancy is within normal variation.
c126names
[1] “ACCESS-CM2_ssp126_000” “ACCESS-CM2_ssp126_001”
[3] “ACCESS-CM2_ssp126_002” “ACCESS-ESM1-5_ssp126_000”
[5] “ACCESS-ESM1-5_ssp126_001” “ACCESS-ESM1-5_ssp126_002”
[7] “AWI-CM-1-1-MR_ssp126_000” “BCC-CSM2-MR_ssp126_000”
[9] “CAMS-CSM1-0_ssp126_000” “CAMS-CSM1-0_ssp126_001”
[11] “CanESM5_ssp126_000” “CanESM5_ssp126_001”
[13] “CanESM5_ssp126_002” “CanESM5_ssp126_003”
[15] “CanESM5_ssp126_004” “CanESM5_ssp126_005”
[17] “CanESM5_ssp126_006” “CanESM5_ssp126_007”
[19] “CanESM5_ssp126_008” “CanESM5_ssp126_009”
[21] “CanESM5_ssp126_010” “CanESM5_ssp126_011”
[23] “CanESM5_ssp126_012” “CanESM5_ssp126_013”
[25] “CanESM5_ssp126_014” “CanESM5_ssp126_015”
[27] “CanESM5_ssp126_016” “CanESM5_ssp126_017”
[29] “CanESM5_ssp126_018” “CanESM5_ssp126_019”
[31] “CanESM5_ssp126_020” “CanESM5_ssp126_021”
[33] “CanESM5_ssp126_022” “CanESM5_ssp126_023”
[35] “CanESM5_ssp126_024” “CanESM5_ssp126_025”
[37] “CanESM5_ssp126_026” “CanESM5_ssp126_027”
[39] “CanESM5_ssp126_028” “CanESM5_ssp126_029”
[41] “CanESM5_ssp126_030” “CanESM5_ssp126_031”
[43] “CanESM5_ssp126_032” “CanESM5_ssp126_033”
[45] “CanESM5_ssp126_034” “CanESM5_ssp126_035”
[47] “CanESM5_ssp126_036” “CanESM5_ssp126_037”
[49] “CanESM5_ssp126_038” “CanESM5_ssp126_039”
[51] “CanESM5_ssp126_040” “CanESM5_ssp126_041”
[53] “CanESM5_ssp126_042” “CanESM5_ssp126_043”
[55] “CanESM5_ssp126_044” “CanESM5_ssp126_045”
[57] “CanESM5_ssp126_046” “CanESM5_ssp126_047”
[59] “CanESM5_ssp126_048” “CanESM5_ssp126_049”
[61] “CanESM5-CanOE_ssp126_000” “CanESM5-CanOE_ssp126_001”
[63] “CanESM5-CanOE_ssp126_002” “CanESM5-CanOE-p2_ssp126_000”
[65] “CanESM5-CanOE-p2_ssp126_001” “CanESM5-CanOE-p2_ssp126_002”
[67] “CanESM5-p1_ssp126_000” “CanESM5-p1_ssp126_001”
[69] “CanESM5-p1_ssp126_002” “CanESM5-p1_ssp126_003”
[71] “CanESM5-p1_ssp126_004” “CanESM5-p1_ssp126_005”
[73] “CanESM5-p1_ssp126_006” “CanESM5-p1_ssp126_007”
[75] “CanESM5-p1_ssp126_008” “CanESM5-p1_ssp126_009”
[77] “CanESM5-p1_ssp126_010” “CanESM5-p1_ssp126_011”
[79] “CanESM5-p1_ssp126_012” “CanESM5-p1_ssp126_013”
[81] “CanESM5-p1_ssp126_014” “CanESM5-p1_ssp126_015”
[83] “CanESM5-p1_ssp126_016” “CanESM5-p1_ssp126_017”
[85] “CanESM5-p1_ssp126_018” “CanESM5-p1_ssp126_019”
[87] “CanESM5-p1_ssp126_020” “CanESM5-p1_ssp126_021”
[89] “CanESM5-p1_ssp126_022” “CanESM5-p1_ssp126_023”
[91] “CanESM5-p1_ssp126_024” “CanESM5-p2_ssp126_000”
[93] “CanESM5-p2_ssp126_001” “CanESM5-p2_ssp126_002”
[95] “CanESM5-p2_ssp126_003” “CanESM5-p2_ssp126_004”
[97] “CanESM5-p2_ssp126_005” “CanESM5-p2_ssp126_006”
[99] “CanESM5-p2_ssp126_007” “CanESM5-p2_ssp126_008”
[101] “CanESM5-p2_ssp126_009” “CanESM5-p2_ssp126_010”
[103] “CanESM5-p2_ssp126_011” “CanESM5-p2_ssp126_012”
[105] “CanESM5-p2_ssp126_013” “CanESM5-p2_ssp126_014”
[107] “CanESM5-p2_ssp126_015” “CanESM5-p2_ssp126_016”
[109] “CanESM5-p2_ssp126_017” “CanESM5-p2_ssp126_018”
[111] “CanESM5-p2_ssp126_019” “CanESM5-p2_ssp126_020”
[113] “CanESM5-p2_ssp126_021” “CanESM5-p2_ssp126_022”
[115] “CanESM5-p2_ssp126_023” “CanESM5-p2_ssp126_024”
[117] “CESM2_ssp126_000” “CESM2_ssp126_001”
[119] “CESM2_ssp126_002” “CESM2_ssp126_003”
[121] “CESM2_ssp126_004” “CESM2-WACCM_ssp126_000”
[123] “CIESM_ssp126_000” “CNRM-CM6-1_ssp126_000”
[125] “CNRM-CM6-1_ssp126_001” “CNRM-CM6-1_ssp126_002”
[127] “CNRM-CM6-1_ssp126_003” “CNRM-CM6-1_ssp126_004”
[129] “CNRM-CM6-1_ssp126_005” “CNRM-CM6-1-f2_ssp126_000”
[131] “CNRM-CM6-1-f2_ssp126_001” “CNRM-CM6-1-f2_ssp126_002”
[133] “CNRM-CM6-1-f2_ssp126_003” “CNRM-CM6-1-f2_ssp126_004”
[135] “CNRM-CM6-1-f2_ssp126_005” “CNRM-CM6-1-HR_ssp126_000”
[137] “CNRM-CM6-1-HR-f2_ssp126_000” “CNRM-ESM2-1_ssp126_000”
[139] “CNRM-ESM2-1_ssp126_001” “CNRM-ESM2-1_ssp126_002”
[141] “CNRM-ESM2-1_ssp126_003” “CNRM-ESM2-1_ssp126_004”
[143] “CNRM-ESM2-1-f2_ssp126_000” “CNRM-ESM2-1-f2_ssp126_001”
[145] “CNRM-ESM2-1-f2_ssp126_002” “CNRM-ESM2-1-f2_ssp126_003”
[147] “CNRM-ESM2-1-f2_ssp126_004” “EC-Earth3_ssp126_000”
[149] “EC-Earth3_ssp126_001” “EC-Earth3_ssp126_002”
[151] “EC-Earth3_ssp126_003” “EC-Earth3_ssp126_004”
[153] “EC-Earth3_ssp126_005” “EC-Earth3_ssp126_006”
[155] “EC-Earth3-Veg_ssp126_000” “EC-Earth3-Veg_ssp126_001”
[157] “EC-Earth3-Veg_ssp126_002” “EC-Earth3-Veg_ssp126_003”
[159] “EC-Earth3-Veg_ssp126_004” “FGOALS-f3-L_ssp126_000”
[161] “FGOALS-g3_ssp126_000” “FIO-ESM-2-0_ssp126_000”
[163] “FIO-ESM-2-0_ssp126_001” “FIO-ESM-2-0_ssp126_002”
[165] “GFDL-ESM4_ssp126_000” “GISS-E2-1-G_ssp126_000”
[167] “GISS-E2-1-G-p3_ssp126_000” “HadGEM3-GC31-LL_ssp126_000”
[169] “HadGEM3-GC31-LL-f3_ssp126_000” “HadGEM3-GC31-MM_ssp126_000”
[171] “HadGEM3-GC31-MM-f3_ssp126_000” “INM-CM4-8_ssp126_000”
[173] “INM-CM5-0_ssp126_000” “IPSL-CM6A-LR_ssp126_000”
[175] “IPSL-CM6A-LR_ssp126_001” “IPSL-CM6A-LR_ssp126_002”
[177] “IPSL-CM6A-LR_ssp126_003” “IPSL-CM6A-LR_ssp126_004”
[179] “IPSL-CM6A-LR_ssp126_005” “KACE-1-0-G_ssp126_000”
[181] “KACE-1-0-G_ssp126_001” “KACE-1-0-G_ssp126_002”
[183] “MCM-UA-1-0_ssp126_000” “MCM-UA-1-0-f2_ssp126_000”
[185] “MIROC-ES2L_ssp126_000” “MIROC-ES2L_ssp126_001”
[187] “MIROC-ES2L_ssp126_002” “MIROC-ES2L-f2_ssp126_000”
[189] “MIROC-ES2L-f2_ssp126_001” “MIROC-ES2L-f2_ssp126_002”
[191] “MIROC6_ssp126_000” “MIROC6_ssp126_001”
[193] “MIROC6_ssp126_002” “MPI-ESM1-2-HR_ssp126_000”
[195] “MPI-ESM1-2-HR_ssp126_001” “MPI-ESM1-2-LR_ssp126_000”
[197] “MPI-ESM1-2-LR_ssp126_001” “MPI-ESM1-2-LR_ssp126_002”
[199] “MPI-ESM1-2-LR_ssp126_003” “MPI-ESM1-2-LR_ssp126_004”
[201] “MPI-ESM1-2-LR_ssp126_005” “MPI-ESM1-2-LR_ssp126_006”
[203] “MPI-ESM1-2-LR_ssp126_007” “MPI-ESM1-2-LR_ssp126_008”
[205] “MPI-ESM1-2-LR_ssp126_009” “MRI-ESM2-0_ssp126_000”
[207] “NESM3_ssp126_000” “NESM3_ssp126_001”
[209] “NorESM2-LM_ssp126_000” “NorESM2-MM_ssp126_000”
[211] “UKESM1-0-LL_ssp126_000” “UKESM1-0-LL_ssp126_001”
[213] “UKESM1-0-LL_ssp126_002” “UKESM1-0-LL_ssp126_003”
[215] “UKESM1-0-LL_ssp126_004” “UKESM1-0-LL_ssp126_005”
[217] “UKESM1-0-LL-f2_ssp126_000” “UKESM1-0-LL-f2_ssp126_001”
[219] “UKESM1-0-LL-f2_ssp126_002” “UKESM1-0-LL-f2_ssp126_003”
[221] “UKESM1-0-LL-f2_ssp126_004” “UKESM1-0-LL-f2_ssp126_005”
You are correct that some models are over-represented. But what I wanted was to show all the runs on file. Why? Because I don’t trust the “one run per model”, because I have no idea which run to choose. There are no a priori calculations that would tell us which of the large number of runs of any given model we should choose … nor is there any justification for the idea that the average of a model’s runs will be more accurate than simply picking a run at random …
I also wanted to show the foolishness of the whole idea of an “ensemble” because it depends quite sensitively on just which runs of just which models make up the “ensemble”
My point remains untouched. There is a HUGE difference between not only individual models, but also individual runs of the same model, and even between different versions of the same model, for example …
Perhaps you can educate us just which of those two runs we should believe?
w.
I saw the same differences among model runs past 2020 or so when I looked at the SSP scenarios, too, Willis. Some runs of the scenario turned down, others did not.
I figured the difference arose because some models followed only the Meinshausen forcings. In the SSP126 scenario, CO2 forcing turns down in mid-century. Models following that forcing only, will project a mid-century down-turn in air temperature.
The models projecting increasing temperature past mid-century may include the contribution of ocean heat after the CO2 forcing transient turns off.
The INM-CM4-8 and INM-CM5-0 model runs may be different in that way.
My best to you.
Thanks as always, Pat. The idea of averaging over models is crazy with that kind of stuff going on.
w.
Agreed, Willis.
You found the same problem with CMIP6 models that Jeffrey Kiehl found with the CMIP3 versions.
They were all able to closely reproduce the historical air temperature trend, but they varied in ECS by factors of 2-3. Their projected trends zoomed off in very divergent trajectories. Just as you found for the CMIP6 models.
Kiehl was struck by the dichotomy. All the same pasts, but different futures.
He realized that the offsetting errors that tuned models to reproduce past climate, went on to produce very different futures.
Still, despite the uncertainty hidden in the models, Kiehl genuflected to the accepted paradigm. I.e., “It is important to note that in spite of the threefold uncertainty in aerosol forcing, all of the models do predict a warming of the climate system over the later part of the 20th century.“
I weep at the CliSciFi groupthink and misdirection based in ideology that is reflected in the Kiehl quote. He ignores the fact that all the models were tuned to “… the later part of the 20th century.” and didn’t “predict” crap.
Thanks, Pat, true. I wrote about this in Dr. Kiehl’s Paradox.
Best to you and yours,
w.
Thanks for the listing, that confirms what I thought. There are “only” 50 CanESM5 CMIP6 SSP126 runs in existence but you have 100 there. I think at one point KNMI had all 50 in one ensemble, but then changed to split them in two parts. The directory you used contains both ensemble setups so your selection duplicates all the CanESM5 runs.
Just pick one at random. Pretty sure the KNMI ensemble just uses the first ensemble member for each model. Here’s a quick experiment: setup 100 monte-carlo one-run-per-model ensembles, each time selecting a random run from each model. I would guess there will be barely any difference between the 100 ensembles.
It’s really not a question of accuracy of the runs. It’s about properly representing the ensemble by weighting members appropriately so the results aren’t dominated by a single model, as in your setup.
Of course results depend on what models make up the ensemble, but that doesn’t at all demonstrate anything about the usefulness of an ensemble. The purpose of an ensemble is simply to represent uncertainty because a single model can’t tell us much about that. No-one is suggesting that any given ensemble is perfect, but it’s better than not having an ensemble at all. Also, the sensitivity to which members make up the ensemble is dependent on properly weighting, which is why attention should be paid to doing that.
Not sure why this is a point? Demonstrating the difference between models is the purpose of the ensemble.
That’s a curiosity so I’ve taken a look. The first clue is that the historical periods line up exactly, which is impossible if they are from different model versions. Turns out that the black line is actually the SSP245 run of INM-CM4.8 – it presumably got mislabeled by somebody at some point. Go to the KNMI front-end and plot INM-CM4.8 SSP126 and SSP245. You’ll get the same plot you just posted.
Are you suggesting some models are more right than others? In that case, there must be some incompetent modellers.
I know for a fact that all models bear no relevance to Earth’s climate system. They can never function with any skill until they can replicate convective instability of tropical oceans that limit ocean surface temperature to annual maximum of 30C. Once that is done, any notion of catastrophic global warmings is eliminated. And all this nonsense goes into the waste bin where it belongs.
Note though that AR6 poster child model mean comparison to temps Figure in the SPM uses HadCRUT4.
So HadCRUT4 seems to be the appropriate comparison.
It is meaningless to average temperature over different models. There is no central limit theorem for models. Another problem is that each model makes it own assumptions about aerosols. But only one or possibly none of them has the right amount. This means that averages are taken over a lot of models that make wrong assumptions about the concentration of aerosols. This more looks like the fruits of the poisoned tree.
I believe that was one of the first lessons in reasoning we learned … ‘two wrongs can’t make a right’.
If every time you do something in a particular way you get a bad result, stop doing it and reevaluate the method.
You are correct.
The reason they do it (probably unintentionally) is because it filters out the noise and reveals the common input to the models – the prior forcings.
But because the climate model mean can be generated accurately using simple linear regression of the prior forcings this tells us the models are redundant. The match to obs. temps arises because the priors already match the temp profile, once scaled into the same units.
Odd, the temperature doesn’t square with the University of Alabama data. Why is that?
Unlike the Politicians I would be reluctant to bet the farm on unvalidated climate models.
That’s what the politicians are doing. They are not reluctant at all.
We have climate change group-think in our political class and it is leading us down the road to ruin.
Let’s hope we can turn this around in Nov. 2022, and Nov. 2024.
We have to remove these insane radical Democrats from power over our lives. One year of this insanity ought to be enough for anyone with any sense, to see we are heading down the wrong road fast.
The radical Democrats do not have the answer for anything. Everything they do is detrimental to the United States and its people.
I think this post combined with aspects of the model dissection WE did recently would be timeless
When I’ve confronted people regarding models I’ve used that post to demonstrate how ridiculous they really are.
Meaning, the graphs above show the future limits of model projections but are those limits simply shoulder rails in the code to keep the results from running off into true insanity?
Well done
The answer is that these models are dyslexic; 3.1 should read 1.3. Or, perhaps 1.3 should read 3.1. Or something.
What is interesting when you look back at various ‘models’ throughout history is the amount of times they utterly didn’t work.
What is the big shock should not be ‘the models are wrong’ but ‘the models were wrong and we somehow didn’t completely destroy ourselves by following them’.
Climate Change models – yeah, enough said within this forum.
COVID 19 predictions – yup. Remember the hundreds of thousands who were absolutely going to die within the first months?
We can also look back deeper into the historical record. Prior to WW2 there was a strong theory that ‘The Bomber Would Always Get Through’. Now to be fair in practice stopping a bombing raid was extremely difficult but sustaining a bombing offensive in the face of constant resistance was also extremely difficult. Point was it was believed that come a war there was no way to prevent the bombing of UK cities. Hence if they were going to be bombed, they needed to work out how many would die. The models (that M Word again) worked out that if one ton of bombs could destroy a set area and kill a set amount of people, then 10 tons of bombs would do 10 times as much… cause… linear. Basically everyone would die so the mass evacuation of children was brought into play. Sure I am certain that some children had a grand adventure, but the record also shows that for many being forcefully removed from their parents and homes and forced to live with complete strangers was utter hell. Models.
I guess on the plus side without these predictions less money would have been spent on the air defence of Great Britain, but the underlining point was the models were wrong.
Same war while I am on the topic, since physically shooting in combat conditions at enemy warships was expensive during times of peace nearly all naval powers used ‘wargames’ (or Models) to attempt to predict the best way to fight enemy ships in various situations. All sorts of wonderful systems based on average hit rates and shell effects vs armour and damage ability were brought into play and the research departments tested theories and wrote suggested tactics and everyone was happy. Cause the Models told them they should be.
Come the war and we had the Battle of the River Plate. German ‘Pocket Battleship’ vs three RN cruisers. Now the models had studied this as the use of Pocket Battleships as commerce raiders was something everyone was expecting. The models said the two Leander class cruisers with their 6 inch guns should engage a Pocket Battleship at long range using rapid fire and smoother the German ship with hits. These would overwhelm the enemy in about 30 minutes and VCs all around. Jolly Good Show.
So that is what they did.
Spoiler? It didn’t work.
The Graf Spee took only a few hits from the 6 inch guns despite the two cruisers firing off nearly all their ammunition. They kept firing because that is what the models told them would work.
Since the Germans weren’t taking damage from the two 6 inch cruisers they concentrated on the HMS Exeter and worked her over badly to the extent the Germans could/should have overwhelmed and sunk her. The other two RN ships eventually realised they had done next to nothing for over an hour – much longer than the models had predicted – and changed tactics.
Short summary – the Germans went into a neutral port, discovered damage to their galley would prevent them from feeding their crew on any extended voyage back to Germany and, rather than going out in a pointless blaze of glory against the reinforced British, scuttled in a blaze of smoke and the British, realising they had very nearly snatched defeat from the jaws of victory wrote up the entire thing as a brave battle against a MASSIVELY superior enemy in the bravest traditions of the Royal Navy, and not ‘our tactics were wrong, we barely even hit the enemy and utterly wasted our advantage in numbers and weight of fire.’
Why? THE MODELS WERE WRONG.
Face it, the only useful model is made of plastic and one of the landing wheels knocked off when your mother attempted to dust it.
If only we had a peer reviewed accredited group of climate realists to debate , combat or refute the other so called ‘peer’ reviewed climate alarmists .
Sadly the alarmists have or are making so much $ and political gain from alarmism only reality will wake the voters minds up to think for themselves regarding weather / climate /economy .
“only reality will wake the voters minds up to think for themselves regarding weather / climate”
We need about a decade of cooling to really change the game.
We might get a decade of cooling, too, if we go by historical, written records which show the climate is cyclical and warms for a few decades and then cools for a few decades and then repeats the process.
If history is a guide, then we may have started into the cooling phase of the cycle. Time will tell. But one thing is for sure, CO2 in the atmosphere is increasing, yet the temperatures have cooled 0.7C since the highpoint of the 21st century. That’s just the opposite of what alarmists claim should be happening when CO2 increases.
w. ==> You forgot to remind readers that when the models are run, there is code that throws out all the outliers — the runs that produce temperatures that soar towards infinity or fall to absolute zero. What you see above in your graphs are only those runs with results that seem “reasonable” to the modelers and their handlers.
Kip — your observation was certainly illustrated in Stainforth 2005 ClimatePrediction dot net Nature paper.
They tossed out all the runs that unaccountably showed cooled climates with rising CO2.
Which was said to be, “due to known limitations with the use of a simplified ocean (see Supplementary Information).”
The simplified ocean somehow was no limitation on the accuracy of the warmed climates, however. Nature’s reviewers evidently agreed.
Pat ==> If you haven’t read the ‘Chaos Theory required reading list’ , you’ve cheated yourself. Absolutely mind-changing concepts which explain a great deal of the mystery pf things.
I’m sure the list is in one of my essays on Chaos here at WUWT.
Troposphere temperatures will still remain below average in March in North America. The polar vortex continues to operate. La Niña will become active in May. As solar activity increases, hurricane activity may increase, both in the western Pacific and Atlantic.
https://www.longpaddock.qld.gov.au/soi/
This month, the forecaster consensus favors a slower decay of La Niña due to the recent renewal of ocean-atmosphere coupling, which contributed to cooler near-term forecasts from several state-of-the-art climate models. For the summer and beyond, there is large uncertainty in the state of ENSO; however forecasters lean toward negative Niño-3.4 index values even if the index does not reach La Niña thresholds. In summary, La Niña is favored to continue into the Northern Hemisphere summer (53% chance during June-August 2022), with a 40-50% chance of La Niña or ENSO-neutral thereafter; click CPC/IRI consensus forecast for the chances in each 3-month period).
https://www.cpc.ncep.noaa.gov/products/analysis_monitoring/enso_advisory/ensodisc.shtml
“Also, La Niña three-peats (triple dips?) are very rare—only two exist in our more reliable historical record going back to 1950 and both occurred after major El Niño events, which our current event did not. The time evolution of the Niño-3.4 index for the two La Niña three-peats is featured in the darker blue lines in the image below. It is also interesting that out of the eight double-dip La Niñas in our historical record, three ended up evolving into an El Niño for the third winter (red lines) and the remaining three ended up on the cooler side, close to La Niña thresholds, but were ultimately classified as ENSO-neutral winters.”
Amazing. The models are trained using past temperatures. And having seen the answers they still cant get the past correct. But this in no way affects their ability to predict the answer the model builders will accept.
What if a climate model said temps were going to increase 100C? The model builder would change the code until a more reasonable result was delivered. And it would be the model builder that determined this was the correct answer regardless of how buggy or error ridden the code might be.
As such models do not predict the future. They predict what the model builder believes the future to be.
Computer models like these with so many parts with missing physics are basically just the modellers beliefs or opinions dressed up in computer code.
Lipstick on a pig.
In the absense of test data there is no way to validate or verify a computer program that predicts the future.
Further there is no mathematical solurion known to the n-body problem which is the equivalent problem to the n dimensional chaos climate model are trying to solve. All current methods diverge from rather than converge on the correct answer.
This result is well known outside of climate science, where peoples jobs do not rely upon finding the wrong answer.
Really? You all are *still* trying to pretend away climate science with your pseudo-scientific clap-trap? What a disgrace to our nation.
MGC March 18, 2022 10:40 pm
“MSC”, the disgrace is that in addition to not having the courage to sign your own name to your words, you have totally ignored my request to quote the exact words you are discussing.
As a result, we have no clue WHO you are referring to, nor WHAT you are calling “pseudo-scientific clap-trap”.
Let us know when you want to grow up and join an adult discussion of actual scientific issues. Until then, I’ll just continue to point and laugh.
w.
[snip. NO Barry, you do not get to hijack the thread and start a general discussion on the aspects of AGW and CO2. If you want to contribute to this post which is about the unreliability of climate models, that is the substantive and on topic, feel free. We do logic here, not shouting-cr]
It’s unfortunate that you feel the need to shield Eschenbach from three simple and impersonal yes/no questions. Were they outside the topic of climate change? Did they insult anyone? Isn’t Willis old enough to answer three simple questions on his own?
(Being on topic about the quality of the models in question was too hard for you to talk about?) SUNMOD
No Barry. We are being adults here and you’re arguing points tangential and unrelated to the topic because you want to prove how smart you are and how dumb we are in your mind.
There’s a long history in the AGW flame wars. You’re old, but naive and uninformed.
Sorry, but an “adult” discussion of science does not start by intentionally ignoring decades of scientific research that have led to a conclusion that you refuse to accept.
MGC, here’s how science works, since you don’t seem to understand the process.
Someone, say me, posts a variety of scientific claims, say about the CMIP6 climate model results released two years ago. To support these claims, someone, say me, provides all of the data, logic, and math that supports the claims and allows for replication of the claims.
Someone else, say you, quotes something that I’ve said, and uses data, logic, and math to demonstrate, not claim but demonstrate, that what I said is wrong. If you are successful, it will be obvious to all … and the same is true if you’re not successful.
However, although I’ve done part A of that process, you haven’t even begun to approach point B. Instead, you make the unsupported and insulting accusation that I’m “intentionally ignoring decades of scientific research” regarding the CMIP6 results.
Which were released two years ago.
It also seems you think that the CMIP6 results have led to some unspecified “conclusion” that I “refuse to accept” … but since I have no clue what that “conclusion” might be, that statement is meaningless to me.
Here’s a post regarding how to tear my results to shreds. Spoiler alert—you can’t do it by foolishly attempting to insult me. That just makes people point and laugh.
My regards to you, and seriously, you need to up your game if you wish to be taken seriously. READ THE POST BELOW, it tells you exactly how to show that I’m wrong.
w.
http://wattsupwiththat.com/2015/04/05/agreeing-to-disagree/
Willis,
Since the admins felt it necessary to shield you from my three simple yes/no questions earlier, I’ll try again while ensuring these questions are focused specifically on climate models.
Yes or no, please:
Looking forward to your answers. A total of three words, in fact, will suffice.
Three words will suffice? Sure. “Osculate My Fundament”.
After all the nasty things you’ve said about me, I am under NO obligation to answer any of your questions.
However, if you’ll allow me six words to answer your three questions, here you go:
• No Clue
• No Clue
• No Clue
Seriously, I’ve never investigated any of those models. And in a thread about CMIP6 models, they’re wildly off-topic.
But for fun, I just looked at the Exxon model.
Red line is Berkeley Earth observational temperature estimate, LOWESS smooth. Blue line is HadCRUT observational temperature estimate, LOWESS smooth
You ask if it’s “accurate against direct observation?
Nope. They’d have done better with straight-line extrapolation.
Regards,
w.
I suppose I should explain my comments in more detail.
I hadn’t been to the WUWT site in many years, for the more than obvious reasons.
When I stopped by this time, I couldn’t help but make a general comment on my disbelief in finding that you all are, after all these years, still blindly tilting at windmills; yes, still “intentionally ignoring decades of well verified evidence”, still making all kinds of fairy tale excuses to try to pretend away the overwhelming worldwide scientific conclusion regarding AGW, a conclusion based upon decades of well verified evidence researched by thousands of scientists from dozens and dozens of nations.
And now, specifically regarding the CMIP6 climate models:
There are radically different results of the CMIP6 climate projections published elsewhere; results that bear no resemblance at all to what you’ve shown here. See one representative link below.
One possible explanation for this massive discrepancy is that what you’ve shown here, which you describe as so-called “raw model runs”, is in some way an inaccurate representation of the actual climate models track record. Perhaps, in some way, intentionally inaccurate.
I can’t say for sure why your article shows such a massive discrepancy compared to published results seen elsewhere, but it is clearly there. What I can say for sure is that there are already some easily spotted errors in your article: for example, “SP126” is not the lowest CO2 emissions model scenario. SP1-1.9 is. One can’t help but wonder what other less easily spotted errors may also exist in your “analysis”.
https://cbhighcharts2019.s3.eu-west-2.amazonaws.com/CMIP6/historical_timeseries_obs_cmip5_cmip6.html
“CMIP6 model historical runs from 1850-2014 are combined with mean projections through 2019 across all available scenarios. One run is used per model. Solid lines show the multi-model mean, while the shaded areas represent the two-sigma range. Values in brackets reflect the number of models used in the analysis. Chart by Carbon Brief using Highcharts.”
That’s three time you’ve accused me of intentionally being inaccurate or ignoring evidence.
Piss off.
I don’t have any truck with slimeballs like you who accuse me of lying. I was brought up under what in my family was called “The Captain’s Code”, the rules of life of my great-grandfather, a Mississipi riverboat captain.
One of these rules was:
I’ve done my best to live by that. However, since it’s no longer the 1870’s, I don’t kill people for calling me a liar as you have done. Instead, I have to content myself with pointing out that you are a vile waste of valuable oxygen, that you are lower than pond scum, that your antecedents obviously had sexual congress with reptiles, that you are cordially invited to stuff your accusations up where solar panels don’t work, and that I will have NOTHING further to do with you.
Go be nasty to someone else. You’ve burned your bridges with me.
w.
Translation of Eschenbach’s lamentable screed:
“MGC pointed out that the CMIP6 climate model track record posted in this article has massive discrepancies as compared to other public records of the same datasets, and has provided evidence to back his statement.
Rather than try to understand or explain those discrepancies (as a true scientist would do) I’ll just post a litany of ad hominem attacks against him, in order to deflect attention away from having to address those discrepancies.”
One can also look back through the climate model track records in all the historical IPCC reports. Those also bear no resemblance to what you’ve posted in your article.
Thanks for great article! But I dont see the ‘actual’ (true) temperatures in Fig 1. Can you help?