Guest Post by Willis Eschenbach
As many of my posts start out, “I got to thinking about …”.
In this case, I got to thinking about the Berkeley Earth global temperature dataset. So I got their gridded file “Monthly Land + Ocean Average Temperature with Air Temperatures at Sea Ice” covering 1850 to 2021 and took a look at it. I started at the first month’s data, January 1850 … and my jaw hit the floor.

Figure 1. Berkeley Earth surface temperature, January 1850. White areas have no data.
What shocked me was the red-orange circle centered north of New Zealand, as well as the half-circle in northern South America.
Clearly, what they are doing is taking one temperature reading at one point, and extrapolating it to a surrounding area. How big an area? Well, the circle north of Kiwiville has a diameter of ~ 1,600 km (~ 1,000 mi). It covers an area of 8,700,000 square km (3,360,000 sq mi). That’s about the area of the continental US … estimated from one temperature reading.
And there’s no island anywhere near the center of that circle, so it would have been a temperature taken from a ship …
Now, if you look carefully you’ll see that the southern part of the circle is more orange, it’s a bit cooler. That makes me think that they’ve used modern measurements of the temperature gradient around the center, and adjusted them to fit the single surface temperature measurement. To check that, let me go take a look at the January temperatures of that region over time … I’m writing this as I’m analyzing the data, so I’ll be back soon.
…
OK, here’s what I find.

Figure 2. January temperatures from 1850 to 2021 of a vertical (North/South) slice through the middle of the red circle north of New Zealand in Figure 1. The slices run from 16°S to 46°S. Temperatures are expressed as anomalies around the temperature at the center of the circle, at 31° South latitude.
Looks like my guess was not too wild, they’re using some kind of procedure like that.
But is extrapolating the temperature of an area of the ocean the size of the continental US from one single temperature measurement a reasonable procedure?
Having spent a good chunk of my life at sea, I’d have to wonder. I’ve seen areas where the ocean changed temperature by a few degrees or more in a few hundred meters. Where a cold current hits a warm current, there is often a clear dividing line and little mixing across the line.
And over the land the changes are much larger, like say over northern South America in Figure 1.
So … the whole of the US from one thermometer? Where I live, for example, it almost never freezes. But a kilometer (~ a half-mile) away, it freezes a number of times per year. Here’s the freeze warning for tomorrow. I live near the coast north of San Francisco, in the narrow sliver of green near the coast to the left of the “S” in “Santa Rosa” … it probably won’t freeze here. The stretch along the coast in this area on the western side of the first range of hills, from about 600′ to 900′ (180m to 270m) in elevation, is known locally as “The Banana Belt” because it hardly ever freezes. We grow lemons, limes, and avocados on our patch of soil.

Figure 3. Freeze warning for Wednesday, February 23, 2022
So I’ll leave it to the reader to decide if one thermometer is enough to estimate the temperature of the entire continental US … and while you consider that, here’s a video loop of the coverage of the first twenty years (240 months) of the Berkeley Earth global surface temperature data.

Figure 4. Video loop of the first 240 months of the Berkeley Earth global surface temperature.
I find the changing coverage of Australia over time most perplexing.
At the end of the day I got to wondering … just when did Berkeley Earth finally achieve complete global coverage? Here’s the sad answer.

Figure 5. Percent coverage, Berkeley Earth surface temperature, divided by land and ocean.
Interesting. The effects of the wars on the temperature reports from oceanic shipping are quite visible. And even with extrapolating out so that a single thermometer covers an area the size of the continental US, land coverage didn’t exceed 90% until after WWII … and total coverage wasn’t achieved until 1978.
I have no overarching insights from this research, other than that the spotty nature of not just this Berkeley Earth dataset but most climate data is a continual thorn in the side of researchers, and it makes all conclusions about the climate very tentative.
Oh, yeah … about the title of the post, “SWAG”.
A “WAG” is a “Wild Ass Guess“. And no, I didn’t make that up.
And a “SWAG”, on the other hand?
That’s a far superior creature, a “Scientific Wild Ass Guess“ … like say the various estimates of global average temperatures in the 1800s.
My best wishes to all, blessed rain here, what’s not to like?
w.
As Is My Custom: When you comment, I ask that you quote the exact words you’re discussing, so we can all be let in on the secret of just who and what you are on about.
I’ve said it a thousand times but making global policy on hapless historical temp data presented as accurate fact is lunacy.
I would call it “convenient,” not lunacy.
As in “convenient” for running the largest, grandest Confidence Scam the world has ever seen.
Global policy is not made on historical temp data.
Because 1850 hasn’t become the new poster child for human caused warming? You sure deny a lot of what gets reported in the news lately.
Can you show the posters about 1850?
Sure. https://www.ipcc.ch/sr15/ Chapter 1 Executive Summary
But it is good to know that the IPCC has nothing to do with forming global policy based on 1850-1900, which is historical temp data. One must wonder why they are wasting everyone’s time printing this and having worldwide climate assessments, which you claim they didn’t.
So there! 🙂
1850-1900 used as an approximation is not exactly the same as basing decisions on 1850.
They’ve already decided people in the past were too ignorant to read thermometers because the climatologists wiped out the extreme heat waves recorded in the 30’s-40’s from the record. So why should they also put any faith at all in sparse records from 1850-1900?
That makes no sense whatsoever.
As a stand up comic, you leave more than a little bit to be desired.
Stand up comics usually have to tread the long & winding road for years honing their act to perfection, until they get that one break. That takes commitment & dedication & perseverance, & I suspect Nicky baby doesn’t possess those great qualities in any measure, he is merely an annoying mosquito, & like most irritating little bugs, needs slapping down!!! Perhaps he needs to change his shower gel, to one others of his ilk use, I think it used to marketed as DDT!!!
“It uses a kriging-based spatial interpolation to provide an extensive spatial coverage for the period from 1850 to present.”
https://essd.copernicus.org/articles/12/3469/2020/essd-12-3469-2020.html
BEST
Indeed. The policy is made on the basis of models predicting the Apocalypse but only after we are all dead.
or no more than 10 years from now
Are you trying to claim that nobody is using historical data to try and prove that the Earth has warmed?
‘Global’ policy is to restrict warming to 1.5 deg C above the pre-industrial temperature. Of course ‘Global’ policy is made on historical temp data. It is based on it.
I’m sure they would be quite happy to restrict it to 1.5°C above the temperature in 1900. Or even 1920.
If they would be perfectly happy to do so, why don’t they?
The fact that they don’t puts the lie to your claim.
Nick, you seem to be acknowledging that the 1.5ºC target is as arbitrary as the baseline date. Are you?
I want 1935.
Why not 1984?
While everyone else is proving governments policies are based upon these types of data that you believe are proof of AGW/ACC.
You miss the whole point of what has been proven by Willis Eschenbach that all the data presented past 1978 is not to be trusted. If you go back to 1850 the data was mostly guesses from scattered temperature recording that left thousands of miles between them that temperatures could be far higher or lower and large parts of the world had zero data. And then after 1978 the temperatures nearly flatline to present.
The fact is that 1850 was still cold globally at the estimated end of the LIA. People globally were dying because of how cold it was and Fossil Fuels came along and heated homes that saved many lives ever since.
I have been pulling and analyzing daily temperature data from NOAA for the last few months. They have 1063 stations that purport to have data from the late 1800s through 2020. Although i’m not finished yet and can’t therefore speak categorically, a significant number of those stations have large gaps of 5% or more post 1900. Before 1900 the data is so spotty as to be useless.
I’m having the most trouble with the assertion that 1.5°C or 2°C more is such a bad thing. I would rather live in Bali for the weather and the incredible greeness of it all, and there it’s roughly 15°C higher in yearly average and about 50°C higher in winter extremes ( and even easily 20°C higher in winter milds) than here in Southern Ontario – so why the fuss about a lousy 2 degrees – especially when the IPCC itself says the tropics will experience very little change.
We have to keep pointing out the obsurdity of the activists’s climate-porn claims.
It is – to my understanding – generally accepted that with “climate change” it becomes warmer or colder at the polar regions while the temperatures nearer the equator stay basically the same.
Prior hot-house periods had greater tropical greening well up into Eastern North America and Northern Canada had hardwood forests inside the Arctic Circle, although there was still winter weather of snow and ice. Greener landscapes flourish from lowland into the mountains providing more flora for food that all fauna flourish.
Glacial Ice-house Periods are where the Ice Caps move closer towards the Equator that mountain ranges build glaciers causing greater cooling around the Equator, causing Tropical Forests to retreat, while causing colder lowlands and flora to die out that fauna die from starvation and hypothermia.
It’s well known that Cold weather kills more than Hot weather does. All flora benefit from hotter climates as do all fauna that adapt by finding cooler shaded places during the hottest parts of the summer afternoons or shelter from the weather. Whether cold or hot weather the sick, infirm, elderly, and/or crippled fauna are at higher risk of mortalities from starvation, hypothermia or hyperthermia (respectively) and as prey to predators.
Humans are the most adaptive of all fauna and in the past were better able to survive climate changes from a climate similar to now, into the “Last Ice Age” and throughout the Holocene Interglacial to now. While we humans live in every climate globally because of our abilities to adapt. All other fauna in the wild cannot adapt nor move around like we do. That like the foods we eat most are grown and harvested, any food fauna would need to be taken care of more during cold than they would during hotter climates. Which is why nearly all food is grown in warmer climates and transported to the people in cold climates. Growing seasons would become longer in the upper Northern Hemisphere with hotter climate changes and with colder climate changes those growing seasons can become a thing of the past.
Climate Alarmist that want the Earth to be like the 1850s – 1900s “Pre-Industrial Era” are ignorant about all known history we have learned from the past.
What about the late 1930s when the coal port in Spitsbergen was open for 7 months of the year compared to only 3 months of the year prior to 1920?
Would they be happy to restrict it to 1.5°C above AD1100, or AD1, or 6000BC or what-the-heck: 70 million years ago? All pre-industrial and all warmer than today.
Why only 1.5°C or 2°C? The IPCC pulled those numbers out of their collective fat asses. I’m in Canada where I got to put up with a temperature swing of almost 60°C in the year, and I’m in the most southerly part.
Let’s aim for 10°C warmer – nice round number and roughly the natural temperature level of the Earth for hundreds of millions of years before the climate emergency of the ice ages started drastically reducing and swinging temperatures.
The current climate isn’t natural! It is our duty to fix that and restore the natural temperature levels of the paradise that was the Cretaceous period.
Prove me wrong – I’m using the exact same logic as the IPCC and activist pseudo-scientists. In my RCP10.0 all or most of the excess deaths from cold vs heat will disappear, and the biosphere near the poles will blossom like it hasn’t since 35 million years ago. The other regions will also most likely benefit because of the extra moisture in the air and increased growing seasons and decreased cold snaps and frost conditions. Equatorial and tropical regions will hardly notice any change as almost all the warming will be towards the poles, as per IPCC itself. And if Antarctica goes from, say, a min. of -80°C to -60°C, I’m sure the Emperor Penguins won’t mind.
So climate change in isolation is the “new” old normal, and the social residue is opportunity (e.g. leverage).
Global policy? Who’s making what global policy?
If you meant to say “global warming policy is not made on historical temp data” then I’d agree.
Because there is no science anywhere that indicates global warming policies will impact global warming in any way whatsoever.
So logic says global warming policies have nothing to do with any temp data past present or future.
Edenhofer agrees. BEST uses RAW temperatures with their own mix of sweet and sour sauce.
Sri That was supposed to be for Nick.
Yup! Even the IPCC and the fine print of such toilet paper as the Paris Agreement mention that for the industrial impoverishment to be endured for the “sake of the environment” temperatures will be reduced some tiny fraction of a degree.
The liars don’t even have the imagination to ’round’ it up to a half or full degree. They are so possessed by climate demons that they are sh!tting themselves about 0.01°C.
That’s absolutely correct!!! Global Policy is made behind closed doors in the UN HQ building in New York, or in fact anywhere the Global Socialists Intellectual Elites want to meet, preferably in exotic expensive locations all funded by the taxpayer at large, with the finest foods, the finest wines & champagnes & sparkling wines, the luxury 5 Star Hotel resorts that taxpayers cash can buy, & each meeting ends in general agreement without any intention of full-filling any agreement unless oodles of taxpayers cash is on the table, let’s face it, these parasites have to earn a living somehow but don’t want to work too hard in doing so, they might break a nail or worse, work up a sweat!!! I wonder, do these parasites get to take home any of the left-overs in food & champagnes/fine wines when the gig is all over??? I’m sure you have the inside info on this one, or is it that you’re seething with jealousy because they don’t invite you along, to give them your expert opinion???
Its made in response to unprecedented events.
Only if you define “unprecedented” as “hasn’t happened much since 1900”.
w.
8°F this morning where I live — rural Kittitas County WA. That’s not a WAG. At 10 AM we are up to 18°F.
Thanks Willis. I like the animated maps of the World. Makes for a chuckle.
I assume we taxpayers paid for the 1850 to 1978 collection and processing of all that nice “data”. We didn’t get our money’s worth.
It’s done by government, so do we ever get our money’s worth? Absolutely not.
I live north of you right on the Puget Sound. We set the all-time coldest low temperature for the date yesterday as did many cities in Western Washington. Weather, just like when a high temperature record is set.
Willis, I quote (extract) you: Where I live, for example, it almost never freezes. But a kilometer (~ a half-mile) away, it freezes a number of times per year. The stretch along the coast in this area on the western side of the first range of hills is known locally as “The Banana Belt” because it hardly ever freezes. We grow lemons, limes, and avocados on our patch of soil.
Is it fair or reasonable to compare hilly inland climates to flat (sea-level) ocean climates?
Your colleague Steven Mosher — much missed in the recent discussions — once re-defined the word “climate” as the outcome of a function of latitude and altitude. Stipulating that definition (noticing it has little to do with temperatures, day or night, clouds, solar irradiance …) I’d suppose the best (so to speak) comparison would be between the South Pacific red circle to a station on an island around Japan. I don’t see one, but… As a friendly suggestion.
I miss Mosher too. Poor guy was probably contract traced right out of existence. He sure loved his Berkeley data.
He is in South Florida with CR. Had a serious stroke in South Korea, got back to US, fell and broke hip now successfully replaced. Just now getting out of hip rehab.
No wonder he’s been quiet lately. Glad to hear that he’s recovering.
Good luck to you, Steve.
Rud, remember this from Climate etc.
Steven Mosher | July 2, 2014 at 11:59 am |
“However, after adjustments done by BEST Amundsen shows a rising trend of 0.1C/decade.
Amundsen is a smoking gun as far as I’m concerned. Follow the satellite data and eschew the non-satellite instrument record before 1979.”
BEST does no ADJUSTMENT to the data.
All the data is used to create an ESTIMATE, a PREDICTION
“At the end of the analysis process,
% the “adjusted” data is created as an estimate of what the weather at
% this location might have looked like after removing apparent biases.
% This “adjusted” data will generally to be free from quality control
% issues and be regionally homogeneous. Some users may find this
% “adjusted” data that attempts to remove apparent biases more
% suitable for their needs, while other users may prefer to work
% with raw values.”
With Amundsen if your interest is looking at the exact conditions recorded, USE THE RAW DATA.
If your interest is creating the best PREDICTION for that site given ALL the data and the given model of climate, then use “adjusted” data.
See the scare quotes?
The approach is fundamentally different that adjusting series and then calculating an average of adjusted series.
in stead we use all raw data. And then we we build a model to predict
the temperature.
At the local level this PREDICTION will deviate from the local raw values.
it has to.
He’s off mining Bitcoin. Just another scheme of smoke and mirrors, but a fair bit more profitable for the moement than climate data manipulation.
That is why anomalies to station baselines are used washes out latitude and altitude differences.
Yes, but has anyone done any serious research to determine that anomalies in a Brazilian rainforest are the same as on top of Everest are the same as those in Death Valley are the same as those in the middle of the ocean a the equator?
I could easily be persuaded that temperature swings and means are quite different for different locations, so comparing them might make no sense whatsoever.
That does not need to be done. Each station has its own average baseline but on identical 30 year time frames. The anomalies are just the variations off the baseline. Does not mean they will be the same anomalies in the Himalayas as in the Amazon. Does mean they can all be averaged together for global anomaly trends.
Where this tends to mislead is scale. Anomalies are always small compared to the actual temperatures from which they are Computed. Lindzen used a marvelous graph of the global warming anomaly compared to actual Boston max min temperatures by day for March and April (cannot remember which year. The delta anomaly change was not discernable.
Exactly. Why should I care about a one degree differential in the context of routine daily temperature swings of ten degrees (C)?
Climate is not just a function of latitude and altitude, but also of surrounding geography that controls downsloping and upsloping winds.
It’s what French wine-growers call ‘terroir’.
Well Bom magically produces homogenised “data” from hundreds of KM away.
Going off the graphics, I would doubt the reality of coverage in Siberia prior to the building of the Trans-Siberian railroad. Likewise Northern Canada or Greenland prior to WWII.
Don’t forget that after the fall of the USSR in December 1991, they couldn’t afford to maintain remote weather stations and all the ones in Siberia were taken off-line. Might have made a tad bit of difference in global temperatures, assuming there is such a thing, don’t you think?
And prior to that, towns got their allocation of heating fuel based on average winter temperature, so it was advantageous to slip the mercury tube down a couple of mm on the scale….
Even more interestingly, excess cold triggered an increase in the vodka ration.
Seems only fair…
But is extrapolating the temperature of an area of the ocean the size of the continental US from one single temperature measurement a reasonable procedure?
Nope. Neither is doing it over land, which is what all the global temperature data sets do that use meteorological data. They are infilling temperatures over the vast majority of the surface of the earth with numbers plucked from thin air, although they are “educated” numbers derived by doing the same kind of extrapolation from measurements that may be hundreds of kilometers away; “gridding” the temperature data for statistical analysis. That’s why I think the global satellite measurements with their flaws are a more accurate picture of global temperatures than the terrestrial data sets. They are actually measuring temperature over most of the earth’s surface, not making it up.
Don’t get me started on ocean temperatures from a few thousand free-floating Argo buoys and intermittent ocean transects by ships.
just when did Berkeley Earth finally achieve complete global coverage?
They never did. Neither did HadCRUT, GISS, or any of the widely-used global temperature data sets derived from meteorological data. Their results are virtually useless for determining global temperature trends because so much of the gridded data is made up by extrapolation; never mind the fact that most of the weather stations are also poorly sited. Only the U.S., as far as I know, has attempted to remedy the siting problem on a large scale with the U.S. Climate Reference Network.
Though only for the United States, the USCRN (and USHCN) trend looks surprisingly like the UAH global satellite temperature trend with a very modest warming trend or none at all over the last few years; while HadCRUT, GISS, Berkeley, and even the RSS satellite data, show a much steeper warming trend and no “warming hiatus” that is clearly visible in the UAH plot. Gosh, I wonder why? Follow who’s in charge of the data sets and it all becomes clear.
Even the satellite data sets don’t go all the way to the poles.
Which is rather curious when you consider that the satellites are generally in polar orbits.
Near polar, they don’t actually go over the poles.
Curious?
No, it isn’t.
Simply because all places on Earth with similarly high reflection (Himalaya, Andes, Tibet etc) also are not recommended for use, see UAH’s descriptions of their grid data.
What is rather curious to me is that while UAH’s rev 6.0 only encompasses 82.5S – 82.5 N, UAH’s rev 5.6 provided full 90 S – 90 N data.
You see that only when processing their 2.5 degree grid data, of course.
They got rid of interpolation and use now only observed. The change has to do with what Roy explained at the time of the change. They were inferring earth curvature aperture, and now compute it. Means smaller aperture ‘windows’ so the precise poles now go missing. IMO an improvement.
If they are in polar orbits, the satellites would gather “more” data near the poles than at lower latitudes. Every orbit crosses roughly the same polar regions, while the spinning Earth ensures lower latitudes are much less frequently observed.
This was my assumption, here is the orbit for NOAA-19:
https://www.amsat.org/track/satloc.php?lang=en&satellite=NOAA-19
An old college maths lecturer once told my class, “Interpolate at will, extrapolate at your peril”. He was just trying to guide us students on being too cavalier using tables & charts available to us, as said charts often covered themselves in the small print by stating whether or not such mathematical devices were appropriate to said charts, etc. Just saying!!!
Thus, my jaundiced eye on the claim, “The Arctic is warming faster than the Earth overall.”. How do we know? How many temperature sensors do we have stationed in the Arctic? Remember, there’s a very large Arctic Ocean there at the north end of this planet, so are there anchored buoys with temperature sensors? If the temperatures are derived from shipboard readings, how do we get winter readings? Just how many permanent weather stations exist north of the Arctic Circle? Maps, please, I want to see where they really are!
Even if there were anchored buoys, we still couldn’t get winter time readings. Summer time readings would be problematic as the pack ice moved from one area to another.
the temperature of the water cannot be averaged with the temperature of the air over the land (what we measure vs the temperature of the soil) … unless they are taking the air temp above the water its apples and oranges … and not fit for purpose … Just because you can measure 2 things doesn’t mean you can average those measurements or find any meaningful information from those measurements … date <> knowledge … its just data …
I would even accept temperature readings taken from a weather station atop a mast on an anchored buoy. But does such a thing exist? I think not.
It does in various buoy strings across the equator in the tropical Pacific Ocean.
From what I understand, the global land-sea average is obtained from just averaging all the gridded temps — opples and aranges!
I concur. Here in northern Utah (Midway UT), it is typically 6-8 deg F colder than in Salt Lake City. SLC is just 45 miles away as the crow flies and 2,500 feet lower in elevation than Midway.
Here in rural Alabama, I’m maybe 42 miles from downtown Birmingham, but nearly at the same elevation, give or take a few dozen feet. Yet in the wintertime, such as this past few months, if I leave downtown B’ham after dark, the dash on my vehicle is reading significantly cooler by the time I pull into my driveway (I think the record has been 14º F). And it’s not just because of nighttime cooldown, if I leave my place after dark, the dash is reading a warmer temperature when I get to downtown B’ham. So, no, “extrapolating” the temperatures from a “nearby” station to obtain a number in a location where you don’t have an actual reading is invalid, IMHO.
I’ve observed, with considerable consistency, 10 degrees F variations in a very common ( urban) trip of around 10 miles, including even large variations up and down at several way points. No doubt these are due so some local influences but I have been unable to figure out what they could be by simply looking for something to relate them to.
I live in a town of about 70,000. A 3 mile drive from near downtown to my place near the edge of town, but still inside it, results in about 2F of cooling.
If I sent a single correct number to Berkeley Earth, would their model spit out the rest of the winning lottery numbers for me?
I am not a greedy guy. I would pay for the lotto ticket and happily give 50% of my winnings to Berkeley Earth every week.
If you did that, you’d be out of money in 2 weeks. ;-D
Willis,
Just to lower the tone of this discussion, in Britain’s “popular culture” WAGs are the wives and girlfriends – usually of celebrities, especially of sportsmen, especially of our staggeringly overpaid Premier League soccer players. It’s a slightly derogatory term, encompassing the wholly unfair meme that WAGs tend to be extremely attractive but perhaps “educationally challenged”. I’m sure the USA has a similar descriptive term.
bimbo, arm candy, trophy wife, Kardashian, etc.
Legally Blonde
Only ever dated two blondes in my younger days, but both girls were far from fitting the usual typical description of a blonde!!! Mind you I’ve also met a few dumb brunettes, but they were climate scientists who knew everything about everything, apparently!!! 😉
I am pretty sure that in this instance, he is using SWAG to mean:
scientific wild-ass guess
Stupid wild-ass guess?
That was the term I was familiar with in business. Seen many of them, and usually did not end well.
In the Political realm as well as as the Business World they are “Sophisticated Wild Ass Guess” It is also, often heard referred to as “Forecast” in business, “The Science” or “My Truth” among political junkies. It goes by many names, it is strongly driven by a “feelings thingy” and it is more often than not Wrong.
Same here in Australia … cricket WAGS come to mind, and rugby league. Strangely, the rugby union WAGS tend to be more centred.
Are you sure they weren’t flankered??? 😉
To move the tongue as in gossip. Noun: A Wit or Joker.
Oh I feel so educated, I thought the description of WAG, was to signify what their tongues did on a regular basis, especially to the meedja!!! Dear me!!!
From the graphic, if an individual temperature reading was used for a large area, was it also maximum sample, the average, or a single reading for the entire month?
My guess is that it was the only reading. If it was a ship, and the ship was taking daily readings, the ship would be moving and it would be able to travel a significant fraction of the diameter of that circle over the course of a month. The fact that the circle is so circular means that it was either a single reading, or the ship wasn’t moving.
Who knew that a single ship recording of temperature in the 1800s would lead to moratoriums on natural gas hookups in Berkeley, CA? It’s the advocacy Butterfly Effect.
Talking about ‘ship measurements’ – it took me a while to figure the real beauty of what that Karl character did when he aborted the ARGO data in favour of ships’ engine intakes
At the time, the debate here didn’t really take any form apart from assuming that ‘ships are warm things‘ because they always have great big f**k off engines to push themselves along
But no – ships visit ports to load and unload.
And ‘ports’ are obviously beside the land but more often than not, beside large cities.
Thus the water near those ports will be ‘polluted’ by the Urban Heat Island
Basically= from rainwater run-off, sewage works & drains.
Also always a large river running through bringing genorous amounts of warm water off the surrounding farmland.
And that water will be being sucked through the engines and raising the average temperature as recorded by – whatever ships use for recording.
Cute huh
And they are always the ones to downplay the UHI….
sneakylowlifesdoublecrossingnogoodslimeballsthewhole<expletive>lotofthem
Confined waterways can reach much higher temperature than open ocean surface. The Persian Gulf is a good example.
Open ocean surface is limited to 30C but confined waterways, even at high latitudes, can reach 35C or even more.
Peta, in my opinion the real problems with ship engine water cooling intake go well beyond harbors and UHI. Different ships have different ladings, so different intake depths. And they sail laden, partly laden, unladen. So the depth is never a rough constant. So the whole Karl thing was BS from the beginning.
But bgwx maintains up and down and sideways that it is possible to know these fudge factors—this is called “addressing biases”.
But useful BS. Being useful to whom, though?
…and don’t forget cooling of industrial, commercial and even residential installations.
In 1850 there was no global network of calibrated thermometers or trained thermometer readers. Not in the US and definitely not in the rest of the world except, possibly, the CET. Here, in NY state the official weather bureau wasn’t established until the 1860s. The only temperature data set that might qualify as an accurate record would be the satellite record starting in 1979ish, and that data set is probably not stable or reliable until the mid to late 1980s.
Anyone who thinks that we were gathering temp data accurate to the hundredths of a degree, well, isn’t thinking.
We may have data that is suitable for a trend analysis for, at the outside, 30 years.
NOTE: NY state weather bureau was established in the mid 1880s, not the 1860s.
I still maintain temperature reading a a given only tell you what the temperature at that given point not a mile down the not ten miles down the road, certainly not a 1000 miles down the road. Adding up all the reading from weather stations through the world and dividing them out will tell you nothing about the climate. The accuracy would be + or – 5 C at best. Even worse you would have no idea which direction the earth temperature is going. All you got is red noise and you cannot get a signal out of red noise.
I agree. I can get about a hundred different temp readings at one time around my 1/4 acre lot. Over a 24 hour period, that number would be thousands of different readings. Which one is the actual temp of my 1/4 acre?
The answer is the same as for the CliSciFi crowd, Sal: Whatever you want it to be.
Even worse than that, taking a reading of multiple locations, even as you approach infinity, tells you f*** all about actual heat if you don’t know the amount of moisture in that air, and for the most part, we don’t know. I have found some raw data that includes a passing nod to moisture, but often it’s in R.H., and without a concurrent air pressure, I can’t directly convert that to a mass of water per unit of air, so I don’t really know how much heat is in that air. Why has so much time and energy been wasted to assemble useless data? Wait, if it’s useless, is it even “data”? Or is it just random numbers?
Useless? How many friends has it recruited?
In addition, if its “trapped heat” that we’re supposed to be quantifying, then the max/min temperature readings tell us very little; how long the temperature stays at the given high and low is more meaningful.
So the most accurate long term global temperature estimates would be taking the CET and extrapolating those temp’s about 12,440 miles? Oops, guess I shouldn’t have said that… It might give ’em ideas :<)
Or maybe tree rings. I can read tree
I can read tree rings to 1/1000 of a degree C.
Yeah, but can you code in tree ? 😉
Maybe that’s what they’re doing — reading tree leaves in a cup
“In 1850 there was no global network of calibrated thermometers or trained thermometer readers. Not in the US and definitely not in the rest of the world”
I don’t know if a railroad clerk would qualify as a trained thermometer reader, but I know that railroads kept track of the temperatures at all their various stations up and down the railroad and the temperatures were recorded every day, four times a day, by the train dispatchers, on trainsheets, that would have been saved for posterity (several years anyway)..
So whereever and whenever you have a railroad, you have a temperature history somewhere. Mostly written records of course, and no telling how much of the information was saved.
It would be interesting to compare a railroad temperature history to current versions.
“ I know that railroads kept track of the temperatures at all their various stations up and down the railroad and the temperatures were recorded every day, four times a day, by the train dispatchers, on trainsheets, that would have been saved for posterity”
do these records exist anywhere?
Inference to fill in missing links is the model of modern science widely accepted on faith or force as authoritative. In [Sociopolitical] Scientist [and other Experts] We Trust.
Other than the fact that they are using equations, there is nothing scientific about those wild ass guesses.
Yes, but if they incorporate the equations into a computer model, then those wild ass guesses become SCIENCE!!!
But re equations
Willis:
How is “coverage” defined? At least one reading per gridcell?
They’re claiming that in 1850 they had almost 90% coverage for ocean areas? Really? The only way I can imagine that being true is if they’re including readings from non-US ships, especially British. In 1850 US naval presence in the Western Pacific was negligible and merchant traffic was a small fraction of British and Dutch shipping at the time.
In which case, why would coverage drop so sharply during the US Civil War?
If you declare that each reading is good for 1000 miles around the sensor, then it doesn’t take a lot of ships to cover most of the ocean.
Were they using equipment calibrated to a precision o thousandths of a degree? How about the “readers” of that equipment? Sampling density may be the discussion here but, if temps were taken by someone sticking their finger in the water, it’s all crap. Some later part of the satellite data may be meaningful if, in fact, trying to reduce all of the readings to a single global average temperature has any value at all. Hint: it doesn’t have any value.
A GAT is a worthless figure for anything. The world doesn’t exist where that temperature exists.
GHG/CO2 predicts a tropospheric hotspot that has never been found. Plus the tropics will not experience much of a change. The hotspot is to raise the gradient toward the poles thereby raising temperatures all the way to the poles. A gradient is not a single temperature. It changes all the way throughout. That is what we need from a temperature projection, a gradient.
Great find, WE. I concluded BEST was untrustworthy while writing essay ‘When Data Isn’t’ in ebook Blowing Smoke. Two examples suffice.
In the official language of the Keepers of the Trends, this is called “addressing biases”.
Might as well be reading tea leaves, about as useful.
Hilarious, Rud, and totally unsurprising.
w.
“Arguably the best maintained station in Australia is at the Rutherglen Ag Research Station, beginning in 1913 at a never moved always well maintained rural research location.”
That is not arguable. Rutherglen was not even a GHCN V3 station. It has a gap in the 1960’s, from which it did seem to emerge in a different place. There are plenty of stations in Australia, like Cape Otway, and of course the capitals, that have records back to the 1860’s.
A good example of cooling.
NS, you are repeating the excuses BOM made after Jen caught them out on homogenization. Unfortunately simply not so.Jen went and interviewed the professor emeritus who had been in charge of the station from the early 60’s. Go to her blog and read all about it.
Jennifer interviewed Bill Johnston. He is not and never was a professor, and he was never in charge of the station. He says he used to go to the Ag Research Station to perform experiments.
Here is the BoM graph of the record, with and without ACORN adjustment. It has a gap from about 1955 to 1965. This is not “the best maintained station in Australia”.
Why the abrupt change in the difference in minimum temps between 1965 through 1975?
Why the large adjustments between 1912 and 1955 in the minimum temps?
Curious. Here’s the GISS data (adjusted and homogenized) for the same period.
It shows that the gap is exactly 12 months long, the full year 1964, not ten years. No clue why the difference.
It’s worth noting that the “adjustment” cooled the past by up to TWO AND A HALF DEGREES …
Welcome to the wild world of “adjustments” …
w.
This is exactly why changing recorded historical data is wrong. The posts here show there are no standard “corrections” being made to the raw data. That in itself is a condemnation of the process. Different people having different “ideas” about how the data should be changed is not based on science.
If data is not fit for purpose is should simply be discarded, not modified with guesses as to what it should be. Since we can not yet go back in time to take new measurements, put it in the trash can.
Yes, that’s where we get human-caused global warming: From the computer adjustments. The Data Mannipulators turn a benign temperature profile into a “hotter and hotter” Hockey Stick profile.
It’s fraud.
How is it possible that a trained scientist at a research station can be so inept at reading temperatures as to be off by 1.5C / 2.7F?
“You had one job…!”
Shenanigans!
“Rutherglen was not even a GHCN V3 station. It has a gap in the 1960’s, from which it did seem to emerge in a different place.”
The official ACORN-SAT catalogue clearly states that there has never been a site move at Rutherglen.
No, they say there have been no documented site moves. They believe, with evidence, that a site move some time before 1966 is likely.
“Likely.” There’s the favorite alarmist weasel word again…
“In subsequent correspondence with Lloyd the Bureau claimed the remodelling was necessary to make the temperature series at Rutherglen consistent with other temperature series in that region. Yet the cooling trend in the minima at Rutherglen are consistent with temperature series from the nearby weather stations of Deniliquin, Echuca and Benalla.”
Marohasy J., 24 February 2022, Australia’s Broken Temperature Record – Part 2
You mean when Hockey Stick chart proponents sing the praises of the BEST data we should take that with a grain of salt?
Those Hockey Stick proponents talk like BEST is the epitome of accurate temperature data.
Yes, I’m being sarcastic.
Interesting. I thought but I can’t recollect where I read this, there was only one weather station in the whole of the Southern Hemisphere in 1850 and that was at Jakarta?
Don’t think that is true. Sparse, but there were by 1850 several stations in major South American cities. Of course, their quality was probably poor.
Yeah, we have not even begun to discuss error bars for that database. But just in passing, imagine this… analog mercury thermometers have two uncertainties: 1) how accurately can the thermometer actually measure the air temperature? and 2) how accurately can the observer read that temperature? And if it’s a chilly but windless day, by the time he has opened the weather station door, secured it so it doesn’t slam closed on his fingers, gotten out his glasses and adjusted them to the bridge of his nose, all while energetically exhaling, since the weather station was uphill from his cabin, how much has he warmed it before he even gets a chance to take a look at it? So, just off the top of my head, I would say a mercury thermometer is no more accurate than ±2° C, and that reading it, even with the best lighting and the best eyesight, can get no closer than ±0.5° C. And those are additive, not subtractive, or even a product.
An additional concern is whether those 19th C thermometers were handmade and how consistent the diameter of the hole was. If the hole varied in diameter along its length, then simply scribing a scale with equidistant spacing between freezing and boiling water would result in varying accuracy along the stem.
A glass thermometer has a fair bit of mass, a few seconds of puffing on it won’t warm it up much.
On the other hand, these thermometers only had markings for each degree, and the observer had to use his best judgement as to whether to round up or round down, as the data was only recorded to the nearest degree. Even if the thermometer was perfect and the reading of the thermometer was perfect, the best accuracy that you could get was +/- 0.5 degrees.
The best uncertainty is +/- 0.5 degrees because that is the way it was recorded. That doesn’t include the uncertainty in the reading. Was it really 0.49 (down) or 0.51 (up). That is an additional uncertainty that is seldom discussed.
Funny how when anomalies are calculated, additional information is added to the resolution that was recorded. As if by magic, one or two decimal places of additional information appear to make the resolution increase by 10 to 100 times what was actually read and recorded.
When someone says 2021 was 0.025 degrees warmer than temps in 1930 I can’t keep from laughing. These people would never make it in the real world where measurements are critical. Can you imagine a mechanic building a Formula I engine that revs to 13,000 rpm adding several digits of precision to his measurements because of averaging?
“Kiwiville”
LOL.
Willis, have you checked to see in the Berkeley coverage was randomly distributed since day1? (Unlkely)
If not, then it would be possible that a trend in average temperature by year could be a result of uneven changes in coverage skewing the average temp over time, independent of any actual change in average temps.
The effect might be big. Might be small, but if nothing else check if there is coverage migration towards or away from the equator. Migration towards or away from land.
Yes! You are basically addressing time series analysis and stationarity. If stations are added into the mixture that are warmer than the previous set of data, you automatically introduce a warming trend.
From this link:
https://towardsdatascience.com/stationarity-in-time-series-analysis-90c94f27322
Agreed. Some might think gridding solves this but in reality it masks it. Think of it this way. If we look at the function for average temp it resembles a cos/sin function. With sparse coverage it resembles the modified sine wave of a cheap DC/AC converter. With full coverage it resembles the full sine wave of a good DC/Ac converter.
Check these two types of DC/AC converters. I expect they have different operating voltages along the curve to deliver 120VAC (RMS).
If so, then the same problem affects global average temperature.
Now add to this the problem of some parts of the curve being a modified sine wave and other parts a full sine wave
Based on your video, I think they should have averaged measured temperatures over entire zones of latitude. Your video clearly shows the annual north/south shift in temperatures. Just using four zones and skin surface temperatures back to 1948 would be informative.
The sparse data around Australia at the beginning suggest US ships were the source of the data. US clipper ships were being built at 1000 per year from 1848 to 1858. Then the massive drop during the civil war pretty much confirms it.
There uncertainty, 95% confidence interval, goes from 0.15°C before the civil war to 0.15°C after it starts.
This was before standardised screens came into use, so land temperatures can’t be that precise.
“The effect of screen height has been investigated by a number of workers and
all give consistent results. Hellmann (1922) compa~ed two identical screens in
Potsdam exposed 2.3 m apart,one with the thermometer bulb at 2.08 m and the other
with the thermometer at 1.4 m above the ground. The maximum temperature was generally
higher, and the minimum lower, in the lower screen. The largest monthly mean differ-.
ence in the maximums was 0.4° C in May and the largest individual difference was 0.8°C
also in May. The largest monthly mean difference in the minimum temperaturewas0.28°C
in July and the largest individual difference was 0.7°C in March. The amplitude of
the diurnal temperature change was generally larger in the lower screen. The minimum
difference in the monthly mean amplitude was 0.09°C in November and the maximum 0.66°C
in May and July.”
https://library.wmo.int/doc_num.php?explnum_id=8131
They are looking at anomalies rather than actual temperatures but it does give you an idea of how changes other than climate affect the readings.
Robert B:
What is your source for this figure? 1000 per year for 10 years sounds way high. The major shipyards at the time were Portsmouth, Boston and New York and I doubt between them they could produce even a tenth of that figure. According to the Wikipedia article, at the height of the clipper ship there were 200 rounding cape horn.
US clipper ships pre-Civil War were build for the east coast / west coast trade, not the western pacific. The California gold rush made this run quite profitable. This is why they died out after the trans-continental railway was completed. In 1849 Britain allowed US ships to compete on the China to London tea trade, so there were some US ships in the western pacific.
In 1854 the Flying Cloud set the record for anchor-to-anchor New York to San Francisco transit with a time of 89 days 8 hours (that’s half a baseball season!). This was before the Panama Canal of course, so she had to sail all the way around South America. That was about half the time of regular packet ships of the time. Once the railway was completed, the same transit took about 84 hours.
400 000 tons at 200-400 ton each
A rough guess and the single measurements in the South Pacific are consistent with rare trips down there. I’m postulating why a rise then sudden drop in global coverage. The measurements in some ocean areas doesn’t drop off. Maybe whalers.
Willis,
“And there’s no island anywhere near the center of that circle, so it would have been a temperature taken from a ship …”
Raoul Island, part of the Kermadec group, is near the centre of that circle, and has a New Zealand government meteorological station sited there.
That doesn’t detract from your observations of course.
Update – that weather station was established in 1939, so who knows where the 1850 “reading” came from?
Thanks and good spotting, Ray. It’s only about 150 miles from the center of the circle, might be from there. It’s possible that it was some kind of expedition or something.
w.
” it makes all conclusions about the climate very tentative”
In terms of what we know about climate, the fact that we don’t have many observations in 1850 detracts very little. Or even 1900. It would be nice to no more, but nothing really hangs on it.
“But is extrapolating the temperature of an area of the ocean the size of the continental US from one single temperature measurement a reasonable procedure?”
It is the evidence you have. It isn’t ideal, but it isn’t nothing. I would not myself go back to 1850; my TempLS starts in 1900. But the lack of coverage is reflected in the uncertainty. BEST gives the January 1850 anomaly as -0.760±0.435°C. That is, σ=0.435. They do the calculation – you decide what to make of it. I don’t think the world is any worse for BEST having told us that.
But Nick, the entire narrative is that it has been warming X C since 1850 but we have no reliable, accurate baseline. People are guessing on 1850 and decades after. I’ve looked at the coverage on land and by ship lanes and reliance on the Challenger expedition and they are all jokes.
The whole thing is a joke that we have good data for anything pre 1900 and some of stuff post 1900 is absurd.
“But Nick, the entire narrative is that it has been warming X C since 1850”
That isn’t the entire narrative. It isn’t the narrative at all. The narrative since Arrhenius has been that burning carbon will make the world warmer. Support comes from the fact that since we have been burning C, increasingly over the last century, the world has warmed. 1850 has no part in that.
That’s only half the narrative. It ignores the fact that the current warming period started about 1700, the depth of the Little Ice Age … and CO2 was not a factor in the first two centuries of that warming.
w.
And so it should. The narrative is that emitting CO2 will cause warming. It doesn’t say that nothing else will cause warming (or cooling). We’ve emitted CO2 and it has warmed.
As someone who claims to be a scientist, you should be aware that correlation does not prove causation.
Indeed. But ia successful prediction supports a hypothesis.
That was an even money bet.
It’s not even an even money bet, as the smart money usually predicts that whatever has been happening will continue to happen. It had been warming for around 200 years at that point, assuming that the warming would continue would be the safe bet.
Who predicted the 21st Century slowdown in global temperature rises while atmospheric CO2 concentrations continued their upward climb?
We are still waiting for that successful prediction.
Nick Stokes: “Indeed. But ia successful prediction supports a hypothesis.”
WR: A hypothesis is only correct if it is proven that all other possible explanations fail.
It seems that in the case of climate only one option has been considered. In that case: no conclusions can be drawn. The clear statement for the outside world should be: “We absolutely don’t know. No policy should ever be based on the preliminary results regarding just one option”.
Nick Stupes, you’re being disingenuous. The issue isn’t the mere prediction of warming it’s the magnitude. On that score, almost all predictions have failed.
That statement is typical of why I call you a sophist. You don’t provide numbers. You acknowledge that other things can cause warming. It is important to know how much CO2 and other things warm the Earth because if the ‘other things’ are dominant, and the CO2 influence is negligible, then the observation, that warming has occurred along with CO2 emissions, can be coincidence (spurious correlation). You have provided no rigorous evidence to support your conviction that CO2 is responsible for the warming.
Thanks for the astute observation, Nick. Now, please give us precise values for CO2 TCR and ECS. And while you’re at it, please give us an accurate cost/benefit estimate of the Western nations going to Net Zero by 2050.
There have been times in the past when CO2 went up a lot, yet temperatures plummeted.
There have been times in the past when CO2 went down a lot, yet temperatures soared.
There have also been times when CO2 went up and so did temperatures and times when CO2 went down and so did temperatures.
That you continue to push the claim that the fact that temperatures have continued the 300 year climb since the bottom of the Little Ice Age while CO2 levels have also risen over the last 70 years, proves that CO2 caused the temperatures to rise.
Correlation is not causation. We’ve invented toasters too, the toasters are obviously causing the warming.
Only the “warming” happens BEFORE the CO2 increase. Cart before the horse.
The narrative is that there is a ‘climate crisis’ caused by human CO2 emissions that must be eliminated within thirty years whatever the cost.
That was a reply to Nick Stokes.
Is that Nick who’s downvoting every reply to him?
Maybe Anthony should consider changing the counter so that only those who comment can vote.
I know, he can let me approve who does and does not get to vote.
I thought even by alarmist science that c02 levels, regardless of what caused them to rise, did not get to the levels needed to be noticeable until at least 1950?
Warming started 100-200 years before that.
That’s still where the narrative falls apart?
Come on, of course it is. I read newspaper articles all the time that use that date as a baseline. I read studies all the time that reference that beginning point.
I can’t believe you are saying that.
I read a study the other day that said “Our best guess is….” Good for them. They were being honest. There is a false narrative out there. It’s an illusion of certainty. It’s portrayed everywhere that the scientific community knows when in actuality they only think they know and are really guessing.
Stokes,
You miss the point that the “narrative” is really a hypothesis. We are interested in empirical measurements that will support that hypothesis. You offer us “the world has warmed.” I’d like to see trustworthy numbers, particularly if alarmists are going to make the claim that the warming commenced with the Industrial Revolution. To establish correlations, and to be able to make predictions, we need numbers, not hand waving.
The narrative during the 1960s-70s was a looming ice age.
Mr. Hanley: As a repeat commenter here, I have my own “I stopped believing Mr. Stokes when…” story, as others here share above. I lost faith in his comments when he said that the ’70s ice age scare was purely in the press, no scientist followed that line. Posters shared multiple articles regarding various scientists of the day (some guy named Schneider came up, as I recall, but many others). Mr. Stokes stayed with the lie after it was exposed. I respect that he’s smart, but he gets thick at times when he’s caught out. and he’s caught out here.
It Is Difficult to Get a Man to Understand Something When His Salary Depends Upon His Not Understanding It.
“Support comes from the fact that since we have been burning C, increasingly over the last century, the world has warmed.”
The world has cooled during that time, too. You seem to have missed that.
It cooled by 2.0C from 1940 to 1980 and it has cooled by 0.7C since 2016/2020.
Mr. Abbott: Indeed. I’ve also seen articles describing WWII shipping across the NW passage and N of USSR that demonstrate the warmth of the 30’s, not just evidence but overwhelming physical evidence that it was warmer then than now; and of significant cooling since then, during the very time CO2 kicked into a higher gear after 1950. I would allow that it has warmed since 1970 (based on conditions up north, not on fiat BEST numbers) if Mr. Stokes would allow that the cooling you mention (1940-80) occurred. If he does that, he loses the “narrative” that he can’t identify above. He is aware of this.
The “narrative” based on the great Arrhenius ignores the part he got right – that IF burning carbon increased the Earth’s temperature, the climate would be improved by the warming.
In a Scottish Court the verdict in the case against CO2 on evidence like this would get the Verdict “Not Proven” if not actually “Not Guilty”
Although historically it may be a similar verdict to not guilty, in the present day not proven is typically used by a jury when there is a belief that the defendant is guilty but the crown has not provided sufficient evidence. Scots law requires corroboration; the evidence of one witness, however credible, is not sufficient to prove a charge against an accused or to establish any material or crucial fact.
https://en.wikipedia.org/wiki/Not_proven
With many misscarriages of justice in the rest of the UK there are good arguments for keeping the Not Proven verdict
I almost wish the U. S. had that option, but then it’s sort of damning to have a verdict of “Not Proven” following you around if you are really and truly innocent. But, having to select only between Guilty/Not Guilty provides results such as a juror after the Michael Jackson child-molestation trial said, “I can easily believe Michael Jackson had improper relations with minor children. The prosecution failed to prove that.” (I went from memory, I couldn’t find the quote.)
HAHAHAHAHAHAHAHAAH—from dry-labbed data, thanks for the laugh.
Another way of stating that is, -0.760±57%. Would anyone be happy getting their monthly bank statement with the balance being shown as ±57%? And, that is a 68% probability of being in that range. Increase it to two sigma, and your bank balance might be negative!
Nick Stokes February 23, 2022 12:08 pm
The climate models are tuned to match the historical record. So yes, they “hang on it”. And all of the hype is about the “warming since pre-industrial times”, which are usually taken as 1850-1900 … so that hangs on it as well.
Next, I said:
You replied:
Miss the point much? That is NOT the “evidence we have”. The evidence we have is a reading of one temperature somewhere north of New Zealand. That and only that is “the evidence”. The question is, is it valid to extrapolate that scrap of evidence to an area the size of the continental US?
I’m always quite suspicious of these claims of uncertainty. For example, if you use (as they did) one thermometer reading to estimate the temperature of an area the size of the continental US … what is the uncertainty in that result? It certainly won’t be small.
I’ve discussed this question before with respect to the Argo floats. They claim they measure the temperature from 0-1800m with an error of ±0.002°C. Now, there are ~4000 Argo floats. To get an additional decimal of error you need 100 times the data points. This would imply that we can measure the top 1800m of the ocean with an error of ±0.02°C with 40 floats … and that one single solitary float can measure the top layer of the ocean to ±0.1°C …
So me, I put exactly zero credence in their claims that they can measure the global average temperature to ± less than half a degree in 1850 …
… just for fun, I went to take a look at how many of their land-based datasets cover January 1850.
In any case, of the 97,274 records they used, exactly 49 of them cover January 1850.
w.
“The climate models are tuned to match the historical record.
So yes, they “hang on it”.”
They are not tuned to match the historical record of global surface temperature anomaly.
“That and only that is “the evidence”.”
Isn’t that exactly what I said.
“is it valid to extrapolate that scrap of evidence
to an area the size of the continental US?”
They are not giving a result for that area. They are giving a global average. The sparsity of data there will contribute to the uncertainty of that average.
Nick Stokes February 23, 2022 4:10 pm
They absolutely are tuned evolutionarily to match the historical record. Models that cannot reproduce it are either adjusted until the do match it or discarded.
How else can you explain the fact that Dr. Kiehl pointed out, all the models are able to do a reasonable job reproducing the past, but they all have very different climate sensitivities?
If so, it was far from clear.
Huh? They are giving us a result, which is a temperature, for that area which is the size of the continental US. It’s gridcell by gridcell values over the whole area shown as the red circle. How is that not a “result”??
w.
Willis, I’ve come to the conclusion that Nick wants people to shadowbox with his words. He makes sciency sounding statements that imply a general truth, whereas complete facts run counter to his CliSciFi narrative. He is just blowing Rud’s examples of ideological smoke.
OMG that comment makes it even worse, how do you get a global average from so few points?
I can tell you that growing up in the very northern part of NZ, not in the 1850’s but the 1950-70 that the difference in temps from the north to the edge of that circle is HUGE, sorry really have to wonder
Are my eyes playing tricks on me? That chart appears to be showing the number of data points out to 2050.
Thanks, fixed.
w.
“” it makes all conclusions about the climate very tentative”
In terms of what we know about climate, the fact that we don’t have many observations in 1850 detracts very little. Or even 1900. It would be nice to no more, but nothing really hangs on it.”
The really important thing is that it was just as warm in the Early Twentieth Century as it is today, and we have good records of that.
Seeing as how it was just as warm in the Early Twentieth Century as it is today, that would mean that CO2 has had little effect on the Earth’s temperatures since that time, even though CO2 levels have increased since that time. CO2 increased, but the temperatures did not.
It was warmer in the 1930’s in the United States than it is today. The United States has been in a temperature downtrend since the 1930’s. No CO2 warming to see here.
Hansen said 1934 was 0.5C warmer than 1998, and that would also make 1934 warmer than 2016, too, since 1998 and 2016 are tied for the warmest year in the satellite era (1979 to present).
The Early Twentieth Century. That’s the ticket!
But that +0,435 means that current warming has an attribution of that same amount as natural variation. That means that CO2 has not caused as much warming as claimed.
OTH, if it means that -0.435 is the actual, then much more warming occurred before CO2 became a problem and even more natural variation is part of the current warming.
No wonder no one wants to show uncertainties and error bars.
“That means that CO2 has not caused as much warming as claimed.”
Nonsense. It just means you don’t have many measurements in 1850.
Since the claimed warming includes the temperatures back to 1850. If the temperatures back to 1850 aren’t known to the accuracy claimed, as you are now admitting, then they can’t be used to calculate how much the earth has warmed. Therefore the so called warming can only be measured from a time that is closer and by your charts warmer. Which reduces the amount of known and proven warming.
Nick, what’s the matter, lately your excuses and evasions have grown down right pathetic.
“ If the temperatures back to 1850 aren’t known to the accuracy claimed, as you are now admitting”
In fact it was I who pointed out what the accuracy claimed actually is.
The major indices, except HADCRUT, go back only to 1880.
When you’re making it all up then you don’t need any observations at all.
I cannot believe there is no archive of the logs of the tens of thousands US warships in the Pacific with daily position and weather conditions during WW-II.
At its peak in WWII the US had 827 surface warships. HOWEVER, at any time a number were in port, and the rest were organized into battle groups of 1 – 3 dozen ships … in the Battle of the Coral Sea, the US had 53 surface ships. In general, a battle group are all in close proximity, so one weather report would have covered all of them.
w.
Apparently NASA does not believe that there was sufficient temperature record keeping on a large enough scale to be meaningful prior to 1880. So all the talk about 1850 as a baseline is not really meaningful at all.
The many thousands of floating thermometers were found to have cooler Ts than ships which were used before them. They aren’t talked about much.The CO2 satellite launched with much fanfare showed things like the Congo rain forest and other unexpected places as main emitter of CO2. This poor satellite, still shiny and new, is floating around in the cold, lonely, unloved and unconsulted. The sea level satellite that swung the 150 yr old record upon a new upswing is a star, idolized, adored.
These guys even cherry pick satellites.
I watched Australia too. I grew up in Adelaide in the 60s to 80s. It’s always so damned dry in Adelaide that you watch the weather every night, in prayer for rain.
So as I watched Berkeley, I could only laugh. To use a Melbourne temperature average to glean anything meaningful about Australia is, well, I’m afraid I’m not creative enough to provide an analogy extreme enough to explain how utterly foolish it is.
like the rest of this CAGW story, the Berkeley temps are just codswallop.
Well its instructive also to see the very wide cherry red equatorial region ~30C in 1850. I guess a cooler planet means fewer clouds so your governor also works to restrict cooling. I was in Lagos, Nigeria in 1966 and again in 1997 and it was 30C both times.
In my opinion there were simply not enough temperature stations in the world to make meaningful statements about world temperature in 1850. Who was monitoring temperature in Africa, south America, or Antarctica or over the oceans (70% of the earth’s surface)? And did the stations that exist meet the requirements for locating the thermometer?
For scientific work I believe radiosondes (judiciously), satellites and ARGO are the only datasets to be used. Each shows that nothing unusual is occurring within the Earth’s climate.
not fit for purpose … period … they are NOT measuring the globe … they have a tiny number of thermometers (relative to the globe) that they have extrapolated to “cover” the globe …
Goodness, the maximum and minimum surface temperatures were recorded accurately and daily over ~95% of the global oceans in 1860, that’s amazing!
I am not shocked but I wonder how on Earth they managed to get readings that claim to cover 50% of the globe in 1850.
There is one reliable SST data set on the Australian coast for 1871. It was produced measuring bucket samples taken every hour from 6am to 6pm during the voyage. I have attached chart showing up and down tracks compared with 2019 satellite tracks over the same latitudes and longitude for the separate weeks corresponding to the up and down trips.
An interesting detail is the spike in the Brisbane river. It gives the clue to why cricket size hail stones have been observed in Brisbane.
If SST could exceed 30C in open oceans then boats in tropical waters could be showered with massive hailstones. The maximum convective potential is a function of the surface temperature and updraft velocity is a function of the potential. If ocean surface got to 40C, as some models predict, then hailstones would be the size of footballs.
Doesn’t this still point to the same lack of data such that in Hansen’s 1998 paper he showed usa and world temps since 1880 graphed side by side. The USA with much better data shows little warming, while the world looks completely different, much steeper rise. But assuming that is not adjusted data, doesn’t it just reflect that most of the historical world readings are all from major cities only and those few samples are just extrapolated out to homogenize the data such that what we are really seeing is all urban heat island effect?
@Willis: and then there is the even more esoteric…SEWAG….. Scientifically Educated Wild Ass Guess…. which I suspect the good folks at Berkeley Earth Systems are employing.
Let’s extend that to SEWAGE….. Scientifically Educated Wild Ass Guess (Egregious)
“(Egregious)” -> “(Extrapolated)”
It’s my guess that the ‘Scientists’ at Berkeley Earth got paid a goodly fee for their Bag of SWAG, even if it was totally inaccurate.
A swag bag?
As an engineer I often modified a Confucius saying about watches to one about temperature measurement to: Confucius say, “Man with one thermometer knows what the temperature is. Man with two thermometers has no idea what the temperature is.”
Here is a new one. Confucius say, “Climate Scientist with no temperature measurement can make temperature anything he wants.”
I had no idea that the historical temperature record is this sketchy. The corruption is worse that I thought!
It would be an encouraging gesture of transparency were Eschenbach to provide the ACTUAL data set and the ACTUAL chart parameters he uses to create his graphs. His refusal to do so in addressing previous requests is telling.
Willis always provides the data. The two previous times when you made this demand, the article in question wasn’t even by Eschenbach, however the article did contain a link to the actual article in which the source of the data was given. For this article, every single chart is labeled with where it was acquired. Perhaps if for once, you actually bothered to read the article, you would already know that.
As a troll, you are going to have to work much harder to reach the standards set by our existing menagerie.
Barry, there is a link at the bottom of each graph to the exact source of the data that I used. In this case, it’s the Berkeley Earth NetCDF file. Go get it, it’s on the web, and you can confirm or falsify my claims.
And no, as far as I know, I have never “refused” to provide data.
w.
>>Barry, there is a link at the bottom of each graph to the exact source of the data that I used.<< Allow me to clarify. I would be very grateful if you can provide a package of the EXACT data file used in your charts AND the exact parameters you used in your charting software of choice to render those charts. I can work with virtually any spreadsheet, MathCAD, ModTRANs, etc. My email address is barryanthony35@aol.com. There should be no concern about sending a file 5 MB or smaller. Thanks in advance.
Mr. Anthony: You are not “clarifying”, you are making a new request. Your first post didn’t ask for anything, it whined about previous requests. MarkW showed you that your previous requests were, in fact, misdirected. Maybe you should “clarify” that while you wait for Mr. E’s polite reply.
Troll wants everything handed to it on a silver platter. The source of the data is given. Get it yourself.
BTW, AOL? LOL? I didn’t know they were still in business.
Barry, you don’t seem to understand, so I’ll go over it again.
The EXACT data file I used is the NetCDF listed at the bottom of each of the charts. It contains both the month-by-month gridded temperature data, as well as the gridded 12-month climatological temperature data used to create the anomalies.
I do not use “charting software”. I use the computer program “R”. Here, for example, is the program I wrote to make the animated GIF shown as Figure 3.
# Animation —–
library(animation)
clrconsole()
animap=function(){
for (i in 1:(12*20)){
print(i)
(thedate=paste0(month.name[(i-1) %% 12 +1],” “,
1850+floor((i-1)/12)))
toanetmap=climatplus[,,i]
drawworld(
toanetmap,point.cex=6,cex.title = 1.6,
legend.cex=1.2,
subsize=1.2,
mincolor = -50,maxcolor = 30,
subline=-2.7,theunits=”°C”,
subtext=subtextberkgridall,
titleline=-3,titlespacing=4,
titletext =
paste0(thedate,
“, Berkeley Earth Coverage”)
)
}
}
oopt = ani.options(interval = .25,
ani.width = 960,
ani.height = 720)
saveGIF(
animap(),
movie.name = “berkeley earth coverage.gif”,
img.name = “Rplot”,
convert = “convert”,
cmd.fun = system,
clean = TRUE
)
# end ——————-
This in turn depends on a couple other functions that I’ve written, which are “clrconsole” and “drawworld”.
“clrconsole” just clears the console. “drawworld” does the heavy lifting. Here it is:
# drawworld ———————
drawworld=
function(
themap,
maxcolor = NA,
mincolor = NA,
titletext = “Dummy Two-line\nTitle”,
roundto = 0,
cex.title = .9,
titlespacing = 2,
titleline = -3,
# cex.title = 1,
# titleline = -1.7,
# titlespacing = 1.6,
printavgs = TRUE,
isweighted = FALSE,
printunits = TRUE,
theunits = “W/m2”,
thebox = NA,
printlegend = TRUE,
reversecolors = FALSE,
rotation = 0,
oceanonly = FALSE,
point.cex = 3,
whichglobe = “l”,
linecol = “black”,
thepch = “.”,
colorlist = c(“blue”, “cyan”, “green3”, “yellow”, “orange”, “red3”),
uselist = F,
thebias = 1,
latlines = NA,
headlist = NA,
legend.cex = .85,
subline=-.3,
subsize=.9,
subtext=”DATA: CERES EBAF 4.1 https://ceres.larc.nasa.gov/data/“,
plotreset=T
) {
# oldmar=c(0,0,0,0)
par(font=2)
if (whichglobe != “l”)
latmatrix = latmatrixold
if (length(dim(themap)) == 3)
themap = arraymeansall(themap)[, , 1]
rowcount = dim(themap)[1]
columncount = dim(themap)[2]
yint = 180 / rowcount
xint = 360 / columncount
legendlabel = paste0(” “, theunits)
if (printunits == FALSE)
legendlabel = ” ”
par(mai = c(.05, .05, .05, .05), cex = 1)
masklong = seq(-179.5, 179.5, 1)
masklat = seq(89.5, -89.5, -1)
globallongs = matrix(rep(masklong, 180), nrow = 180, byrow = TRUE)
globallats = matrix(rep(masklat, 360), nrow = 180)
if (is.na(maxcolor))
maxcolor = max(themap, na.rm = TRUE) # ————lowlow
if (is.na(mincolor))
mincolor = min(themap, na.rm = TRUE)
colormin = mincolor
colormax = maxcolor
# choose which trends
if (reversecolors)
colorlist = rev(colorlist)
# colorlist=c(“blue4″,”blue”,”cyan”,”yellow”,”red”,”red4″)
color.palette = colorRampPalette(colorlist, bias = thebias)
mycolors = color.palette(100)
# mycolors=rainbow(27)
cvalues = matrix(oneto100value(themap), nrow = 180)
colormat = matrix(mycolors[oneto100value(themap, mymax = colormax,
mymin = colormin)], nrow = 180)
# themap=testmap;rotation=180
avgdec = roundto + 1
# calc averages——–
if (!isweighted) {
# bylatmedians=apply(themap,1,median,na.rm=TRUE)
# gavg=round(weighted.mean(bylatmedians,latmatrix[,1],na.rm=TRUE),avgdec)
# nhavg=round(weighted.mean(bylatmedians[1:90],latmatrix[1:90,1],na.rm=TRUE),avgdec)
# shavg=round(weighted.mean(bylatmedians[91:180],latmatrix[91:180,1],na.rm=TRUE),avgdec)
# tropavg=round(weighted.mean(bylatmedians[67:114],latmatrix[67:114,1],na.rm=TRUE),avgdec)
gavg = round(weighted.mean(themap, latmatrix, na.rm = TRUE), avgdec)
gavg
nhavg = round(weighted.mean(themap[1:90, ], latmatrix[1:90, ], na.rm =
TRUE), avgdec)
shavg = round(weighted.mean(themap[91:180, ], latmatrix[91:180, ], na.rm =
TRUE), avgdec)
tropavg = round(weighted.mean(themap[68:113, ], latmatrix[68:113, ], na.rm =
TRUE), avgdec)
arcavg = round(weighted.mean(themap[1:24, ], latmatrix[1:24, ], na.rm =
TRUE), avgdec)
antavg = round(weighted.mean(themap[157:180, ], latmatrix[157:180, ], na.rm =
TRUE), avgdec)
# bylatland=apply(themap*seamaskarr[,,1],1,median,na.rm=TRUE)
# bylatlandweights=apply(seamaskarr[,,1],1,sum,na.rm=TRUE)*latmatrix[,1]
gavgland = round(weighted.mean(themap * seamask, latmatrix, na.rm =
TRUE),
avgdec)
# bylatsea=apply(themap*landmaskarr[,,1],1,median,na.rm=TRUE)
# bylatseaweights=apply(landmaskarr[,,1],1,sum,na.rm=TRUE)*latmatrix[,1]
gavgsea = round(weighted.mean(themap * landmask, latmatrix, na.rm =
TRUE),
avgdec)
} else {
gavg = round(mean(themap, na.rm = TRUE), avgdec)
nhavg = round(mean(themap[1:90, ], na.rm = TRUE), avgdec)
shavg = round(mean(themap[91:180, ], na.rm = TRUE), avgdec)
gavgland = round(mean(themap * seamask, na.rm = TRUE), avgdec)
gavgsea = round(mean(themap * landmask, na.rm = TRUE), avgdec)
tropavg = round(mean(themap[67:114, ], na.rm = TRUE), avgdec)
arcavg = round(mean(themap[1:23, ], na.rm = TRUE), avgdec)
antavg = round(mean(themap[168:180, ], na.rm = TRUE), avgdec)
}
# rotateit —————————————————-
# rotation=-45
therot = 180
if (rotation != 0) {
# if (rotation>0){
if (rotation > 0) {
themap = themap[, c((rotation + 1):360, 1:rotation)]
} else {
themap = themap[, c((360 + rotation + 1):360,
1:(360 + rotation))]
}
therot = rotation + 180
if (therot > 360)
therot = therot – 360
# } else{
#
# }
if (therot == 360)
therot = 0
}
newworld = redo.map(“world”, therot)
maps::map(newworld,
projection = ‘mollweide’,
interior = F,
col = linecol)
#,orient=c(90,therot,0),interior=F,wrap=T)# draws the map outlines
temp = mapproject(globallongs,
globallats,
“mollweide”,
orientation = c(90, therot, 0)) #translates to map coordinates
lines(
temp$y ~ temp$x,
type = “p”,
pch = thepch,
col = colormat,
cex = point.cex
)#10*latmatrix) #colors the map
maps::map(
newworld,
projection = ‘mollweide’,
interior = T,
col = linecol,
add = T
) #redraws the lines
if (length(thebox) > 1) {
temp = mapproject(thebox$longs,
thebox$lats,
“mollweide”,
orient = c(90, therot, 0))
lines(temp$y ~ temp$x,
lwd = thebox$linewidth,
col = thebox$boxcolor)
}
mylats = seq(-90, 90, 5)
mylongs = rep(90, length(mylats))
temp = mapproject(mylongs, mylats, “mollweide”,
orientation = c(90, therot, 0))
newlongs = temp$x * 2.005
lines(temp$y * 1 ~ newlongs, lwd = 2.5)
newlongs = newlongs * -0.9999
lines(temp$y * 1 ~ newlongs, lwd = 2.5)
temp = mapproject(c(-90, 90), c(0, 0), “mollweide”, orientation = c(90, therot, 0))
newlongs = temp$x * 2
lines(temp$y ~ newlongs)
temp = mapproject(c(-90, 90),
c(66.55, 66.55),
“mollweide”,
orientation = c(90, therot, 0))
newlongs = temp$x * 2
lines(temp$y ~ newlongs, lty = “dashed”)
lines(-temp$y ~ newlongs, lty = “dashed”)
temp = mapproject(c(-90, 90),
c(23.45, 23.45),
“mollweide”,
orientation = c(90, therot, 0))
newlongs = temp$x * 2
lines(temp$y ~ newlongs, lty = “dashed”)
lines(-temp$y ~ newlongs, lty = “dashed”)
if (is.finite(latlines)) {
temp = mapproject(c(-90, 90),
c(latlines, latlines),
“mollweide”,
orientation = c(90, therot, 0))
newlongs = temp$x * 2
lines(temp$y ~ newlongs, lty = “dotted”)
lines(-temp$y ~ newlongs, lty = “dotted”)
}
# make the legend =========
multiplier = 1
colorcount = 6
mintext = round(colormin, roundto)
if (is.na(colormin))
mintext = round(min(themap, na.rm = TRUE) * multiplier, roundto)
maxtext = round(colormax, roundto)
if (is.na(colormax))
maxtext = round(max(themap, na.rm = TRUE) * multiplier, roundto)
steptext = (maxtext – mintext) / (colorcount – 1)
midtext = round((mintext + maxtext) / 2, roundto)
#midtext=round(median(themap),roundto)
q1 = round((mintext + midtext) / 2, roundto)
q3 = round((midtext + maxtext) / 2, roundto)
p1 = round(mintext + steptext, roundto)
p2 = round(mintext + steptext * 2, roundto)
p3 = round(mintext + steptext * 3, roundto)
p4 = round(mintext + steptext * 4, roundto)
plusminus = “”
legendtext = c(
paste(plusminus, mintext, legendlabel, sep = “”),
paste(plusminus, p1, legendlabel, sep = “”),
paste(plusminus, p2, legendlabel, sep = “”),
paste(plusminus, p3, legendlabel, sep = “”),
paste(plusminus, p4, legendlabel, sep = “”),
paste(plusminus, maxtext, legendlabel, sep = “”)
)
newcolors = mycolors[seq(1, 100, length.out = 6)]
if (printlegend) {
legend(
“bottom”,
inset = .1,
legend = legendtext,
col = newcolors,
fill = newcolors,
horiz = TRUE,
cex = legend.cex
)
}
# title(sub=paste(“Global Average:”,round(weighted.mean(themap,latmatrix,na.rm=TRUE),1),”W/m2 per °C”),line=-3.9)
if (is.na(titleline))
if (printavgs)
titleline = -2.5
else
titleline = -4.4
title(main = titletext,
line = titleline,
cex.main = cex.title)
if (oceanonly == TRUE) {
gavgland = NaN
gavgsea = NaN
}
if (uselist == T) {
gavg = headlist$gavg
nhavg = headlist$nhavg
shavg = headlist$shavg
gavgland = headlist$gavgland
gavgsea = headlist$gavgsea
tropavg = headlist$tropavg
arcavg = headlist$arcavg
antavg = headlist$antavg
}
theaverages = paste(
“Avg Globe:”,
gavg,
” NH:”,
nhavg,
” SH:”,
shavg,
” Trop:”,
tropavg,
“\nArc:”,
arcavg,
” Ant:”,
antavg,
” Land:”,
gavgland,
“Ocean:”,
gavgsea,
theunits
)
if (printavgs) {
title(theaverages,
line = titleline – titlespacing,
cex.main = cex.title)
} else {
# mtext(text=theaverages,line=-16, cex=.6,adj=0.5)
}
par(mai = c(1.3, .25, 1, .25))
title(sub=subtext,cex.sub=subsize,line=subline,font=2)
if (plotreset) resetplot()
invisible(
data.frame(
gavg = gavg,
nhavg = nhavg,
shavg = shavg,
gavgland = gavgland,
gavgsea = gavgsea,
tropavg = tropavg,
arcavg = arcavg,
antavg = antavg
)
)
ima <- readPNG(paste0(“~/Pictures/willis logo 3.png”))
(usr=par(“usr”))
(theleft=usr[1]+.49)
(thebot=usr[4]-.76)
(thetop=thebot+.30)
(theright=theleft+.30)
rasterImage(ima,theleft,thebot,theright,thetop)
}
# END OF DRAWWORLD =================================
The last bit, starting with “ima” (for image) just adds my personal logo, the two whales yin-yang symbol, to the picture.
Hope this helps …
w.
Send the files via email, please. barryanthony35@aol.com.
Get them yourself.
Barry, the data is freely available on the web. I’ve given you the functions in a copy-pasteable format, as well as the links to the data.
If you can’t figure it out from there, I’m sorry, but I’m not going to hold your hand. Get “the files” yourself.
w.
You appear to misunderstand my request. Please email a copy of the specific file(s) you used to create these charts. Any format will do, really.
This would be a helpful gesture in the name of transparency by allowing independent verification. barryanthony35@aol.com.
Willful obtuseness does not increase your credibility or status.
>>Willful obtuseness does not increase your credibility or status<< To the contrary. This is in no way being obtuse. I’m simply asking that Eschenbach provide the *exact* same materials/files his charting/spreadsheet software is using when creating these graphs. This is in the interest of transparency and independent verification.
He has you troll. It’s not his job to package it so you can send to one of your handlers.
Personal insults are unseemly, Charles. I’m simply asking Eschenbach to demonstrate transparency and, as a result, integrity. I would hope you’d understand and value those qualities.
I don’t have time to suffer fools. Especially those that want to make up their own terminology. You will not find greater transparency anywhere than what has just been displayed to you.
The fact that you are either too ignorant, too ideological, too willfully obtuse, or are simply acting stupid does not change that fact.
I have no problem calling you a stupid troll when that is the behavior you demonstrate.
Your questions are insincere. You choose to harass rather than engage.
After I’ve provided you both the data and the code, you dare accuse me of lacking transparency and integrity? Get stuffed! I’ve provided everything you need to replicate my findings.
I’ve been totally transparent on this side of the screen. The only thing transparent on your side of the screen is an x-ray of your cranium.
As the saying goes … “learn to code”.
w.
I already told you that I’m NOT using either charting or spreadsheet software. I’m using the computer language R. Either you are being obtuse, or you’re not paying attention.
And if you cannot take the data and the code I’ve provided and verify my results, don’t blame me. Instead, get a computer, learn the R language, and verify them for yourself.
w.
Barry, I have given you both the link to the data and the actual computer code used to create the charts. I have no idea what else besides the code and the data you think you need.
I have explained it to you, but I fear I can’t understand it for you. That you have to do yourself.
w.
Mr. E’s polite and complete reply above, somehow falls short for Mr. Anthony. Mr. Anthony is indeed fortunate to be at a site where there are so few bad actors, nobody will send a “file” to the email he published. No matter how well deserved.
I showed YOU the links to the data he used in the other thread even posted them for YOU twice, yet you go on and on pretending you never saw them.
Now I see that in this post he posted this:
”
In this case, I got to thinking about the Berkeley Earth global temperature dataset. So I got their gridded file “Monthly Land + Ocean Average Temperature with Air Temperatures at Sea Ice” covering 1850 to 2021 and took a look at it. I started at the first month’s data, January 1850 … and my jaw hit the floor.”
Each of the charts has the information showing what he used to generate it, how hard can that be understood?
Don’t forget about this.
HADCRUT DATAGATE
HadCrut4 Global Temperature, 1850 – 2018.
Absurdity everywhere in Hadley Met Centre data
Scandal: First ever audit of global temperature data finds freezing tropical islands, boiling towns, boats on land
CRUTEM — HADCRUT
Climategate’s “Harry Read Me” File is a Must Read!
As another pundit said: this isn’t just the smoking gun pointing to the fraud of global warming, it’s a mushroom cloud!
http://bit.ly/2KAglcK
https://www.climatedepot.com/2018/10/07/scandal-first-ever-audit-of-global-temperature-data-finds-freezing-tropical-islands-boiling-towns-boats-on-land/
“Climategate” was nothing but a contrived controversy by fossil fuel shills desperate to distract from the reality of AGW at all costs, including criminal activity. Even those who took part in it are now not only apologizing publicly, but admitting that their own research agrees with the science. https://www-bbc-com.cdn.ampproject.org/c/s/www.bbc.com/news/uk-england-norfolk-59176497.amp?fbclid=IwAR3i5a3xyAtnW4Kd1PjthFqk1OcSGv1gngWusUMPw-RYNuxh9jL2QLirvFU
Mr. Anthony: “those” and “their” are plural, but the propaganda article you cite only has one “sceptic” saying he was sorry. I warrant there is not another single soul on earth who regrets any role in exposing phil jones and the team. But the funniest part is this- you just called Steve Mosher a fossil fuel shill!!!
Should be fun kicking you down ’til you choose some other name.
Barry, that’s so far from being true that it is totally laughable. How do I know? Because I’m the man who made the first FOIA request to Phil Jones that eventually ended up in Climategate, and I’m mentioned in the Climategate emails. Those emails prove that Phil flat-out lied to my face.
The true story of Climategate is here, and it had nothing to do with “fossil fuel shills”. That’s a damn lie.
w.
Willis,
“And a “SWAG”, on the other hand?
That’s a far superior creature, a “Scientific Wild Ass Guess“ … like say the various estimates of global average temperatures in the 1800s.”
“SWAG” may be superior to “WAG”, but what tops them both is “SSWAG”. “Settled Science Wild Ass Guess”. Why? The “Settled” part is always shifting as the past “Settled Science” turns out to be wrong.
Colleagues and I have studied the public Australian temperature data from BOM since (for me) 1992 and we know a thing or two about it. I supplied Steve Mosher with early data that went into BEST, for example, and discussed problems with urban versus rural stations.
Ruthertglen BOM station has been a poster child. There are many versions of what happened there, many in conflict. Here is a deep study:
https://www.bomwatch.com.au/bureau-of-meteorology/rutherglen-victoria/
In short, nothing useful is known today about screen shifts back then.
Willis,
Re the circles on the global map, for Australia, the historic time slices reflect data from a succession of new sites starting off. Here is a table of the earliest 25 stations to open, from 1856 to 1889 incl.
http://www.geoffstuff.com/bomopen.xlsx
We are always happy to provide neutral, informed links to data that raises questions that might not be answered on official sites. There is plenty of official myth. Geoff S
Thanks, Geoff.
The video shows the situation from 1850 to 1870. The curious part to me about Australia is that you would expect the coverage to get better and better over that period, as new stations are opened …
… but it doesn’t. WUWT?
w.
It seems that the message is that the uncertainty in the historical meteorological data is much larger than officially recognized.
Part of the problem is that sparsity is used to create a warming trend as stations are added.
Example.
Station 1 for five years ->
15, 15, 15, 15,15
Station 2 added in year six ->
20, 20, 20, 20, 20
What to the averages show ->
15, 15, 15, 15, 15, 18, 18, 18, 18, 18
Is this a warming trend?
How about anomalies.
-3, -3, -3, -3, -3, +2, +2, +2, +2, +2
Is this a warming trend?
Think about what lack of stationarity causes and how Simpson’s Paradox may apply.
Has the addition of tropical stations been offset by an equal number of stations in colder regions? Does this add an unexpected bias to the GAT?
Sorry, not true. The anomalies are taken about the station average, not the global average. So the anomalies in both cases are 0, 0, 0, 0, 0, and there is no trend.
w.
You are correct and I didn’t use appropriate values.
However the problem still occurs. People are averaging station anomalies with different unseen variances and those different variances can cause spurious trends as stations come and go. It is one reason that “long” records are desired and entice the use of inappropriate “corrections” to measured data.
I was in a program management review for a missile program back in the late 1980s, being briefed by a contractor, the Program Manager for one of the missile stages. He cited a number (for what, I don’t recall), and the customer immediately pounced on him, demanding to know the accuracy of said number.
He calmly replied, “It’s an IPIDOOMA.” We on the customer side were clearly bewildered. Noting this, the PM went on to say “You’ve heard of a WAG and a SWAG – a Wild Ass Guess and a Scientific Wild Ass Guess. Well, an IPIDOOMA is a ‘I Pulled It Directly Out Of My Ass.'”
It would have been funnier if his part of the program hadn’t been a complete catastrophe – not unlike climate “science.”
Another great acronym. Thanks for the story. Some day the whole charade is going to collapse. Maybe not this generation but it’s inevitable.
Only if Marxism does not win out in end
That’s ShittyWAG.
Swag?
I thought I would be purchasing “Watts Up With That” T-shirts or a coffee mug.
SWAG is Super Wild Ass Guess. That’s the term when the boss comes in and asks for a budget estimate to do a task with just 5-minutes of thought. It’s used all the time at Boeing engineering meetings.
No science involved. Just two orders of magnitude more uncertainty than a WAG.
Been there, suffered that.
BEST is nothing of the sort.
So much for years of trollops insisting on the glories of BEST.
As a psychometric /biometric statistician the first thing I look for is the reliability of any measure claimed to represent a construct, because reliability limits what you can understand by the numbers. Reliability is related to the correlation between alternative measures of the same construct. Reliable measures generally have correlations .9 and above. From memory the correlation between temperature measures on the same days 1000km apart was tested and was described glowingly as 0.6. Which means only 36% of the variance is shared in common, which means 74% of what is measured is error (incorporating measurement and random error and everything else, including all local conditions, heat island effects, height above sea level, weather, etc).
God knows what the error (1 – reliability [aka correlation-squared]) is, given the wide coverages described here, of daily sea and land measures covering the whole globe (but wait, we don’t even measure sea temperatures daily!)
In other words terrestrial temperature measures (even before they are “remodelled” by scientists with an agenda) are almost certainly highly error prone. It is notable that it is very hard to obtain details of correlations between alternative daily measures of even nearby locations ( eg coastal vs inland, vs sea, vs satellite based), but these seem generally low (less than .5).
So to claim to be able to then remodel these unreliable measures (using secret sauce algorithms) then come up with a reliable “global” measure to 2 decimal places suggests a discipline that is kidding itself.
And as for claiming we know the “global” temperature in the 1850s, when we had virtually no data for the Southern Hemisphere at all (much less systematic data), and when only a tiny proportion of the northern hemisphere was systematically measured – that is bonkers.
I appreciate your comments. They follow many of my own thoughts based on measurement assessment.
Indeed, there may be no frost northwest of Santa Rosa.
It will be interesting to see when it reaches people in the mid to high latitudes how thin the troposphere becomes during the winter season and how much the circulation is affected by the stratospheric polar vortex and the temperature in the stratosphere.
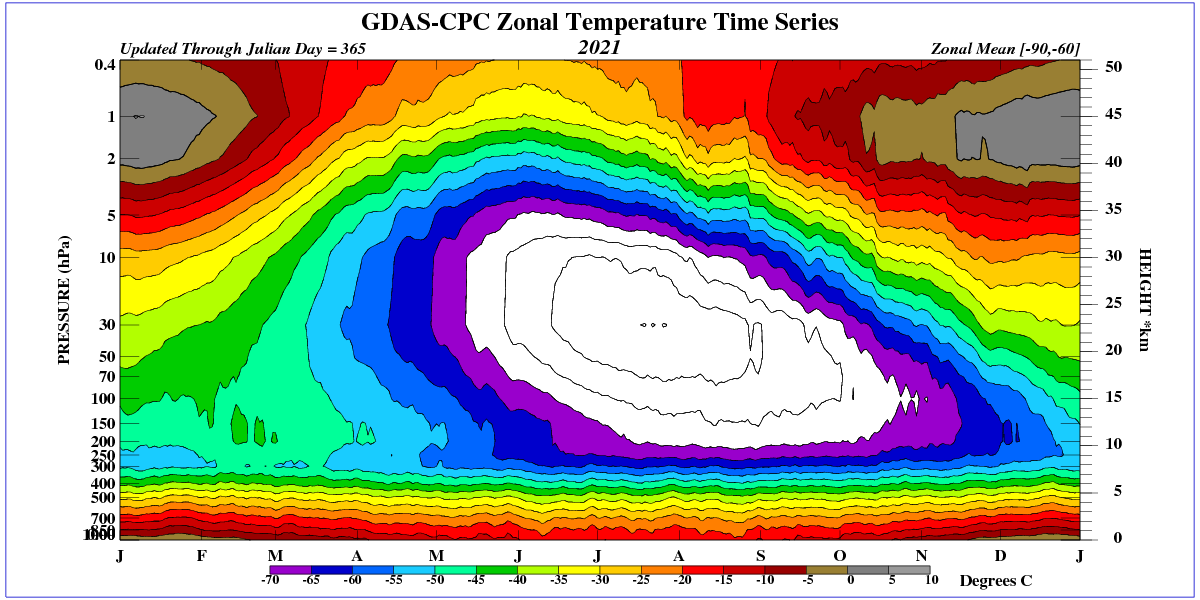
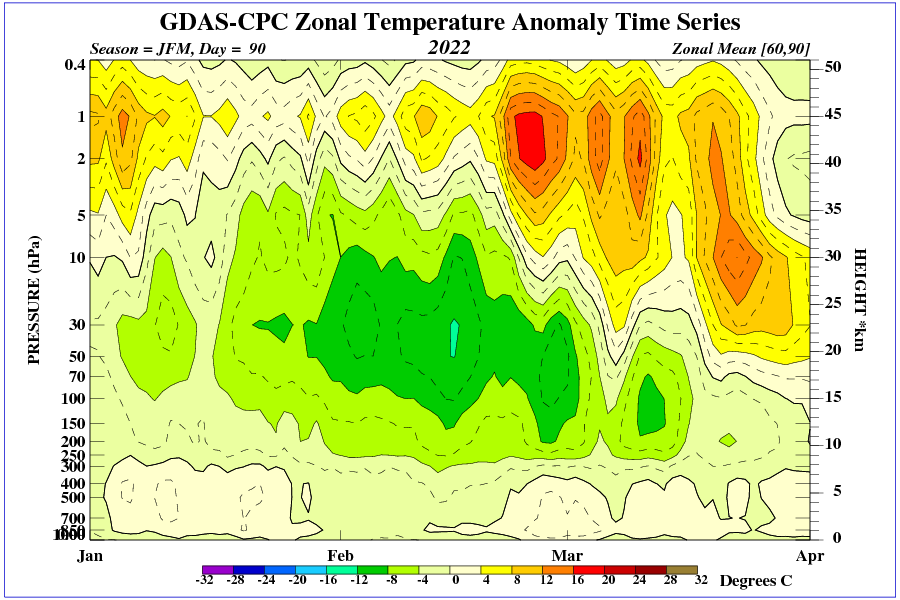
Thank you for this eye-opening analysis.
Here’s the illustration for “wag” in my climate glossary:
Willis,
OT but when I read this paper, I thought it would be of interest to you.
CRE of multi-layer clouds over the Pacific.
https://geoscienceletters.springeropen.com/articles/10.1186/s40562-020-00156-6
And is in opposition to what Corti published in 2009
https://www.researchgate.net/publication/26640018_A_simple_model_for_cloud_radiative_forcing
Thanks, D., I’ll take a look.
w.
The GHG hypothesis is wrong if it says adding CO2 must raise average temperature. That is a simple matter to prove false mathematically.
There is a 4th power relation between radiation and temperature but a linear relation between average temperature and actual temperature.
Thus by changing the distribution of temperature while decreasing the average temperature you can actually increase the radiation!!!! Completely opposite to GHG theory.
This follows the Holder Inequality for sums for those seeking a formal proof.
Frost persists for several days in New Mexico and Texas.
You are demonstrating willful obtuseness to the point of embarrassing yourself. All sources and methods clear identified. Do not badger authors because your knowledge of science and math comes from a place of narrative instead of one of process.
Sorry, but math doesn’t predict climate.
Shannon-Nyquist Theory is that you sample twice the rate of the highest frequency. I find talking about averages with such sparse sampling extraordinary. The only system that achieves anything like this sample rate is the UAH satellite MSU. And that only works back to 1979. Extrapolating in reverse is just as meaningless and projecting forward.