Ken Gregory, P. Eng.
This article by Ken Gregory, P. Eng. is a critique of an influential report by Thomas Tanton “Cost of Electrification: A State-by-State Analysis and Results” and provides corrected new capital cost estimates to achieve net zero emissions in the U.S.A. Estimating the increased operating costs is beyond the scope of the study. This post provides a condensed version of the blog post previously published at Friends of Science here.
Executive Summary
Many governments have made promises to reduce greenhouse gas emissions by replacing fossil fuels with solar and wind generated electricity and to electrify the economy. A report by Thomas Tanton estimates a capital cost of US$36.4 trillion for the U.S.A. economy to meet net zero emissions using wind and solar power. This study identifies several errors in the Tanton report and provides new capital cost estimates using 2019 and 2020 hourly electricity generation data rather than using annual average conditions as was done in the Tanton report. This study finds that the battery costs for replacing all current fossil fuel fired electricity with wind and solar generated electricity, using 2020 electricity data, is 109 times that estimated by the Tanton report. The total capital cost of electrification is herein estimated, using 2020 data, at US$433 trillion, or 20 times the U.S.A. 2019 gross domestic product. Overbuilding the solar plus wind capacity by 21% reduces overall costs by 18% by reducing battery storage costs. Allowing fossil fuels with carbon capture and storage to provide 50% of the electricity demand dramatically reduces the total costs from US$433 trillion to US$24 trillion, which is a reduction of 94.6%. Battery storage costs are highly dependent on the year’s weather and the seasonal shape of electricity demand.
The U.S.A. government has set a target to reduce greenhouse gas emissions from fossil fuel use and cement manufacturing to net zero economy-wide by no later than 2050. Some believe this could be achieved by replacing most fossil fuel use with non-emitting energy sources and sequestering carbon dioxide (CO2) emissions from the remaining fossil fuel use by carbon capture and storage (CCS).
Mr. Tanton is President of T2 & Associates, a firm providing consulting services to the energy and technology industries. T2 & Associates are active primarily in the area of renewable energy and interconnected infrastructures. Mr. Tanton is also Director of Science and Technology at Energy and Environment Legal Institute. He has provided expert testimony regarding energy technology to the House Energy and Commerce Committee and several state legislatures.
The executive summary of the Tanton report states for the U.S.A. “Electrifying the entire nation, with a goal of eliminating the direct consumption of fuel would cost between US$18 trillion and US$29 trillion in first costs.” The lower cost assumes that dispatchable fossil fuels are used to generate electricity with carbon capture and storage to electrify the U.S.A. economy. The higher cost assumes only solar and wind (S+W) are used to replace other power sources for electricity generation with batteries for backup energy to handle the solar and wind intermittency.
The Tanton report says that the costs were based on the average monthly demand for natural gas, ignoring the seasonal variations. The demand in January in the residential sector is 2.5 times higher than the average monthly demand for natural gas. This must be taken into account to protect public health and safety. The report says “This would add approximately $7 trillion to our estimates for a total of over $36 trillion.”
The review of the Tanton report found 10 major problems. Here I summarize only five of the problems.
- The battery storage costs are far too low and do not account for seasonal, daily and hourly changes of S+W output.
- Nuclear, hydro, biomass, geothermal and waste heat sources do not need to be replaces. Accepting these sources causes the fraction of power generation that should be replaced to be reduced from 90% to 60% which is the fossil fuel portion for 2020.
- The S+W average capacity factor should be reduced from 33% to 28%.
- Natural gas used in buildings was double counted as that volume was also included in natural gas used for power generation.
- Costs for converting off-road vehicles (e.g., tractors) to electricity are excluded.
The net effect of the identified errors is that the Tanton report underestimated the costs of “decarbonizing” the US electrical energy system in the case without using fossil fuels.
I created a spreadsheet to calculate the battery storage requirement assuming that the hourly fossil fuel fired electricity generation is all or partially replaced by S+W energy. I assumed that the battery efficiency is 90%, meaning that charging the battery with 100 MWh and discharging 90 MWh leaves the battery storage unchanged. The spreadsheet calculates hourly imbalance between the customer demand for electricity and the supply of S+W and fossil fuel fired electricity. The battery charge is adjusted from the imbalance to account for the battery efficiency.
Battery storage costs were estimated at US$347 per kWh of energy storage capacity from a US Energy Information Agency report. The battery costs of the Tanton report buys storage capacity equal to 0.22 days of average electricity generation.
I created 7 cases utilizing the 2019 and 2020 solar plus wind hourly production profiles. Four cases assume that 0%, 50%, 40% and 60% of actual 2019 or 2020 fossil fueled electricity generation would be used and the other portion would be provided by S+W electricity to supply electricity demand that is currently provided by fossil fuel and S+W power. Henceforth, the term “electricity demand” means the electricity demand provided by fossil fuel and S+W generation. Hydro, nuclear and biomass fueled electrical generation are held constant. Three cases assume that S+W generation capacities are higher than required to replace the fossil fuel fired electrical energy but the S+W power output is limited to a maximum value. The overcapacity of S+W generation increases its cost but reduces the variability of the used generation and reduces battery costs. The electricity requirements for replacing directly used fossil fuels were calculated in each case using the same fraction of fossil fuels for electricity generation as the current electricity demand.
The cases with fossil fuel fired electricity include costs for carbon capture and storage (CCS) and reduce the amount of solar and wind power that would be required to meet net zero emissions. The costs of CCS are based on estimates published by the US EIA in 2020. The total CCS costs were estimated at $2,583/kW of net plant capacity. All costs are in US 2019 dollars. In the cases where fossil fuel fired electricity is used, the maximum fossil fuel fired generation is reduced by 15% to account for the extra fuel required to capture the CO2 from the exhaust gas. The aviation and shipping costs are the cost of carbon capture and storage (CCS) for the fossil fuels used. Airplanes and ships are assumed to continue to use fossil fuels in all cases.
Figure 1 shows the actual hourly net S+W net electricity generation for the years 2019 and 2020 for the contiguous 48 states. The graph shows the electricity generation is extremely variable. The use of S+W generation from 48 contiguous states implicitly assumes that there is sufficient unconstrained transmission capacity to share any excess or to cover any shortfall among the states.

Figure 1
Case 1
This case is equivalent to the Tanton report case of replacing non-renewables with S+W energy. I assume that the S+W energy added equals the fossil fuel generated electrical energy it replaces and battery storage would be used to provide (or store) electrical energy when wind and solar energy generation are less than (or greater than) the total hourly demand.
Figure 2 shows the hourly S+W energy that would be required if the fossil fuel fired electric energy was replaced with S+W energy with battery backup using the 2020 S+W production profile.

Figure 2
Figure 3 shows the change in battery energy storage required to backup the S+W energy to avoid energy shortfalls utilizing the 2019 and 2020 S+W production profiles. The S+W energy produced in the case over each year is equal to the fossil fuels fired electrical energy plus the S+W energy actually produced in the USA during the year.

Figure 3
The table case 1 shows the existing demand (ED), days of battery storage required, battery losses, the battery storage used and the solar+wind multiplier. The battery storage is the maximum energy storage level less the minimum energy storage level of each year. The days of storage is 365 days times the required storage percentage of the total demand. The solar + wind multiplier is the factor by which the S+W capacity was increased to replace the annual fossil fueled generated electricity.
| Case 1 | Solar and wind replaces fossil fuels | |
| Year | 2019 | 2020 |
| Existing demand ED (TWh)[1] | 3026 | 2937 |
| Days of storage | 26.9 | 30.7 |
| Battery losses for ED (TWh) | 41.4 | 41.5 |
| Battery storage for ED (TWh) | 206.0 | 228.3 |
| Solar+wind multiplier | 7.806 | 6.602 |
| Storage cost ED (US$ B)[2] | 77,424 | 85,689 |
| Total cost of ED (US$ B) | 79,379 | 87,552 |
| Conversion from nat. gas (US$ B) | 119,922 | 136,313 |
| Convert buildings (US$ B) | 9,479 | 9,479 |
| Electric vehicle costs (US$ B) | 6,644 | 6,644 |
| Vehicle electricity (US$ B) | 169,906 | 193,129 |
| Aviation and shipping CCS (US$ B) | 191 | 191 |
| Total cost (US$ B) | 385,550 | 433,308 |
| Total storage cost (SU$ B) | 358,933 | 406,697 |
Table 1
The Tanton report assumes that 0.22 days of battery storage was required using annual average values, while the hourly analysis shows that using the 2019 and 2020 S+W production variability, the days of battery storage required for the US economy powered without fossil fuels would be 26.9 days and 30.7 days, respectively. Considering only the current electricity demand, the battery storage costs using the 2020 production profile is US$85.7 trillion, or 109 times the US$ 0.786 trillion battery storage costs estimated in the Tanton report.
The total cost to electrify the USA is US$386 trillion with the 2019 profile and US$433 trillion with the 2020 profile. To put these costs in perspective, the USA nominal gross domestic product (GDP) in 2019 was US$21.43 trillion. The 2020 total cost of electrifying the US economy is equivalent to over 20 times the US 2019 GDP.
Case 2
In Case 2 the S+W capacity is increased from case 1 with the goal of reducing storage requirements. This creates excess S+W capacity; consequently the S+W output must be limited to a fraction of its capacity. This wastes generating capacity but reduces battery storage requirements. The maximum S+W dispatched to satisfy demand is reduced from 100% to 47.1% of generation capacity. The total battery storage costs with the 2020 production profile drops from case 1 to case 2 by US$78.6 trillion.
Figure 4 shows the hourly S+W energy required for case 2 using the 2020 S+W production profile.

Figure 4
The battery storage capital costs with the 2020 production profile declines by US$78.6 trillion. The total cost with the 2020 profile is reduced by 17.7% due to lower storage costs despite higher S+W capacity of 21.2% compared to case 1. The total cost of case 2 is US$317 trillion and US$357 trillion using the 2019 and 2020 S+W production profiles, respectively.
Case 3
In Case 3 the fossil fuel fired generation capacity in maintained at current levels but it provides 50% and S+W provides 50% of total demand. The S+W capacity is reduced compared to case 1 and the S+W energy output isn’t limited as it was in case 2.
By allowing fossil fuels to provide 50% of electricity demand, costs of electrifying drop dramatically. The maximum capacity of fossil fuel fired electricity with the 2020 production profile is maintained at the actual capacity of 486 GW, but it only provides electricity equal to an average power of 307.2 GW. Battery storage costs are nominal at only US$0.9 trillion with the 2019 profile and US$0.1 trillion with the 2020 profile. CCS costs are US$2.2 trillion. The total cost with the 2020 profile is US$23.5 trillion, which is only 5.4% of the case 1 total cost.
Figure 5 shows the fossil fuel fired and S+W electrical generation with the 2020 production profiles.

Figure 5
During much of the year the fossil fuel fired electricity production is far below capacity, even going to zero a times, but for months fossil fuels provide most of the electrical demand. The fact that fossil fuel generation is vastly less expensive that battery storage is what drives the cost down.
Case 4
In case 4, fossil fuel provides 50% of the electricity demand and the S+W capacity is increased by 6% from the case 3 value but the S+W power generation is limited to a maximum of 57.5% of its capacity with the 2020 profile. The total cost of the case decreases by US$0.46 trillion with the 2019 production profile but increases US$0.18 trillion with the 2020 production profile.
Cases 5, 6 and 7
In cases 5 and 6 the fossil fuel share of electricity generation decreases to only 40% and S+W contributes 60% of electricity demand. In case 7 the fossil fuel share of electricity demand is 60%. The 2020 production profile gives lower total costs than the 2019 production profile. This is because the 2020 profile has lower total electricity demand and, for cases 5 and 6, lower storage requirements. The actual 2020 electricity demand was materially affected by the COVID pandemic. Case 6 has lower costs than case 5 because the lower battery storage requirements more than offset the higher S+W capacity costs. Case 7 has the lowest total cost of all cases for both production profiles because it uses the highest fraction of fossil fuels which are dispatchable and not weather dependent.
Summary of Cases
Table 3 summarizes the total costs of the seven cases.
| Total cost of electrification | US$ trillion | US$ trillion | ||
| Case | Fossil Fuel % | S+W increase capacity | 2019 | 2020 |
| 1 | 0% | No | 385.5 | 433.3 |
| 2 | 0% | Yes | 316.6 | 356.7 |
| 3 | 50% | No | 24.3 | 23.5 |
| 4 | 50% | Yes | 23.8 | 23.7 |
| 5 | 40% | No | 34.3 | 30.3 |
| 6 | 40% | Yes | 28.9 | 26.5 |
| 7 | 60% | No | 22.9 | 22.8 |
Table 2
Conclusions and Discussion
I reviewed the Tanton report which estimated the capital costs of the electrification of the USA without the use of fossil fuels. I listed several issues with the report. The most important problem was that without fossil fuels providing electricity back up for intermittent and variable wind and solar energy, battery storage back up is extremely expensive. The calculations show that total battery storage costs for existing electricity demand is 109 times the Tanton estimate and the total battery costs for existing and new electricity demand is 88 times the Tanton estimate when using the 2020 production profile.
The total cost of electrification without fossil fuels is estimated at US$386 trillion and US$433 trillion using the 2019 and 2020 energy production profiles, respectively. Since the weather and consequently the battery storage costs are so variable, the actual battery storage costs would be higher than estimated here to provide a reasonable amount of contingency battery reserve. The cost of US$433 trillion is equivalent to over 20 times the US 2019 GDP. It would cost every adult (18 year and over) a total of US$1.7 million!
The total electrification capital costs with the 2020 production profile are reduced by 18% by overbuilding the solar plus wind capacity by 21%. The tradeoff is that battery storage costs are significantly reduced.
When fossil fuels provide 50% of the total electricity demand, it is also providing backup services for the S+W electricity, so battery cost are mostly eliminated and electrification capital costs are reduced to about US$24 trillion. Capital costs can be further reduced to about US$23 trillion by allowing fossil fuels to provide 60% of the total electricity demand.
Note that the estimates for CCS assume that coal or combined cycle natural gas fired power plants are used, but these high efficiency power plants are generally unsuitable for backing up S+W generation because the rapid swings necessary to match total generation to net demand (the demand left over after subtracting that supplied by extremely variable W+S generation) puts a great deal of thermal strain on the plant components, thereby increasing maintenance costs. It also reduces the thermal plants’ fuel efficiency. Thermal backup power is more often provided by smaller, more flexible simple-cycle gas turbines that have lower capital costs but also lower fuel efficiencies.
The simple cycle gas plant will emit 57% more CO2 than a combined cycle gas plant for the same electricity output. This suggests that the capital costs estimated herein for CCS may be low and the operating costs for backup power will be much higher than they are currently.
Please see the entire article here (PDF file).
[1] TWh = Terrawatt-hours = 1000 GWh. “Demand” means electricity energy requirements.
[2] B = billion.
Do these figures account for the “Worse Case Scenario” day regarding the ability to meet potential Projected Peak Demand?
If not then costs would be higher
No, the figures are based on the actual 2019 and 2020 solar and wind hourly production data for the USA. Depending on the weather of other years, battery storage required to prevent blackouts could be higher. I wrote “Since the weather and consequently the battery storage costs are so variable, the actual battery storage costs would be higher than estimated here to provide a reasonable amount of contingency battery reserve.”
Makes sense. Nice article!
or the industrial loses would be greater and the death death count would be higher.
The cost will be way higher no body has any real data on large scale grids close with net zero to get REAL data from.
Solar and wind are not practical, and no amount of handwaving will make it otherwise.
One would need batteries with the performance of Heinlein’s fictional Shipstones from Friday to let it work. And the plot twist was that the Shipstone organization ran the world, given the value of that trade secret.
It wasn’t clear to me whether this included the cost (and energy loss) of long-range transmission from windy/sunny areas to population centers.
That may have been considered in the original report, and deemed not to change.
None of the real problems with long-range transmission are discussed anywhere. Risk goes up at least linearly if not exponentially with the length of a transmission line. Risk associated with at least weather impacts and equipment failure must be considered if nothing else. Let a tornado or hurricane to take out a long-range transmission line and the area of impact and the population affected goes up significantly, think of long-range transmission lines that are depended upon to get electricity from Denver to the eastern seaboard as an example. The only way to lower this risk impact in any significant way would be to have multiple parallel paths which are physically separated. This not only includes the lines themselves but the backup facilities that would also be required to feed these multiple, physically separated transmission paths.
The costs in the article above should probably be at least tripled if you want to include risk amelioration. The costs could actually approach a $1 quadrillion, if not more.
Lots of long range transmission also means lots of energy lost in transit.
All that energy has to be made up by increasing the amount of wind and solar by a like amount.
Transmission costs for solar and wind energy were estimated by Tanton and used here at 65.3 $/MWh as shown on the fourth line of Appendix 2 of the PDF version.
Risk amelioration is not discussed any where in the pdf. It’s not clear that the 65.3 $/MWh includes any costs increases for risk.
If we *truly* go to net-zero then when residential peaks that occur near/after dark, such as in the winter, electric transmission from the central and west states will be required to fill in for peaks on the east coast. The western states will need to supply power to the central states as they go dark. And only Pete knows where the power for the western states will come from when the rest of the US is dark. (heck, I don’t think CA knows where its power is going to come from *today* let alone in the future. The Grasshopper and the Ants story comes to mind!)
Telephone companies started building self-healing rings around major cities 40 years ago for just this reason. When a backhoe would cut one major link, traffic could be routed around the cut using the opposite side of the ring. LOTS of higher costs that were justified to the public utility commissions purely based on service continuity. I know the power companies do the same thing today but not on a national basis. That will have to change if we abandon fossil fuel generating islands and go full net-zero depending on wind, solar, and batteries.
The reason “The Tanton Report” is so grossly inaccurate is this: MONEY.
Mr. Tanton is President of T2 & Associates, a firm providing consulting services to the energy and technology industries. T2 & Associates are active primarily in the area of renewable energy and interconnected infrastructures.
Tanton is a commonplace hustler lying to make money. The End.
Yup. We don’t his ilk to tell us what should be obvious to all.
And how does this differentiate Tanton from the rest of these low-lifes making money from the non-existant “climate crises”?
I see the price of batteries doesnt even look at the rapid increase in battery price as the demand skyrockets.
Are there even enough materials available to make the required batteries anyway?
Just the opposite. As volume increases we get smarter about how to make things. For batteries it is about 24% reduction for each doubling in capacity.
And production is going to keep ramping up with 13 Gigafactories planned in the US alone:
13 battery gigafactories coming to the US by 2025 – ushering new era of US battery production – Electrek
LFP batteries are already 30% cheaper than LiNMC batteries and present no shortage of scarce materials like Cobalt.
This should scale for transport electrification – say 15 million light vehicles per year @ 70kWh / vehicle, each requiring 12kg of Lithium = 180,000 tonnes of Lithium against reserves of 80 million tonnes, > 400 years of production.
BUT I think you have to scale 2 orders of magnitude to stabilise a renewables only grid. 15 Million x 70 kWh = 1TWh. This article calls for 250 TWh to stabilise the grid.
Nuclear would be a good source of carbon free baseload power.
Apparently this club is still taking new members.
The above article by Ken Gregory is pretty good and insightful as to the mistakes made by Thomas Tanton in his “Cost of Electrification: A State-by-State Analysis and Results”.
However, there is no mention of the cost analysis being made on a LCOE (levelized cost of electricity) basis that would rightfully include such things as life cycle costs (i.e., new infrastructure must be maintained and eventually replaced . . . there is a direct maintenance cost and a depreciation cost in those considerations) and the imputed cost-of-money (i.e., a large amount of money is spent “up front” for the new infrastructure but the return on that investment is only realized over decades, during which time the money could have earned interest had it simply been invested) . . . that “lost interest” is accountable as an indirect expense.
Details, details, details.
Any engineer in a public utility that has rate of return regulations in the U.S. could address these issues better than this study. Public Utility Commissions make you live and die by analyzing the things you mention.
Yes, these details would add to the costs. The operating cost impact is beyond the scope of this blog post. Tanton report says “ The estimate for annual energy expenses directly and
indirectly paid by households will likely increase by at least $5,000 per household. Annual consumer expenditure for energy would roughly double.”
When (not if) the information that every household would see a $5,000 cut in its annual after-tax income, that annual energy costs would double, the whole scheme collapses in political infamy. Christ! Just look at the political fallout of recent gasoline price increases and accelerating inflation: Brandon is backtracking on everything, to the consternation of the Leftists.
The one component never mentioned by S&W enthusiasts.
“the return on that investment is only realized over decades, during which time the money could have earned interest had it simply been invested) . . . that “lost interest” is accountable as an indirect expense.”
There would be a lot more stories like this one….
Sweden to help households as electricity prices soar – ABC News (go.com)
“It’s a crazy situation to be in,” said Hannah Hall who lives in an old wooden house in Kristinehamn, a small town in central Sweden. “I was aware it would be an expensive winter, but it feels unprecedented.”
Hall was billed 10,400 kronor ($1,150) for her December electricity consumption, about tripled the previous year, to heat her 130 square meter (1,400 square feet) home.
holy crap
I pay $400 canadian a month for my gas AND electricity used, although we moved to a different house in calgary this summer so i’m waiting to see what my next bill is going to look like
I’m switching from an electric stove to a gas stove next month. The change has been in the works since last summer, but I wonder if I’ll see any savings now. 😳
The calculations show that total battery storage costs for existing electricity demand is 109 times the Tanton estimate and the total battery costs for existing and new electricity demand is 88 times the Tanton estimate when using the 2020 production profile.
_________________________________________________________
Not 108 not 110 but 109
Not 87 not 89 but 88
These sorts of claimed accuracies jump out at me no matter what side of the argument is being presented.
Come on Steve, this exercise was about roughly estimating the cost of Tanton’s fantasy scheme using generalized real-world numbers. With the object of demonstrating that Tanton has so drastically underestimated the costs of his scheme, that it can never possibly be realised. Assume that the numbers are ±50% – the conclusions won’t change, will they?
Given the past governmental track record, assume +300%!
Didn’t John Kerry inform us that going net zero would achieve nothing (in terms of ‘fixing’ the climate)?
So $400T down the tubes and the climate still in crisis.
An average bloke like me could be forgiven for thinking it’s not about fixing the climate at all.
Good Job, Ken Gregory! Thank you!
China, India and Russia have it right and will prosper, whilst the West falls on its Net Zero sword, plunging citizens into social unrest
Fossil fuels are not only safe, reliable and affordable, but plentiful, yet the green blob appear destined to put mankind back in caves
And they are not even fossil!
Oil is 2-nd largest liquid on the planet that’s currently being pumped from 20 thousand feet down. There are no dead dinosaurs or other fossils this deep.
Clearly one of many HydroCarbons that’s produced by the planet.
K Coal
“Fossil fuels are not only safe, reliable and affordable, but plentiful, yet the green blob appear destined to put mankind back in caves”
“Fossil fuels are not only safe, reliable and affordable, but plentiful, yet the green blob appear destined to put the rest of mankind back in caves”
Closer to the true intent, possibly?
Auto
…to accomplish NOTHING. It wouldn’t even change how much CO2 is in the air.
https://rclutz.com/2021/11/06/ipcc-data-rising-co2-is-75-natural/
https://scc.klimarealistene.com/2021/10/new-papers-on-control-of-atmospheric-co2/
The only thing it would accomplish is to divert trillions from the public into the pockets of special interests. Solyndra anyone?
I live in SE Michigan…have not seen the sun for days, and sometimes it can be two weeks no sun here.
I get your point, Mr. Bell. I also feel your pain… (up here about 1 hour north of Seattle, Washington…). So! I found this 😃 It sure brightened my rather gloomy Wednesday. Hope it does yours.
“Island Paradise: 3 Hours of Beautiful Beaches (Tropical Drone Footage …)” (Published on YouTube)
And the best evah DANCE SUNSHINE video 😊 :
(Yes! This video is ON topic! 🙂 Without fossil fuels, all of the following wonderful creativity would NEVER have happened.)
“Old Movie Stars Dance to Uptown Funk” (published on YouTube)
They weren’t old, then…….how fleeting our time on earth is…….. but, don’t sigh ….. FOR! 😃 “The best is yet to come.”
Small world. I live about 90 minutes north of Seattle. Well, 90 minutes on a good traffic day. Bad traffic – maybe 2 1/2 hours.
The weather has been quite cold, then snowy, now cloudy and wet. Another dreary winter in the beautiful Pacific NW. Solar won’t work here, at least not in the winter. We’ll barely see the sun for another 3 to 4 months.
Battery replacement costs? Windmill replacement costs?
You know what makes a really good battery?
A nice big fat stick of uranium!
In a solar+wind only system with battery backup for X hours, if the s+w fail (as they do) then at the end of X hours there is total blackout and absolutely nothing you can do about it.
In a fuel based system, you only have to ensure that you have a supply of coal or gas or uranium available. That’s something that can be planned years ahead.
As are Gregory’s estimates based on 2020 costs! With current battery technology, relatively scarce lithium, and very scarce cobalt, are limiting factors for making batteries. The current commodity costs are the result of low demand. As the demand increases, the commodity costs will inevitably increase. With an attempt at rapid build-up, there will probably be shortages, holding up schedules, with serious cost over-runs.
Further, what is needed is an estimate of world reserves, particularly of cobalt, to see if it is even feasible to build as many batteries as are calculated to be needed. If there isn’t any cobalt available, it doesn’t matter what the cost becomes. Economists think that anything and everything can be produced with the right price incentive. There is less flexibility in natural resources than in manufactured products. If society has to resort to extracting cobalt from sea water, then the costs of the battery would be prohibitive. That is, the cost of electricity will become prohibitive for all but the most wealthy, and most essential survival uses.
A quick way to turn the advanced countries into Third-World economies is to eliminate the use of fossil fuels, based on the recommendations from liberal arts majors, career politicians who have never had an honest job, and innumerate environmental studies majors.
https://pubs.er.usgs.gov/publication/pp1802F
Irrespective of impossible investment costs, there are other reasons that electrical net zero is impossible unless all nuclear. Take CCS. Unless along the gulf coast with depleted gas fields, there is no place to store captured CO2. The Illinois sandstone/brine aquifer experiment failed, because the CO2 reacted with the brine to form impervious carbonate chemicals that plugged the injection wells in a month. Virtually all aquifers deeper than 1000 feet are briny. The capture overheads are ruinous. Boundary Dam unit 4 (CO2 sold for tertiary oil recovery) never achieved more than 65% capture uptime, and the capture electrical requirement was 1/3 of unit 4 capacity.
I have always considered that CO2 capture whether by burning natural gas in pure oxygen or using a sodium bicarbonate cycling system to be the simple part of CCS.
What really gets me is that for every tonne of gas that you burn you must stick at least 3 tonnes of highly corrosive CO2 back into the ground in a similar reservoir to the one which produced the original gas.
Except there is 3 times as much of it , it needs to be compressed for sequestration whereas in production it flows by expansion drive.
Gas production costs I estimated in Turkey for example where my companyt produced gas , when the price of gas was $10 per Thousand cu ft., was about $3 per thousand cubic feet. So the sequestration cost must be about say $20 per thousand cubic, or twice the value of the gas used. This does not take account of the energy used to pump the CO2 back underground which comes from the input gas.
My figures are back of the envelope nut show the thing to be hellishly expensive and infeasible. I invite Griff or any other CCS protaganist co come up with a counter claim for the CO2 sequestration costs.
Failing that then the whole idea of CCS must be sent packing
Subsidies will pay for the costs. The generally clueless public will have no idea what they are buying.
Rud,
Right on, concerning the CCS demo failure at the very inappropriately-named Bounday Dam Power Station in Saskatchewan, Canada (ref: https://en.wikipedia.org/wiki/Boundary_Dam_Power_Station ). The Boundary Dam Power Station is the largest coal-fired station owned by SaskPower . . . it does NOT provide hydroelectric-generated power.
However, I believe the CCS demo utilized Unit #3 and not Unit #4 (my nit picking, to be sure).
An interesting case comparison to add would be the lowest cost case removing all wind, solar and batteries and just using nuclear, hydro and fossil fuels.
This would provide a baseline as to how cheap it could really be if government policies were removed.
It seems to me that all of this is just angels on a pinhead, unless there is some major unforseen breakthrough and suddenly we have magic batteries, (cheap, small, scaleable, “magic”) it is pointless to install much renewables other than small amounts for virtue signaling?
Any technology we have now, or the “promising” avenues they are investigating, are simply several magnitudes short of what is really needed?
Assuming 90% efficiency for batteries is too generous.
It’s more like 90% for the charging cycle and 90% for the discharge cycle.
Or about 81% for the round trip.
Don’t forget transmission losses, losses due to conversion from ac to dc and vice versa and step up/down voltage. Probably 65% at best.
That means adding 50% to your requirements.
“Math is hard”
Barbie
Fisycs is harderer…
Footnote 8 of the PDF file says “The Tesla Powerwall round trip efficiency is 90%. Tesla, Powerwall, https://www.tesla.com/sites/default/files/pdfs/powerwall/Powerwall%202_AC_Datasheet_en_northamerica.pdf
I wouldn’t trust anything from Tesla until it has been independently verified.
Remember, a lot depends on how fast you are charging and discharging. The more current you try to push, the lower your efficiency is going to be.
Not only do I agree with MarkW, but I would point out that battery systems don’t allow you to draw them down to zero without damaging them. So if your analysis depends on that, you need to add about 20% to your battery capacity to account for that reality.
Typically use 50% for depth of discharge on Lead acid batteries, maybe 70% for Lithium.
Li LFP (Lithium Iron Phosphate) batteries are cheaper if slightly less energy dense than NMC (Nickel Manganese Cobalt) and obviously avoid the dependency on Cobalt
Just say nyet to net zero.
What happens to the cost of building out this mythical net-zero power system when we assume that all cars are now electric and all building and water heaters are heat pumps?
Yes, I wondered if the analysis included the increased demand from electric vehicles and building heat. Also what about the costs to massively upgrade local electrical grids to handle the new demand? We will have to get a lot more power out to each home and business, and that won’t be cheap or easy to do.
“In the contest between platitudes and physics, physics remains undefeated.” Physics will always remain undefeated. Very applicable to the zero carbon fantasy.
In a couple years that same million buys you a cup of coffee and a muffin, but probably not at Starbucks.
You tryna say printing trillions of dollars that you don’t have causes inflation? Of course it doesn’t! It reduces inflation and never has to be paid back.
Just ask any socialist!
A weather dependent grid will require massive transmission upgrades, we will need at least a magnitude greater number of wires connecting all of the diffuse generation sites.
And no one talks much about control. We now have extremely high speed networks, and concepts like synchrophasors that when graphed properly make the grid look like an interactive weather map, with arrows showing direct, etc.
When you have tens of thousands of “sources”, how the hell do you control that grid in real time, sources that are designed to be intermittent?
If you have 90% baseload and 10% intermittents like we run in AB today, that is controllable.
How do you control it with 100% intermittents? It essentially becomes chaos.
Residential solar? If everyone has it then ever house is a load as well as a source of fault current?
I don’t think we have the computing power to control this in real time.
Well done Ken Gregory – another diversity fairy slayer.
The early reports on transitioning the Australian NEM grid to intermittent generation was all based on capacity factors. As more S+W was added, it gradually became apparent that there was no diversity fairy with the weather. The whole country could be without sunlight and wind all at once. There is a growing recognition that the dispatchable component of S+W is precisely ZERO. AEMO have now moved to time based modelling. And they now have a capacity payment – a subsidy to keep dispatchable plant economically viable.
With regard your analysis, any intermittent generation adds costs to existing systems. So there is no economic benefit. As fuel cost rise then there may be economic merit in using some S+W and storage. There will be an optimum (minimum cost) based on all three cost components – the fuel cost, the cost of solar, the cost of wind and the cost of storage. You have only considered two points on the cost curve.
In terms of establishing the optimum path, it should be based on fuel costs. Right now, I do not see the prospect of S+W+storage being able to produce more energy over their life than that required to make and install the components. That is where any analysis needs to start. Any system should be capable of producing more energy than that required to make it – an economic energy return on energy invested (ERoEI).
If ERoEI was the guiding principle then wind turbines would have more durable blades. The supporting structures would have operating lives of hundreds of years with minimal maintenance. The cycle life of batteries would be an order of magnitude higher than present. Solar panels would have insulating materials able to stand up to 100 years of sunlight. The panels would be tilted to maximise winter input and on single axis tracking.
Voluntary curtailment of S+W in Australia is common now due to negative pricing that fossil fuel generators can recover during high price excursions. There is a belief in Australia that this curtailed energy potential could be used to produce hydrogen. Hydrogen would then be the energy store. All this is currently speculation and no one has actually built a hydrogen facility that can go from zero output to full output over a few hours. There may be potential for the process to use its own hydrogen to stabilise production but again just speculation.
That tech exists, they use it on space probes, etc, crucial applications with no possibility of recall and repair
But costs 100x the crap they use on the grid.
So to make it reliable, take the $100 trillion of wind and solar and call that part 10,000 trillion?
time to convert the printing presses for the New York Times to only printing $$$$
And that would make it even more hilariously inefficient!
To be honest, hydrogen fire is not much different than coal fire or gas fire. It all makes heat that is used to create steam. The burners and coolers and turbines all require time to reach operating temperature and operating speeds. Unless you run them constantly, constant up and down following power needs just isn’t possible.
It’s just amazing to me that France provides a clear example of how nations can almost completely decarbonize their electric power sectors quickly, safely and at dramatically lower cost than any of the other zero-emissions scalable generation options are capable of offering, but none of the activists or politicians who like to bleat on and on about how critically important it is to achieve net zero CO2 emissions want to acknowledge that fact because to them, decarbonizing the electric power sector using nuclear power is somehow “doing it wrong”.
The comparison between Germany and France couldn’t be more stark. France more or less completely decarbonized its electric power sector within about 15 years after starting their nuclear build program in the mid 1970s and now has some of the cheapest electricity in Western Europe. Germany, by contrast, which now has the 2nd most expensive electricity in Europe, is entering the 23rd year of its “Energiewende”, and despite the hundreds of billions they’ve spent deploying and trying to integrate wind and solar onto their grid, the CO2 intensity of their electricity is still ~8-9 times higher than France’s.
And the new government in Germany’s solution. More wind and no nuclear!
Ken,
Your article assumes a battery loss of 10%, which likely would be only the battery.
That loss should have been assumed at about 20%, on a-to-z basis.
See Note.
Here are two sources:
Source 1 is based on measured data, on a-to-z basis
Source 2 is based on EIA survey data from OPERATING grid-scale battery systems
Energy Losses of Grid-Scale Battery Systems
Source 1
This article identifies 18 losses of a stationary battery system, totaling about 20% for a round-trip, excluding transformer losses.
See Note.
The system model has four coupled component models: Battery, Power Electronics, Thermal Management and Control and Monitoring.
Open URL and click on “View Open Manuscript”
See figures 3, 4 and 17 of article.
https://www.sciencedirect.com/science/article/pii/S0306261917315696
Source 2
Per EIA survey, grid-scale battery efficiency is about 80%, AC-to-AC basis, excluding step-down and step-up transformer losses.
Aging had only a minor effect, because the battery systems were only a few years old.
See Note.
https://www.eia.gov/todayinenergy/detail.php?id=46756
NOTE: Usually, AC electricity from a distribution, or high-voltage grid, has to pass through a step-down transformer, about a 1% loss, to reduce the voltage to that of the battery, then the AC is converted to DC, then inside the battery. The DC energy from the battery has to be digitized, then made into a sine wave with the same phase and 60-cycle frequency as the grid, then via a step-up transformer, about a 1% loss, to the distribution, or high-voltage grid, for an overall efficiency of about 78%, much less with aging at about 1.5%/y. See URL
https://www.explainthatstuff.com/how-inverters-work.html
I’m not sure why you say inverting loses only 1%. I believe it’s more like 10% each way. From the last article you linked:
Overall, 10% each way for charging / discharging, and 10% each way for inverting and step up / down, is:
90% x 90% x 90% x 90% = ~65%.
That means a 50% increase to any requirement.
The 1% relates step and down transformers, as stated in the note
Then you appear to be saying that the inverter is ‘inside’ the battery. If the inverter has an estimated loss of 10%, then what about the loss of the battery chemistry itself? Shirley that would be 10% each way too?
Perhaps I’m just getting confused.
ZZW:
With modern electronics, losses of 1 to 2% are common in rectifiers (AC to DC) and inverters (DC to AC). (I design them, and it’s very important to know how much power has to be dissipated as heat.)
Near me are a set of 1GW inverters at the end of an HVDC line. They have 98% efficiency, but the 2% losses come to 20MW at capacity. I got a tour of it — incredible engineering!
The sequence is as outlined in the note.
Step down transformer…. through power electronics to DC….in battery….out battery….through power electronic to AC…step up transformer
Sequence of Losses:
1) AC electricity from a distribution, or high-voltage grid, has to pass through a step-down transformer, about a 1% loss, to reduce the voltage to that of the battery
2) Through the power electronics to DC
3) In battery
4) Out battery
5) Through power electronics; DC is digitized, made into a sine wave with same phase and 60-cycle frequency as the grid
6) Via a step-up transformer, about a 1% loss, to the distribution, or high-voltage grid
Overall efficiency of about 78%, less with aging at about 1.5%/y. See URL
https://www.explainthatstuff.com/how-inverters-work.html
“made into a sine wave with same phase and 60-cycle frequency as the grid”
What happens when the grid is down and the power electronics have nothing to use in syncing up phase and frequency?
Large battery systems would power themselves with power from their own batteries to continue running the battery system.
I understand that inverters at max power can achieve substantial efficiencies. However over a day’s time they may not achieve maximum efficiency. Also, reactive loads hurt efficiency also. I would like to know what the measured efficiency over a 24 hour period measured at an actual grid connection actually is. That is (power in / power out).
Jim,
Some folks use 98% for ac to dc conversion, but that would be at rated load of the inverter.
Very often, it would run at half load, at a much lesser efficiency, as would other components of the battery system.
The values used in my article are real-world values, not from manufacturers’ brochures.
As a result, the MEASURED A to Z efficiency is around 80%, where catalog values would imply 90%.
Ken,
Your article assumes a turnkey capital cost of battery systems at $347/kWh, delivered as AC, (which needs to be stepped up to distribution or high voltage system voltage, about a 1%
loss)
That value would be about $500/kWh, based on five annual EIA surveys of cost trends
Here are the annual EIA reports for 2020 and 2021
Turnkey Capital Costs of Grid-scale Battery Systems
Starting in 2015, EIA has prepared annual reports regarding site-specific, custom-designed, grid-scale battery systems.
The average duration of deliverable electricity increased from 0.5 h in 2015 to 3.2 h in 2019.
Excluded are:
1) Financing costs
2) Benefits of subsidies, such as grants, tax credits, accelerated depreciation, loan interest deductions, waiving of state and local taxes, fees and surcharges, etc.
3) System aging/degradation costs, because the systems had been in operation only a few years.
EIA 2020 Report
The EIA graph, based on surveys of battery system users, shows slowly decreasing costs after 2018
It appears, the range of values likely would become $900/kWh to 450/kWh in 2025.
The values would be near the high end of the range in New England.
https://www.eia.gov/todayinenergy/detail.php?id=45596
The US average turnkey capital cost of battery systems was about $590/kWh, delivered as AC, in 2019.
The NE average turnkey capital cost for such systems is about $700/kWh, delivered as AC, in 2019
Those prices will not decrease much for at least the next 5 to 10 years, per US EIA, unless major technical breakthroughs are discovered, and subsequently implemented on a large scale. See URL
EIA 2021 Report
Table 6 combines the data of prior reports and the 2021 report. See table 6 and page 18 of URLs
https://www.eia.gov/analysis/studies/electricity/batterystorage/pdf/battery_storage_2021.pdf
https://www.windtaskforce.org/profiles/blogs/economics-of-utility-scale-battery-systems-for-duck-curves
Such battery systems operate 8766 hours per year
About 65% of capacity can be used to achieve 15-year lives
NOTE: Such battery systems are entirely different from the battery packs in electric cars, which operate about 700 hours per year, last about 8 years, and cost about $10,000 for a 60-kWh battery, or $165/kWh.
That cost may become $125/kWh with more mass production in future years.
See this URL for legible table
https://www.windtaskforce.org/profiles/blogs/high-costs-of-wind-solar-and-battery-systems
Even if the US pulls this off it would reduce human CO2 emissions with less than ten percent and make no dent in the increasing content of CO2 in the atmosphere, which is largely controlled by outgassing from the oceans. But the rest of the world would be horrified of the costs and decide to never, ever go down this road.
“Tools down!” German politicians have the answer. Citizens need simply cease using energy.
https://seekingalpha.com/news/3787192-germanys-new-tool-for-achieving-2030-climate-goals-stop-using-energy
What about the costs of restoring social stability and safety after the populace riots and tears the government apart for destroying a perfectly functioning society.
A fine contribution to the debate, Ken. To avoid appearing too partisan, you have been very generous to the proponents of NetZero by adopting some of their assumptions (even though some commentators here feel you have been too nice).
Perhaps, but you can point out than even without including operating costs, being quite generous with S+W capacity factors, underestimating conversion and transmission losses, assuming CCS is both doable and affordable etc, you can still make the case that the real cost will be of the order of $400 Trillion, an order of magnitude greater than the Tanton report.
Hence, your study provides a very realistic LOWER BOUND estimate and is a realistic best-case scenario. The reality can only be worse than this and the true cost will just keep mounting. This makes it difficult for the climate fanatics to attack your study in any credible way without making themselves looking unreasonable.
Well done!
This is a very interesting effort. BTW, battery storage has roughly the same losses during charge as discharge — 80% round trip.
This cost estimate suggests a very big problem which most people fail to recognize about infrastructure.
Infrastructure assets are a perpetuity. We mean to keep replacing them forever. If the capitalized cost to perform this miracle is $400T, and the assets have a finite life (let’s say 40years which is conservatively too high), we require around $10T per year to maintain the system in perpetuity. This money must come from the economy either taxes or savings, but the present savings rate isn’t one-half trillion a year. One can see the basic problem. At some point a society can have too much, far too much, infrastructure to maintain.
It seems to me the US some while back abandoned trying to keep up parts of its infrastructure – roads, bridges, etc… and it has unlike the rest of the developed world failed to put money into its rail network…
U.S. infrastructure is doing just fine. The U.S. is the biggest economy in the world, so it must be doing something right. Although Joe is doing his best to destroy all our progress.
Like most Europeans, griff has the opinion that unless the federal government does something, it doesn’t get done.
Almost all of the infrastructure in the US was originally built by local and state governments. The telephone and electric infrastructure was done with private investment as regulated utilities. This infrastructure includes farm-to-market roads and highways, city streets, water treatment plants, sewage treatment plants and bridges. The federal government provided *loan guarantees* for some of this but did not provide direct expenditures. Very few defaults by local and state governments happened over our history, in fact I don’t know of any so they must have been small.
When this infrastructure was built the federal government was not nearly as large as it is now. Local and state governments could raise tax revenue sufficient to build and maintain this infrastructure. Then in the 30’s and 40’s the federal government began encroaching on the tax revenue available for local and state governments to use in building and maintaining infrastructure. That encroachment has continued apace since, mostly to finance the federal welfare state instead of financing infrastructure.
What has happened to our infrastructure was totally predictable and one of Ronald Reagan’s campaign planks was lowering the federal government’s requirement for tax revenue. Same with Trump. We haven’t had a Democrat president or legislature in modern history that has even mentioned trying to do this, all they want is more and more of the public’s money to finance their move toward Socialism.
As Margaret Thatcher predicted, sooner or later you run out of money, and that is where the US is today. The Democrats of today talk big about fixing our infrastructure but they want to finance it all with higher taxes, increased debt, and/or printing money – thus hurting our economy with inflation and lowered investment in the private sector.
The US is just beginning to pay the piper for this kind of idiotic public policy. It’s going to get a lot worse before it gets better – if it ever does.
The very idea that the federal government can cure inflation by bigger and better spending is ludicrous. It is money they don’t have and will never have.
Like most socialists, griff actually believes that Biden’s infrastructure bill was actually about building infrastructure.
Like most socialists, he’s actually stupid enough to believe that defeat of that bill means that the federal government, much less state and local governments, are no longer spending money on infrastructure.
There are of course increasingly other alternative means of storing electricity than (lithium) batteries… and for longer.
Here’s one:
Here’s how to solve the UK energy crisis for the long term – store more power | Energy industry | The Guardian
Wishful thinking, Griff. Windmills and ground-based solar are totally inadequate to power the world. Those nations that try to make it so, will bankrupt themselves.
Griff, every proposed “green” method of storing energy relies on technology which hasn’t been invented yet or is incredibly expensive or ridiculously impractical. Your link to the Guardian is a good illustration of this.
Griff, for my money, I would prefer to store massive quantities of energy inside of relatively cheap and efficient nuclear fuel rods.
We already have the basic technology needed to do this. But what we have lost, and what we need to regain, is the ability to build a nuclear power plant on cost and on schedule.
The oncoming small modular reactors will be of great value in keeping nuclear’s capital costs under control, once the industrial infrastructure for producing and deploying these SMR’s has been established and has been tuned up well enough to deliver its Gen IV reactor technology cost effectively.
The technology of an SMR, and the industrial infrastructure needed to deliver that SMR technology on cost and on schedule under tight quality assurance standards is all One Thing.
Getting the SMR industrial infrastructure fully enabled will take another decade of diligent work. At a point roughly in the mid-2030’s, an increasingly large SMR production level can begin.
If we base our decisions strictly on their comparative performance as competing energy storage technologies — my bet is that SMR’s used as both baseload generators and as load followers will reach commercial maturity well before any of the non-nuclear energy storage schemes do.
It doesn’t take much to impress griff.
griff did you read that?
The only realistic thing it mentioned was pumped storage and hydropower but the good sites for those have largely been taken. Concentrated solar power storage might workwell in the deserts of Nevada but still only provides relatively small amounts of power for a limited period of time.
As for the ‘cryogenic’ batteries and Highview Power. They are talking about a process that might be able to store enough electricity to power up to 200,000 homes for 5 hours if they can scale up to 50MW, and a cost of £105m, from their 5MW pilot. Did you know there are are around 30 million homesand millions of businesses in the UK?
This is really interesting, dare I ask where the land or sea will come from to accommodate all this renewable stuff and is this cost included?
According to the government of Canada we use about 60% of our oil for transportations. Using some kitchen engineering that is 544 499 919barrels at 1700kw per barrel or .9 Terra watts of power per year to electrify Canada’s transportation. If I figure correctly that is 176 500MW plants. That would need to be built by 2050. That’s 1 every 2 months, how possible is that? Never mind the cost
2 questions, and the reason I ask is I am trying to estimate the financial benefit of having a secure source of carbon free base load power – like nuclear v. intermittent renewables is very dependent on the cost of storage to offset intermittency
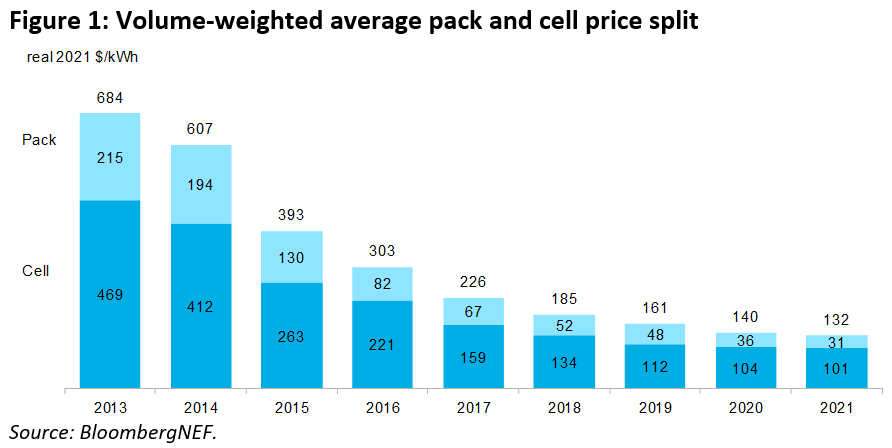
1) Cost of battery storage: the figure of $347 / kWh looks like a 2015 figure, latest average cost for 2021 is $132 kWh from Bloomberg BNEF
Battery Pack Prices Fall to an Average of $132/kWh, But Rising Commodity Prices Start to Bite | BloombergNEF (bnef.com)
2) Profile of battery capacity peaking about 250 TWh – very interested in how this is derived are you able to share details & just how you derive this value. My crude back of envelope calculation had come to about 150 TWh for 3 days of back up with peak electrical demand around 5TW but this leaves little scope for electrification of transport, heating & industrial processes.
With cost of battery storage such a significant part of your Net Zero cost estimates it would seem reasonable to take the latest costs & even to project forward costs of $80 – 100/kWh.
The Case for Nuclear – worth a look:
The Complete Case For Nuclear — Environmental Progress
Very informative but you left out one scenario. You need to show the costs of a case where all sources of energy production are used except wind and solar. That would e the most meaningful.
“I assumed that the battery efficiency is 90%”
FYI: the battery round trip efficiency is actually 82-85%. This was the conclusion by CARB in their heavy duty electric vehicle assessments. I believe this also includes the power conversion losses into the battery.
So a third to a half a quadrillion dollars…… “A (quadrillion) here, a (quadrillion) there, and pretty soon you’re talking real money.”