Guest Post by Willis Eschenbach
I stumbled across an interesting journal study the other day entitled “Solar forcing of the semi‐annual variation of length‐of‐day” It makes the following chain of claims:
• Solar sunspot-related variations somehow affect the speed of the “zonal” winds. These are the components of the winds that blow parallel to the Equator. Whether said variations affect the “meridional” winds, the component of the winds perpendicular to the equator, the study sayeth not.
• Said variations in zonal winds then affect, not the length of the day (LOD), but per the study, the “amplitude A of the semi‐annual variation of the length‐of‐day”.
This chain of effects seemed rather … mmm … let me call it “tenuous” to me, so I decided to take a look. Let me start with the overall length-of-day (LOD) data.

Figure 1. Length of Day Anomaly
As you can see, the length of the day varies on a number of time scales. Per the study:
The length‐of‐day (lod) undergoes a wide spectrum of fluctuations.
The decadal fluctuations (10 to 30 years) are mainly attributed to exchanges of angular momentum between the core and mantle of the planet [e.g., Lambeck, 1980; Jault and Le Mouël, 1991; Gross, 2007].
Seasonal changes, which include semi‐annual, annual and biennial components, are almost entirely due to variations in atmospheric zonal wind circulation (apart from an important tidal component). The amplitudes of seasonal variations are not constant from year to year, and different hypotheses have been proposed to account for this variability.
Of interest to their study are the semi-annual variations. Here’s an overlay of each of the annual anomalies in the length of day, with the anomaly taken around each year’s mean. I’ve repeated each year so we can take a look at the overall cycle.

Figure 2. Length of Day Anomaly
As the authors discussed, there is indeed a strong semi-annual swing in the length of day. It’s generally longest around April 15 with a second peak in November, and lowest in July with a second trough in January.
Now, me being a simple fellow, I figured that if you are interested in the “amplitude A of the semi‐annual variation of the length‐of‐day”, you’d, you know, measure from the peak to the trough each year. Isn’t that what “amplitude” means?
But not these good folks. Here’s their procedure:

Figure 3. Authors’ amplitude calculation method
I can only shake my head in awe. They are using a four-year centered Fourier analysis to get the amplitude of the 6-month cycle … which seems to me that they’re claiming that the sunspot-related variations can affect the future.
In addition, there’s a huge problem with their method—there is no actual six-month cycle. The distance from the November peak to the April peak is five months, not six … and as a result, we could get a stronger Fourier 6-month result both by a change in amplitude and a change in timing of the peaks.
But I was born yesterday, what do I know?
In any case, I don’t like to engage in such a procedure without looking at individual years. Here are a few of said years, with a LOWESS smooth (black/yellow lines) and an indication of the semi-annual variation (black/red lines).

Figure 4. Authors’ amplitude calculation method
I doubt greatly that a Fourier analysis of that kind of variation will tell us anything. It’s not even clear what we can call the “amplitude A of the semi‐annual variation of the length‐of‐day”
So I set that whole question aside to look at the question of zonal winds. Unfortunately, the only long-term information on this are the results of a reanalysis computer model … but “needs must when the devil drives”, so that’s what I’ve used. Here are the average zonal winds:

Figure 5. Average zonal winds, Atlantic and Pacific centered views.
Hmmm … you can see what the strong winds are doing in the Southern Ocean, the latitudes that sailors like me call the “Roaring Forties”, and the “Screaming Fifties”.
Note that on average the wind value is negative, meaning on average an easterly wind. And the direction of the rotation of the earth means that stronger easterlies will tend to slow the rotation, and thus increase the length of the day.
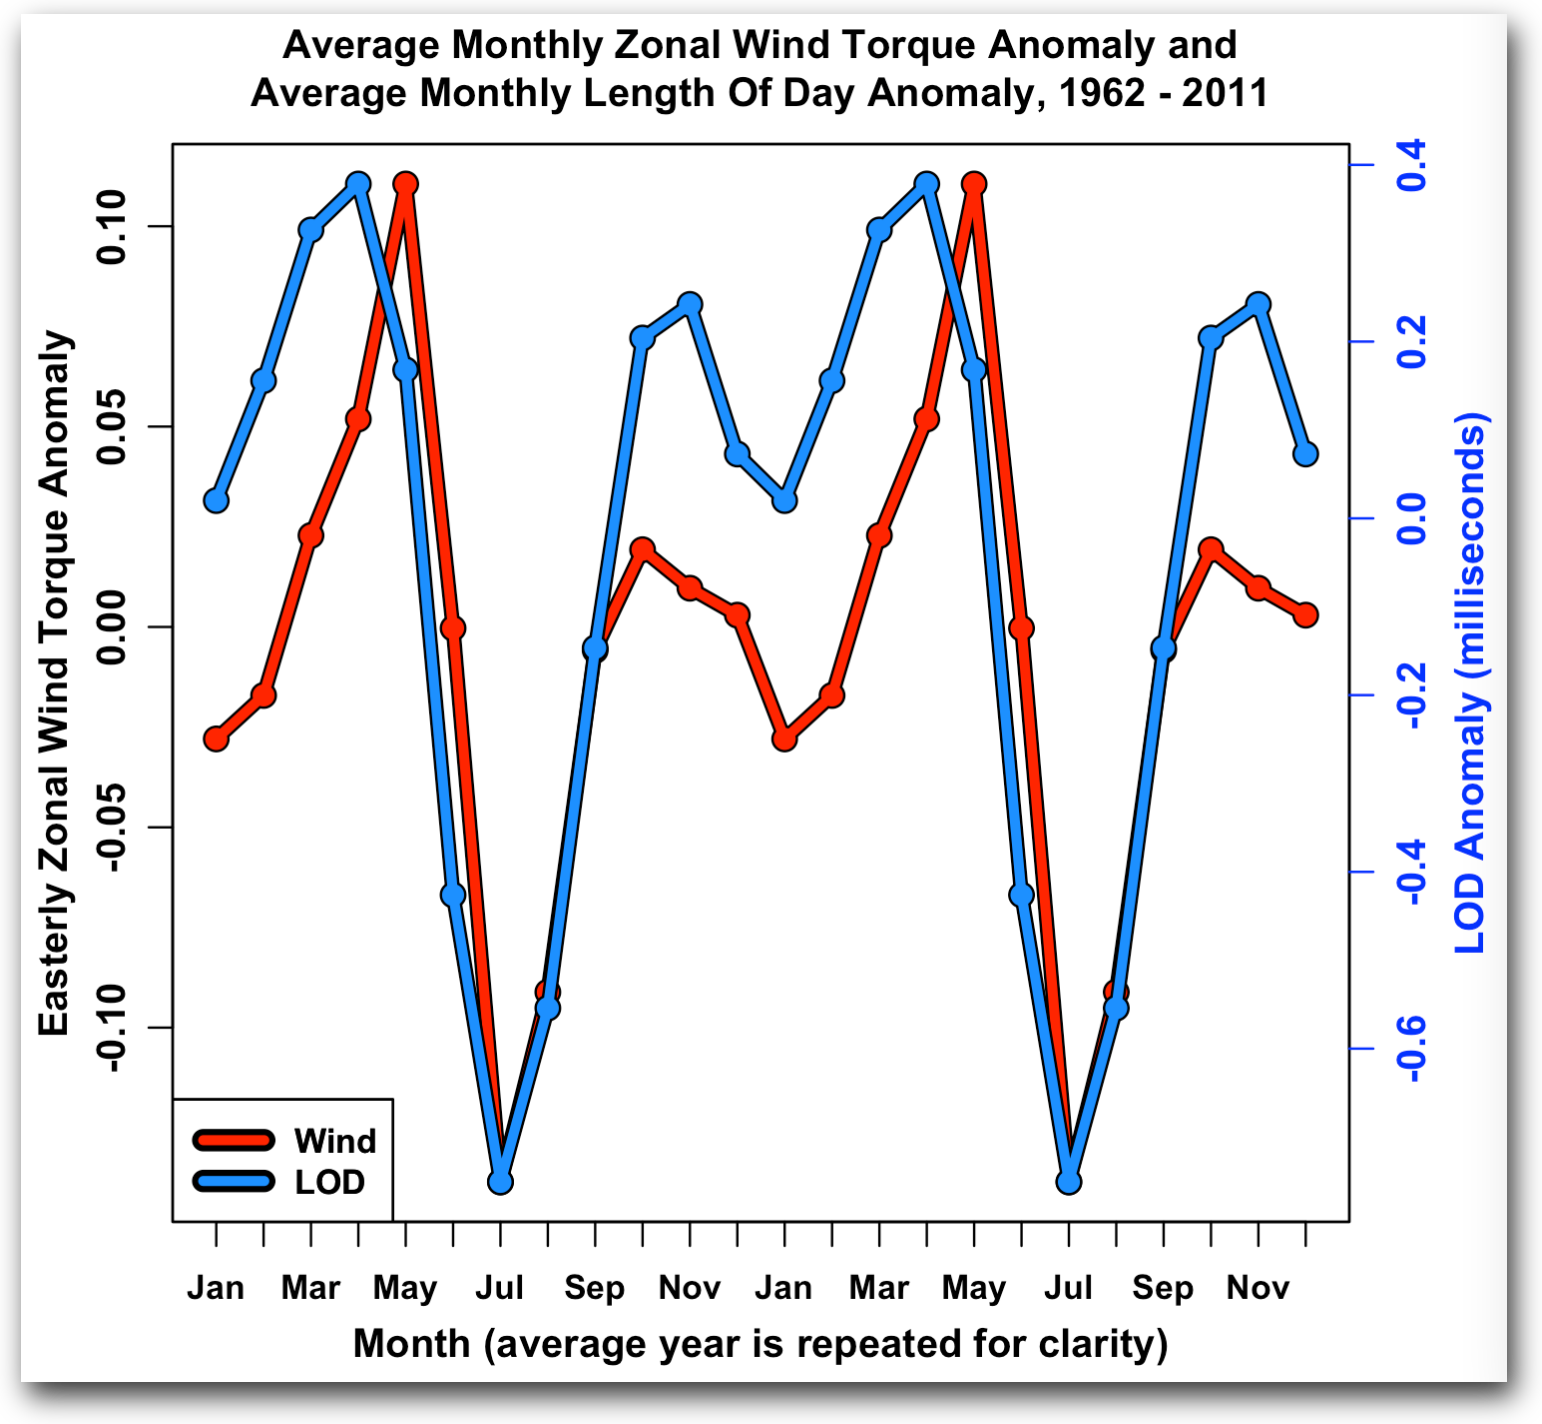
So what does the annual cycle of the zonal winds look like? I’ve taken a monthly average of both the zonal wind torque and the LOD. Here’s the comparison.

Figure 6. Average monthly zonal wind torque and monthly LOD.
As you can see, the zonal winds clearly do speed up and slow down the rotation of the earth on an annual basis.
So … is there a correlation between sunspots and zonal wind speeds? To examine that, I used a CEEMD analysis which breaks out the underlying frequencies of the two signals. Here’s a comparison of the periodograms of the CEEMD analysis of the two datasets, zonal winds and sunspots.

Figure 7. Periodograms of sunspots and zonal winds, 1948 to present
Now, the first thing you have to understand about spectral analysis is that old Joe Fourier proved hundreds of years ago that ANY time series can be broken down into individual signals which, when added together, reconstitute the original time series. So the presence of such individual signals doesn’t necessarily mean that they are externally driven.
Looking at the different signals in Figure 7 above, you can see that the sunspots (black) have a clear 11-year signal in the Empirical Modes C6 and C7, with a smaller signal at 14 years. The zonal winds (red), on the other hand, have a signal at about 12 years, with a smaller signal at 9 years.
What this means becomes evident when we plot up the two actual empirical mode 7 signals, shown as “C7” in the figure above.

Figure 7. Periodograms of sunspots and zonal winds, 1948 to present
As you can see, both signals show an ~ 11-year component … but because they do not have same period, they start out in phase and end up totally out of phase.
In other words, although the annual variations in zonal winds are clearly responsible for some part of the annual variation in LOD, I’m not finding any evidence that sunspot-related variations in solar energy are driving the zonal winds.
In closing, my excursion into the zonal and meridional winds got me to thinking about global average wind speeds in general. The actual wind speed is the square root of the sum of the squares of the zonal and meridional winds. Here’s a global view of the long-term average wind speed.

Figure 8. Average wind speed, 1948 to present, Atlantic and Pacific centered views
Wind speed over the ocean is greater than over the land, and wind speed over the tropics is greater than wind speed over the ocean. And here’s the change in wind speed over the period.

Figure 9. Monthly average wind speed, 1948 to present
And why is the small increase in wind speed of a few percent important?
Well, evaporation basically varies linearly with wind speed. And globally, evaporation cools the surface by something on the order of 80 watts per square meter (W/m2) per year. So a 4.7% increase in wind speed should convert to additional surface cooling of about 3.7 W/m2 … just saying, there are a whole lot of things going on in this immense heat engine we call the “climate” that don’t have anything to do with CO2.
Here on our northern California hillside on Boxing Day, we have rain … blessed rain, life-giving rain. I had a wonderful Christmas with the people I live with in this rambling house I built with my own hands—my gorgeous ex-fiancee, my daughter and her husband, our two-year-old granddaughter, and our two-month-old grandson. (The walls don’t slope, it’s from the camera lens.)

Me, I’m the luckiest guy on the planet …
With wishes that your life be full of joy, sunshine, and just enough rain,
w.
PS—Here are my “Letters From Mexico To My Future Ex-Fiancee“.
PPS—When you comment, please quote the exact words you are referring to, so we can all be clear on the exact topic you are discussing.
Average wind speeds increasing? I have some doubt over the accuracy of such measurements, but let us assume it is true. If so, it leads to a very complicated question.
We know there are a couple of factors driving evaporation.
a) wind speeds
b) direct insolation (should be up, if cloud cover is diminishing)
c) temperature (up, obviously)
d) relative humidity (declining)
With all the relevant factors pushing evaporation, how is it that pan evaporation is actually declining, as discussed in a lot of papers (just one example..)
https://www.sfwmd.gov/sites/default/files/documents/tech_paper_sfer_107_r.pdf
That paper refers to a decline in humidity but no decline in evaporation.
‘The decline in humidity and the increasing trend in vapor pressure deficit from 1992 to 2009 appears that the region has increasing evaporation and evapotranspiration for this period.’
I don’t see how a change in average wind speed would have much if any impact on time of day.
There are just as many winds blowing east to west as there winds blowing west to east.
“c) temperature (up, obviously)”
Which temperature? Where? There is no “global temperature”.
Where I live, the wind has certainly increased the last 3-4 years. No anecdote.
Dunno about this arguably tenuous connection, but the relationship between trade wind strength and air pressure variations, hence ENSO, has long been well established, and mechanisms observed.
A 2019 paper found again the slowdown of Walker Circulation of increased insolation at solar cycle maximum.
https://www.sciencedaily.com/releases/2019/03/190328150946.htm
One of the mechanisms, if not the main driver, is effect of increased UV fraction of TSI on ozone, as in this 2015 paper:
https://aip.scitation.org/doi/abs/10.1063/1.4930679?journalCode=apc
Just two of many since Walker discovered the Southern Oscillation by studying the Indian Monsoon, long known to correllate with the solar cycle, as does the SE Asian Monsoon.
Recent-ish studies (in a long line since 19th century) on solar cycle-monsoon effects:
Indian monsoon (2012) :
The Indian summer monsoon during peaks in the 11 year sunspot cycle
https://agupubs.onlinelibrary.wiley.com/doi/full/10.1029/2012GL051977
East Asian monsoon (2019):
Decadal Variations of the East Asian Summer Monsoon Forced by the 11-Year Insolation Cycle
https://journals.ametsoc.org/configurable/content/journals$002fclim$002f32$002f10$002fjcli-d-18-0288.1.xml?t:ac=journals%24002fclim%24002f32%24002f10%24002fjcli-d-18-0288.1.xml
‘And why is the small increase in wind speed of a few percent important?
Well, evaporation basically varies linearly with wind speed. And globally, evaporation cools the surface by something on the order of 80 watts per square meter (W/m2) per year. So a 4.7% increase in wind speed should convert to additional surface cooling of about 3.7 W/m2 ‘
Changes in horizontal windspeed are inextricably linked to changes in vertical windspeed via the Polar, Ferrel and Hadley cells.
There will be a cooling effect at the surface beneath regions of uplift but a surface warming effect beneath regions of descent.
If one speeds up the rate of such convective overturning then energy taken from the surface beneath rising air will be returned to the surface faster beneath descending air.
The faster it is returned to the surface the faster it will be radiated to space.
So, if anything seeks to warm the system then the speed of overturning will increase and energy goes out to space from the surface faster to neutralise any potential warming effect.
The reverse occurs if anything seeks to cool the system.
That is how the system thermostat works and Willis’s prior observations about tropical thunderstorms are merely a part of it.
The other aspect of all this…
As sea levels rise from the last glacial minimum
1. Ocean area increases
2. Atmospheric pressure at sea level drops
3 Less ice coverage
These all means incresed evaporation
My view is these are the dominant feedbacks that limit warming
Follow up
The Penman then simplified evaporation equation
Sorry for using wiki
https://en.wikipedia.org/wiki/Penman_equation
This is wrong.
The temperature control over tropical oceans is precise and a local phenomenon. When open ocean surface reach 31C they have persistent cloud cover that prevents further surface insolation so they go into cooling that limits the multi-month average to 30C. The convective instability is cyclic and local. Local cloud persistency limit the temperature.
This temperature limiting process can be onbserved at any of the tropical moored buoys when the surface temperature exceeds 30C.
http://www.bomwatch.com.au/wp-content/uploads/2021/08/Bomwatch-Willoughby-Main-article-FINAL.pdf
Likewise the lower temperature limit of ocean water is precisely limited to -2C by the formation of sea ice that insulates water below to reduce the rate of cooling.
The ocean surface temperature is limited to the range -2C to 30C by local processes, not global or large scale processes.
I was referring to the planet as a whole and not just ocean surfaces.
There are indeed local variations such as you mention but they get neutralised by equal and opposite effects elsewhere.
Am I the only one who suspects intentional complexification and consequent obfuscation whenever I see an analytical regime such as the authors have offered us? Is this not typical of the Carbon Cult’s approach, to make their “science” unintelligible to even sophisticated observers of their efforts to support their claims (and also to the grantors who pay them to do this sort of thing)?
And Willis, I live a bit south of you, in western Santa Rosa, and agree that these rains have been a glorious blessing for all of us.
You can thank my well-endowed female, multidecadal SoCal-dwelling cousin’s naked rain dance around a eucalyptus bonfire at dawn on the winter solstice.
The weather gods said, “Please, make it stop!” We’re throwing a damper on that backyard party.
Or, atmospheric river. Whatever floats your river boat.
Any pictures available?
There was video until divorce action was threatened.
But, hey, wheatever works.
She would have welcomed a court challenge, if her defense were saving CA from drought.
“Well-endowed female” can have a couple of meanings. If you meant “obese,” I’ll go with the weather gods. If you meant “curvaceous,” I’d curse the rain.
While mature, not in the least obese. With endowments still on her decades ago standard, with admittedly some gravitational effects.
It appears the weather gods discriminate against older women. Whatever the gods’ motivation, it worked.
True. But the test would be the same dance with women in their 20s rather than their 40s. In the former case, the atmospnheric rivers might have been delayed.
True, but the WX gods are as they are.
In figure 6 does the length of day lead the zonal wind ?
At times, although I suspect it has to do with the shortness and inaccuracy of the records.
Upon further thought, I realized I was measuring the wrong thing. I was using wind speed, when I should have been using wind torque. Torque is force times lever arm. Power in the wind is proportional to the wind speed cubed. The lever arm is proportional to the cosine of the latitude. Including those gives me this:
I’ve updated the head post to reflect this.
w.
Willis,
I am not disputing this statement, I am merely trying to establish where in your presentation you establish this fact. I assume that you are referring to figure 6?
Now that you are focusing on rotational torque as the correct issue it is clear why meridional winds have no bearing on this matter. Your implied throw-away “bad geophysicist, no cookies” comment is not a good look and sets the wrong tone for me in what follows. YMMV.
Referring directly to figure 6 note the time lag at peak positive anomalies, the LOD switch precedes the wind switch. From this some might assume that LOD anomaly is driving the Trade winds…
Curious what?
You need to test this assumption with a data sensitivity study
I think that the compilers of the data at the Paris Observatory might take issue with you there.
Planetary rotational data is measured to an exquisite degree of accuracy.
You are now studying real geophysics, not fake climate science.
Sorry for my lack of clarity, Philip. I meant the wind records, which are not actual data but are the output of a climate reanalysis model. As such, they are virtually guaranteed to contain inaccuracies.
w.
Willis,
I assume that in this statement you are referring to the Trade Winds of the Tropics, the regions coloured blue on the map in Figure 5?
East winds will slow the planet wherever, although the tropical winds will have more leverage. They also are stronger.
w.
Are these surface winds? Or do they take in the atmospheric column? Winds are at a different velocity and direction at different heights.
https://earth.nullschool.net/
Alexy,
It is only the wind strength at the surface that can transfer momentum into the body of the earth. Watch the cirrus clouds scudding by high above you when there is no wind at the ground level where you are standing.
This is why high standing meridional mountain barriers such as the Andes and the Rockies are so important, whereas zonal mountain barriers such as the Alps and the Himalayas, which are barriers to meridional winds, cannot transfer rotational torque to a zonally rotating earth.
I thought the Earth transferred momentum to the atmosphere. There is a big difference in mass. Particularly as you are suggesting that it’s only the surface that transfers momentum and not the whole atmosphere.
“I thought the Earth transferred momentum to the atmosphere.”
Alexy,
I think that we can agree that for a fluid medium such as the atmosphere momentum transfer can only take place at the surface interface due to friction and to vertical convection induced stiffness
However the issue is vacations in the LOD and not the bulk transfer of rotational momentum.
Surface winds.
w.
Willis
Figure 5 Average Zonal (parallel to Equator) Wind 1948 -2021 (positive = westerly, negative = easterly)
Legend: Blue: Maximum velocity of Easterly Trade winds -9m/s
Red: Blue Maximum velocity of Westerly winds 10m/s.
I am not following you here.
See Fig. 5, tropical winds average -3.1 m/s.
w.
Unfortunately, you are performing an analysis on Wile E. Coyote physics
I’ve read in multiple places that large earthquakes effect the length of day by multiple milliseconds, by raising or lowering patches of the planet relative to the core. These changes should remain, until weathering lowers the raised rocks, or land movement fills in the lowered areas. In either case, such recovery would take much longer than the period of this study, so in effect the earthquakes should impart a permanent step change in the time of day measurements. I don’t see any such changes in this chart.
Thing 1:
Yep. It’s like how a skater can spin faster or slower by extending or retracting their arms.
Thing 2:
‘Periodic’ means ‘repeating’.
You could apply Fourier Analysis to non-periodic signals but:
In other words, if you perform a Fourier Analysis of a non-periodic waveform and you produce a discrete set of frequencies, you’ve done it wrong. link
When I look at the above paper, I don’t see a lot of periodic waveforms.
There should be a rule in scientific papers that requires that, where a statistical tool is used, its use should be checked out by someone who actually understands the tool at a deep level.
For example, when Monckton had an actual expert check out Hansen’s use of feedback analysis, it was found that Hansen had done it wrong. Given the ease with which you can stuff numbers into Matlab, and invoke a zillion different tools, my guess is that a very significant number of published research findings would be similarly invalidated.
Commie, you say:
But that’s not what your link says, viz:
Best regards,
w.
You quote the same section I quoted from and imagine that it contradicts what I said.
I think both of you are right in a sense. A periodic waveform should give discreet frequencies that make up that waveform. Let me add that there is no requirement for a singular phenomena to cause that waveform. The sub frequencies could be derived from any kind of math, sum, subtraction, multiply or divide.
A non-periodic waveform must be made up of a continuum of frequencies from the longest wavelength to the shortest wavelength. Consider a simple DC waveform. The only way to describe it in the frequency domain is to use ALL frequencies from 0 Hz to ∞ Hz.
If we’re being picky, DC in the frequency domain is represented by a single line at 0 Hz.
A unit impulse (ie. a very narrow voltage spike) in the time domain transformed to the frequency domain has all frequencies between 0 and infinity. (Actually, when you’re signal processing, you have to consider all frequencies between plus and minus infinity. If you ignore the negative frequencies, your filter, or whatever, won’t work.)
The problem with converting a non-periodic time domain signal into the frequency domain is that, unless you’re a mathematician, you’re probably using a fft (fast fourier transform). You’re selecting, wittingly or not, a sample window containing a certain number of samples. That will result in that number of discrete frequencies. So, you’re already wrong in terms of theory.
Is there a practical objection to using a fft on a non-periodic waveform? Yes. Every time you move the window to look at a different set of samples you will get a different set of frequencies. The strong 27 Hz line you saw with the window in position ‘A’ disappears when you move the window to position ‘B’.
In light of the above, what is the point of knowing that at 03:46 on July 15, 2020, one of the frequency components of your non-periodic waveform was 27 Hz?
The foundation of modern telecommunications is the analysis of non-periodic signals. However, that works because we have very precise knowledge of the signal parameters. The same can not be said of the signals produced by Mother Nature.
Mmm … I find it hard to believe that a quake could do that. The radius of the earth is on the order of 6 million meters … seems to me that a vertical motion of a meter or so isn’t going to change things a lot.
w.
See Yun, T.Q., 2019. Earthquake fastens Earth rotation. Asian Journal of Geological Research, pp.1-9.
Thanks, Philip. The study says that the Japan 2011 earthquake shortened the day by 0.29519 μs. Less than a thousandth of a millisecond, the unit of my graphs.
This is far, far too small to even see in any of the graphs above, which was my point.
w.
Off Topic but related and perhaps of interest to many here, our commenting and posting colleague Steve Milloy wrote a brilliant article that has been reposted at CFACT titled:
Biden’s tornado climate ambulance-chasing
By Steve Milloy |December 26th, 2021|Climate, Weather
https://www.cfact.org/2021/12/26/bidens-tornado-climate-ambulance-chasing/
It has attracted the usual Trolls and at least one new one. The Troll beatdowns are delicious if any of you need to add some fun in your lives smacking Trolls…or just care to read Steve’s brilliant article.
Very nice piece. Very nice indeed. Have to work through it some more, but this looks like it is one of WE’s best.
And yes, wind speed and evaporation! It brought a smile all right, seeing that as a throwaway line at the end.
Well done Willis. Happy Christmas and a good New Year to you and yours!
Thanks, Michel, appreciated.
w.
A few Milliseconds?
Whoo boy, that got me too. Like, where’d the sun go?
A millisecond is 1/1,000 of a second. Two or three of those? My handy smart phone stopwatch won’t measure a millisecond, even if my thumb was that fast. My panic has subsided after a few thousand milliseconds of concern.
None of this was possible until atomic clocks. Now, in addition to leap years, we add leap seconds …
w.
Some years ago I did lot of stuff on the LoD, made number of charts related to other variables (sunspots, earth’s magnetic field, temperature, etc)
Here I show one of the graphs, which may be interesting or totally irrelevant, It says there polynomial de-trended but I have no details since at the moment I couldn’t trace the relevant spread sheet. One possibility is polinomial function used represents CO2 rise within the period specified, but I’m not sure.
Long as the day is long, as we say in English!
. . . or ‘until the cows come home‘
As far as CruTemp4 is concerned, its spectrum has only two dominant components (above the noise level) coincident with the AMO (9 years) and the sunspot magnetic cycle (21.8 years)
At face value, using no math or specifics about orbital mechanics, my first guess would be that the moon (18.6 yr lunar cycle) would have a far larger variable effect on wind and tides than would sunspots.
If you look at Figure 4, those large swings are from the moon.
w.
Willis,
Your memory is starting to fail. You already knew about this article and did some calculations in 2018 when you participated in a post of mine:
https://wattsupwiththat.com/2018/12/12/its-the-gradient-stupid/
As then, you just demonstrate that this kind of analysis is beyond your capability. The effect of solar activity on the speed of rotation of the Earth has been published repeatedly since the 1960s. Unlike everybody that has looked into it (including me) you seem to be unable to find it. Probably a blind spot for solar effects.
See for example:
Barlyaeva, T., E. Bard, and R. Abarca-del-Rio. “Rotation of the Earth, solar activity and cosmic ray intensity.” Annales Geophysicae. Vol. 32. No. 7. Copernicus GmbH, 2014.
https://angeo.copernicus.org/articles/32/761/2014/angeo-32-761-2014.pdf
“Starting”, or already well into Brandon dementia territory?
A continuing problem for Willis is that he has never passed through elementary college courses in physics, chemistry, geology, meteorology and climatology which would have educated him in what is already known and hypothesized.
Thus, he imagines that he has discovered previously unobserved truths, and erected conjectures thereupon.
As per Alexander Pope:
A little learning (self-directed, without formal education) is a dangerous thing;
drink deep, or taste not the Pierian spring:
there shallow draughts intoxicate the brain,
and drinking largely sobers us again.
John
But he did find time between fishing expeditions to complete the course in Climate Astrology Bubble-Bursting. Got top marks I heard 😁
Not really. His denegration of solar effects shows him no better than CACA acolytes.
Autodidacts can contribute to science, but only after absorbing what is already in the canon. Out of total hubris, Willis shuns this step, as shown by his refusal to review previous relevant papers in his few journal citations, as is standard practice.
He can’t be bothered to stand upon the shoulders of giants, since they disagree with his unsupported, idle conjectures.
John
You are too invested in the solar paradigm, as is Javier.
Autodidacts can contribute to science, but only after absorbing what is already in the canon. Out of total hubris, Willis shuns this step, as shown by his refusal to review previous relevant papers
The thing about maths is that you don’t need citations. 1+1=2 stands by itself, not needing any pal et al 1999.
Willis is addressing methodology, not narrative. The source data is available and the paper’s methods, results and conclusions can be directly repeated and tested. This is what Willis is doing and reporting.
Solar and astrophysical climate hypotheses must be straightforwardly testable if they are to be science and not astrology. There is no escape from Popperian deductive testing through sophistry and appeal to authority. So you have no choice but to endure the inquisition by Willis and others. That’s the fun part of science. Learn detachment – don’t get too attached to a theory. Think of it as a comrade in a WW1 trench.
You have it backwards. Javier and I aren’t attached to a theory. We’re all about the scientific method. That is, actual data.
Willis, knowing nothing about meteorology or climatology, has taken a simple weather observation, known for centuries, and tried to apply it to climate. Thunderstorms arise in the tropics in the afternoon. How does this affect climate?
To have any relevance to climatology, he’d have to show some 30 year or more change in some parameter in the incidence of tropical thunderstorms. Failing that, his comments on their occurence is a trivial observation of weather, noted for centuries.
I’m happy that Willis has a home with a view of the Pacific, shared with three generations of his family. But his recognition of tropical thnuderstorms doesn’t carry a climatic signal. It’s just a normal daily weather phenomenon noted for as long as observers have been in the tropics. It’s like rain and lightening storms in Florida in the afternoon.
It’s not just Javier and me. For over a century, the correllation between monsoons, and later ENSO, with the solar cycle has been noted. Also rainfall in Brazil and many other climatic fluctuations.
Tropical thunderheads every afternoon however, are just a daily phenomenon, signifying nothing, unless changes in their frequency or magnitude can be noted on 30-year cycles, hence climatic.
They’re just normal atmospheric-oceanic phenomena, explained in every freshman-level meteorological textbook. They’re not the great discovery which Willis imagines. Which is what Dr. Spencer tried to explain to Willis, but to no avail, his ego being impenetrable.
Ah, John Tillman. Another person who thinks that science consists of making a host of attacks on my education and zero attacks on my actual scientific claims … pathetic.
w.
I must admit that I don’t know where these attacks come from. To denigrate weather observations of any kind over time is a simplistic argument. The climate on this old planet encompasses a plethora of various phenomena. Trying to ascribe the changes to any one variable, be it CO2 or sunspots, is ignoring all the various piece parts that make up our earth’s climate.
Keep up the good work. I don’t always agree with what you propose but I do find that I must study more to find the ins and outs of your proposals. That is worth a lot in this old world.
Ref to the picture 6 and the comment below it ”As you can see, the zonal winds clearly do speed up and slow down the rotation of the earth on an annual basis.”
But it is opposite! The LOD leads the wind in the pict 6, and there seems to be two months hysteresis (in minima, but not in maxima). Added this to what Javier writes above, the LOD and winds are not at all in a causation between each other, but the Sun is the cause and LOD and winds are effects.
Harri, you are correct. I was measuring the wrong thing—wind speed, instead of wind torque on the planet. In other words, I was measuring wind velocity V, instead of torque, which is proportional to V^3 * cos(latitude). See the head post for the updated Figure 6.
w.
Javier, you sure throw out a lot of accusations with very little actual data. And the link you give contradicts the study we’re looking at. This one says zonal winds are affected by the sunspots. Your link says:
Hardly a ringing endorsement, and certainly contradicts the study we’re examining today.
w.
My, you think that convincing your parish here at WUWT gets you anywhere. You think that contradicting the published literature on the subject in a blog gets something accomplished. It is all gone soon even from your own memory.
Leif and you have been invaluable to me by your virtue of ALWAYS being wrong on this issue. I just wanted you to know that before the Sun rises on climate science. The night is ending.
Javier, clearly you don’t understand just how boring your endless whining is.
Come back when you are willing to QUOTE something that I said, or that Leif said for that matter, that you think is incorrect, and show us (not claim, but demonstrate) that it is wrong.
w.
CEEMD is a powerful method – you’d expect it to be more standardly used.
Generally one hears arguments that solar and upper atmosphere phenomena exert a causal effect on the climate-weather of the troposphere via various mechanisms – downward causation in the atmosphere.
Thus it was interesting to find this paper reported in Science Daily that showed the opposite – winds in the troposphere influencing weather in the ionosphere at the top of atmosphere.
https://www.nature.com/articles/s41561-021-00848-4
To quote:
Here we show the first direct evidence of the action of a wind dynamo in space, using the coordinated, space-based observations of winds and plasma motion made by the National Aeronautics and Space Administration Ionospheric Connection Explorer. A clear relationship is found between vertical plasma velocities measured at the magnetic equator near 600 km and the thermospheric winds much farther below. Significant correlations are found between the plasma and wind velocities during several successive precession cycles of the Ionospheric Connection Explorer’s orbit.
So there is the possibility of cause-effect ambiguity. Correlation of ionosphere with troposphere processes does not necessarily imply downward causation; it can be upward as well.
“doing” or “going?” I’ve read the sentence a couple times, and I’m not getting it. Help?
Good piece. Thanks.
Some words got inadvertently erased … fixed, thanks.
w.
Figure 2 reminds me strongly of the equation of time: https://en.wikipedia.org/wiki/Equation_of_time
I wonder if authors did compensate – or maybe overcompensate – for astronomical effects, namely the Sun moving along the analemma, a curve representing the angular offset of the Sun from its mean position on the celestial sphere as viewed from Earth.
This post has got me looking through my old daily weather record l kept between June 1979 and June 1982. To find a tale of a very cold December’s and wind direction here in England.
December 1981 was England’s 3rd coldest December since 1890 and twice daily l recorded the wind direction. Here is the results for the month.
NE 16
SE 13
NW 11
North 9
East 9
South 3
West 1
Notice how the shutting down of the supply of mild air from over the Atlantic causes winter temps to crash here in England. Wind direction and the weather patterning linked to it, are far more important too climate then CO2 levels will ever be.
Here’s an idea.. maybe we should power up the windmills and cancel out these wind effects, thereby stabilising the planet’s rotations!
What..? they clearly can’t generate the amount of power they’re supposed to, might as well get some use out of them..
Tropical storms mentioned in a number of comments above follow equatorial electrojet ( narrow ribbon of electric current that is flowing eastward in the day time in the equatorial region of the Earth’s ionosphere).
Plasma bands directly follow geomagnetic equator – green line.
Dotted white lines mark regions where rising tides of hot air indirectly create the bright, dense zones in the bands.
The bright plasma pairs are areas with large and intense thunderstorm activity,
(click on the image for a clear view)
Fascinating, Vuk. What is the source of the image, and is there gridded data available?
w.
Hi
It is composite of two images. One you are interested is from NASA/Goddard centre (link)
http://www.nasa.gov/centers/goddard/images/content/154188main_plasma_bands_lgweb.jpg
The other shows position of geomagnetic equator in 2005, I have no link but there are numerous examples on the internet.
Related NASA article is here:
https://www.nasa.gov/centers/goddard/news/topstory/2006/space_weather_link.html
Hope that is of some help.
W. Great explorations and fun graphs.
Key take away: “So a 4.7% increase in wind speed should convert to additional surface cooling of about 3.7 W/m2”
That 4.7% increase in wind speed since 1948 Fig 9 suggests a link to the increase in global temperature over that period.
David L. H
For those wishing to explore further, see lots of recent pretty frequency analyses on the atmosphere by Ma et al.
Ma, L., Kosek, W. and Han, Y., 2020. Interannual and Intra-seasonal Oscillations in the Length of Day, Atmospheric Angular Momentum and Atmospheric Surface Pressure Time Series Observed at Chosen Meteorological Stations Near the Equator.
https://assets.researchsquare.com/files/rs-39392/v1_covered.pdf
Sliwinska et al explore angular momentum of the hydrosphere.
Śliwińska J, Nastula J, Wińska M. Evaluation of hydrological and cryospheric angular momentum estimates based on GRACE, GRACE-FO and SLR data for their contributions to polar motion excitation. Earth, Planets and Space. 2021 Dec;73(1):1-20.
https://link.springer.com/article/10.1186/s40623-021-01393-5
For the fun of comparing amplitudes of the atmosphere, oceans, hydrology, and earth core angular momentum (and the challenge of detecting those “fearsome” gravitational waves) see:
Séverine Rosat, Josipa Majstorović. Perturbation of the Earth’s rotation by monochromatic gravitational waves from astrophysical sources. Physical Review D, American Physical Society, 2021, 103(10), 10.1103/PhysRevD.103.104052. hal-032338
https://hal.archives-ouvertes.fr/hal-03233840/document
“So a 4.7% increase in wind speed should convert to additional surface cooling of about 3.7 W/m2”
Identical in magnitude but opposite in sign to the forcing from a doubling of CO₂. Strange, that.
The two annual minima of LOD are in January and July (figure 6);
it’s interesting to speculate if this is connected in any way with aphelion and perihelion of earth’s orbit, at the same two time points.
Possible, but why would two minima (LOD) be connected with a maximum and minimum (solar distance)?
As always … more questions than answers.
w.
I thought climate change was causing wind to decrease instead of increase, in Europe at least
My confidence is low.
I read this last week
Earth is spinning FASTER now than it was 50 years ago, scientists say
https://www.dailymail.co.uk/sciencetech/article-10332345/Earth-spinning-FASTER-50-years-ago-sc
At what height is the windspeed measured? It’s not clear to me how this is dealt with.
I believe the standard height is 10 meters for “ground” measurements.
But if it was measured at, say, 5000 meters, in the jet stream, would that change the results?
If the poles are indeed warming faster than the equator, the reduction in temperature difference will reduce wind speeds in a Carnot heat engine.
This contradiction stronly argues that either the poles are not warming as reported or the wind speed observations are wrong.
Thanks, Ed. Actually, said polar warming should reduce the meridional winds, not the zonal winds. However, in a large complex system such as the Earth, this may not be a direct relationship.
w.
Humidity changes could also affect wind speed, by changing convection rates due to the buoyancy of water vapor.
Intriguing as always.
How robust is the science that “winds cause the earth to slow down”?
It is fairly clear differential heating causes wind. This heating being due to the rotation of the earth and the terminator sweeping over the surface of the earth.
However, the mass of air, moved by whatever cause, must be replaced with an equal(ish) mass of air from another region. One could view this on a small scale of farmers fields causing thermals plus wind and a large scale of land warming faster than ocean.
How any of this wind movement can interact with the near vacuum of space, I do not understand.
Friction between the surface and the surface touching air, is irrelevant. You only need to experience a still day to realize the air about you is traveling along at exactly the same speed as the surface you stand on. Only local winds, as described above, will disturb that.
I can understand trade winds caused by the daily terminator sweep, ‘stroking’ the surface.
I can understand the El Nina etc causing the earth to change speed due to the conservation of angular momentum if wide areas of the sea-level change. But these must average out. El Nina are cyclic warm currents probably caused by the terminator sweep with a long cyclic term.
What am I missing?
It’s surprising how little the authors understand about practical application of DSP theory…and the reviewers too. For example, consider all the apparent noise on the blue curves in their Figure 1. This is caused by the authors’ failure to properly window the 4-year data segments prior to FFT calculations.
They prove their ignorance in note [7] following figure 1, saying about segments only 1 or 2 years in length, “short period noise becomes larger.”
It appears they increased the segment size to 4 years in an attempt to swamp out the spectral noise from the non-windowed discontinuity between ends of the data. Properly windowing the data gives perfectly smooth results for 1 year segments.
But that’s not the real issue, I think. The real problem is that none of the data is truly periodic. What it is, is a random variable from a random process. Okay, there are some periodic components in there but they are so heavily modulated by processes we don’t understand (and cannot predict) that it may as well be random.
If you want to know about correlation, how about just computing the cross correlation sequences beetween LOD and SSN or LOD cosmic ray flux? You’re making way fewer assumptions with that approach. Just for fun, I did that and the attached image shows the result.
The correlation coefficient isn’t all that large, but there is a roughly 11-year periodicity in the cross-correlation.
Thanks, Observer. You have to be very careful with a cross-correlation of a strongly cyclical signal like say sunspots. You’ll find, for example, a strong cross-correlation with a unit impulse, or in fact with just about any complex signal … which means nothing.
w.
I’m not sure I understand your point. Even though the sunspot and cosmic ray data contains strong cyclical content, the cross correlation with LOD data would not be cyclical unless LOD also contained similar cyclical content. What am I missing?
Okay, never mind…I see it now.
Ozone blockade of the polar vortex in the lower stratosphere over Kamchatka.
Do you see an impact on the meridional jet stream over the west coast?
https://earth.nullschool.net/#2021/12/29/2200Z/wind/isobaric/250hPa/orthographic=-131.13,46.40,562
In four days, a powerful stratospheric intrusion will bring severe cold to the central states.
“So … is there a correlation between sunspots and zonal wind speeds?”
There should be a phase shift from the 1990’s, because the zonal winds would be responding to changes in the solar wind strength rather than sunspot cycles.
Not sure what you are calling “solar wind strength”. Do you have a link to a dataset?
Thanks,
w.
I have been through this on more than one occasion in the past with you, in response to the false claim that the solar wind variability follows sunspot cycles. The major lows in the solar wind shifted from around sunspot cycle maximum in 1969 and 1979-80, to just after sunspot cycle minimum in 1997 and 2009. The solar wind strength is a combination of speed/temperature and pressure. Note how in your figure 9 that the wind speeds shift faster from the mid 1990’s, which is when the solar wind weakened from, and of course when the AMO warmed from. There is probably also an ENSO influence on wind speeds.
https://omniweb.gsfc.nasa.gov/form/dx1.html
Thanks for the link, Ulric. You say “solar wind strength is a combination of speed/temperature and pressure”. The OMNIWeb site lists the following:
How are you “combining” them to give you “solar wind strength”? And what are the units of the final combination?
Regards, and best of the New Year,
w.
I just love it when a mathematical exersize actually has a point to itself.
Like crushing nonsense arguments and driving “scientists” mad.
Oddgeir