Guest Post by Willis Eschenbach
The “CO2 Roolz Temperature” theory goes like this:
• The amount of atmospheric CO2 increases.
• This absorbs more upwelling longwave radiation, which leads to unbalanced radiation at the top of the atmosphere (TOA). This is the TOA balance between incoming sunlight (after some is reflected back to space) and outgoing longwave radiation from the surface and the atmosphere.
• In order to restore the balance so that incoming radiation equals outbound radiation, the surface perforce must, has to, is required to warm up until there’s enough additional upwelling longwave to restore the balance.
Now, I’ve mentioned before that this theory is untrue because there are several other ways that the TOA radiation balance can be changed or restored. These include:
• Increased cloud or surface reflections can reduce the amount of incoming sunlight.
• Increased absorption of sunlight by the atmospheric aerosols and clouds can lead to greater upwelling longwave.
• Increases in the number or duration of thunderstorms move additional surface heat into the troposphere, moving it above some of the greenhouse gases, and leading to increased upwelling longwave.
• A change in the fraction of atmospheric radiation going upwards vs. downwards can lead to increased upwelling radiation.
• Increased advection (horizontal movement) of heat from the tropics to the polar regions can increase the amount of upwelling longwave radiation
When you think of a top-of-atmosphere (TOA) radiation balance, it’s normal to imagine that all over the earth, the TOA is pretty much in balance everywhere. However, nothing could be further from the truth … here’s the TOA imbalance as shown in the CERES satellite data.


Figure 1. Top-of-atmosphere (TOA) average radiation balance, March 2000 to February 2021. Positive values show an imbalance where there is an excess of incoming solar radiation compared to outgoing longwave (thermal) radiation, and vice-versa regarding negative values.
As you can see, the only place where incoming and outgoing radiation are equal is shown by the black/white lines. In the tropics, there’s much more net incoming solar radiation (after reflections) than outgoing longwave radiation. And outside of that region towards both poles, there’s much more outgoing longwave radiation than incoming solar radiation.
This is the result of the “advection” mentioned above, the polewards horizontal transfer of energy via ocean currents and atmospheric movements. And this is a gigantic movement of energy. It is a constant flow of about 15 petawatts (1015 watts) across the black/white lines above.
How much energy is that? Well, if you put a 1-gigawatt nuclear power plant every three meters along the black/white lines above that circle the earth at about 40°N/S of the Equator … that’s how much energy they’d generate in total.
Or to look at it another way, it’s more than a thousand times the ongoing total primary energy consumption of all the people on the planet.
With that as background, let me return to the question of the TOA balance. Increasing CO2 absorbs more upwelling longwave, leading to less outgoing longwave at the TOA. This makes the TOA balance more positive.
And in theory, increasing surface temperature should increase the amount of outgoing longwave at the TOA. This would make the TOA balance more negative. In short, when the surface temperature goes up, the TOA balance should go down …
In considering this, I realized I’d never actually looked at this relationship. Here, again from the CERES dataset, are the two variables in question—surface temperature and TOA imbalance.

Figure 2. Change in surface temperature, March 2000 – February 2021
This is in good agreement with other global surface temperature reconstructions, such as Berkeley Earth and HadCRUT, although each of these global temperature datasets differs slightly from the others.
Next, I looked at the change in the TOA imbalance.

Figure 3. Change in TOA radiation imbalance, March 2000 – February 2021
When I saw that, I said something that sounded very much like “YIKES!!”.
Why?
Well, if you recall from above, as temperature goes up, TOA imbalance is supposed to go down … but it’s not. The TOA imbalance not even staying level. It’s going up.
To investigate this further I created a scatterplot of the TOA imbalance versus surface temperature … and here’s that chart.

Figure 4. Scatterplot, top-of-atmosphere (TOA) radiation imbalance versus surface temperature, March 2000 – February 2021
Same problem, only worse—there is NO statistically significant relationship between surface temperature and the TOA radiation imbalance.
Curious … clearly, the conclusion from this has to be that the other factors that affect the TOA balance have much more effect than the change in surface temperature.
To me, this isn’t a surprise. I see the climate system as a giant natural heat engine that is ruled by the Constructal Law discovered by Adrian Bejan. According to the Constructal Law, flow systems far from equilibrium must constantly change and evolve in order to persist … and as a result, as in this case, the simplistic assumptions of modern climate science simply don’t pan out. Here’s Figure 1 of an analysis of the climate by Bejan and Reis entitled “Thermodynamic optimization of global circulation and climate” …

Note how the climate system naturally evolves to have a high-temperature area AH and a low-temperature area AL … compare that to Figure 1 at the top of this post. The Bejan/Reis paper is most fascinating. I cannot recommend it enough to anyone seriously interested in climate. The Constructal Law is the first new law of thermodynamics in over a century, and it applies to a wide variety of natural systems. Further information on the Constructal Law is available at constructal.org, along with an excellent article on the subject in Forbes magazine here.
Further thoughts on the matter gladly accepted …
w.
Como De Costumbre: When you comment please quote the exact words you are referring to. This avoids much of the misunderstandings that plague the intarwebs. I can and am happy to defend my own words. I can’t defend your interpretation of my words.
A Technical Note: Over the 21-year period, the upwelling LW from the surface has increased by ~1.5 W/m2, of which about 1 W/m2 makes it to space without being absorbed by GHGs and redirected back downwards. This should have decreased the TOA imbalance by about 1 W/m2.
And over the same period, the increase in CO2 forcing should have increased the TOA imbalance by about 0.6 W/m2. The net result should have been a 0.4 W/m2 decrease in the TOA imbalance over the period.
Instead, we’ve seen a 0.8 W/m2 increase in the TOA imbalance … which is why I said “YIKES!”.
I took a Thermodynamics class from Adrian Bejan in 1979. Wow, that guy was way smarter than I was!
At least this makes claer that the simplified sunday paper addendum presentation is missing the point in overly simplifying the equation. In particular the plot disproving direct correlation is very convincing. But what can one expect with radiation energy being a function of T to the fourth power, selective wavelength absorbtion of greenhouze gasses day and night cycles seasonal patterns and variable water vapour distribution, not to mention el nino and la nina.
https://agupubs.onlinelibrary.wiley.com/doi/10.1029/2021GL093047
Abstract
Earth’s Energy Imbalance (EEI) is a relatively small (presently ∼0.3%) difference between global mean solar radiation absorbed and thermal infrared radiation emitted to space. EEI is set by natural and anthropogenic climate forcings and the climate system’s response to those forcings. It is also influenced by internal variations within the climate system. Most of EEI warms the ocean; the remainder heats the land, melts ice, and warms the atmosphere. We show that independent satellite and in situ observations each yield statistically indistinguishable decadal increases in EEI from mid-2005 to mid-2019 of 0.50 ± 0.47 W m−2 decade−1 (5%–95% confidence interval). This trend is primarily due to an increase in absorbed solar radiation associated with decreased reflection by clouds and sea-ice and a decrease in outgoing longwave radiation (OLR) due to increases in trace gases and water vapor. These changes combined exceed a positive trend in OLR due to increasing global mean temperatures.
And:
https://agupubs.onlinelibrary.wiley.com/doi/10.1029/2021GL094888
“The two-decade decrease in earthshine-derived albedo corresponds to an increase in radiative forcing of about 0.5 , which is climatologically significant (Miller et al., 2014). For comparison, total anthropogenic forcing increased by about 0.6
  over the same period. The CERES data show an even stronger trend of decreasing global albedo over the most recent years, which has been associated to changes in the PDO, SSTs and low cloud formation changes. It is unclear whether these changes arise from the climate’s internal variability or are part of the feedback to external forcings.”
As I recollect, that was 0.5 +/-0.5 W/m^2, probably not statistically significant.
TOA energy balance isn’t known to better than ±3.9 W/m^2.
A better paper discussing this finding doesn’t fiddle with the data like Loeb et al.
“… the root cause for the positive TOA net flux and, hence, for a further accumulation of energy during the last two decades was a declining outgoing shortwave flux and not a retained LW flux. ” – Hans-Rolf Dübal and Fritz Vahrenholt, October 2021, journal Atmosphere, Radiative Energy Flux Variation from 2001–2020.
https://www.mdpi.com/2073-4433/12/10/1297/htm
Here’s the key finding when looking only at CERES data.
“The declining TOA SW (out) is the major heating cause (+1.42 W/m2 from 2001 to 2020)”
Essentially, what Willis is seeing is the increase in solar energy (due to a 1.5% reduction in clouds) absorbed by the biosphere. This is where it gets even more interesting.
“The change of the longwave downwelling radiation can be interpreted in part as the additional effect of the increased greenhouse gas concentration. For the “Clear Sky” it is +1.20 W/m2. In the “Cloudy Areas”, this effect is negative (−1.48 W/m2) so that the sum of these values is −0.14 W/m2 .”
So, the greenhouse effect emerges in clear skies (could be due to just water vapor) but disappears over cloudy skies. Since 2/3 of the planet is covered by clouds that means 2/3 of the greenhouse effect doesn’t exist.
The Loeb et al claim of some effect from “trace gases” was manufactured by using a model and other non-CERES data. Nothing in the CERES data supports that claim.
PS. Isn’t it interesting that the CERES temperature data is almost an exact match to UAH.
Thanks, RIchard, good stuff. Here’s UAH MSU as a function of the CERES temperature data:
Onwards …
w.
Anthony
Earth’s recent decreased albedo is partly due to global greening, significantly shown by satellite:
https://www.nature.com/articles/nclimate3004
and plant metabolic research at the leaf level:
https://agupubs.onlinelibrary.wiley.com/doi/full/10.1002/2016GL070710
https://onlinelibrary.wiley.com/doi/full/10.1111/gcb.14950
It’s a testable theory. Hang on … ok, here’s what I find:

Looks like you’re right … gotta love CERES data, always more to winkle out of it.
w.
Thanks!
Here’s figure 1b from Vanessa Haverd et al 2019 which looks like the perfect counterfoil to your land albedo curve (GPP is gross primary production):
Sorry – used my sock puppet name by mistake (anagram of Greta Thunberg)
Green is in the most intense part of the solar spectrum. So with more green, more energy is reflected. Vegetation cools, for many reasons. Albedo is not a thermal property, it´s for optics. Snow and ice for example, is completely black in infrared wavelengths. Solar irradiation is 51% IR.
Good points, Willis. Conceptually, the longwave emitter that matters is not the surface. It is higher up, supplied mostly with energy by the atmosphere as the working fluid of its own heat engine operation. A corollary is that heat energy cannot be accumulated in the land and oceans to harmful effect by what non-condensing greenhouse gases do. I greatly appreciate how long you have consistently described the “emergent climate phenomena” aspect of climate concerns in terms that make such good sense. Thank you.
Interesting as always. I am curious how you went from the actual incoming and outgoing numbers to a total that represents aggregate imbalance. I assume it was by adding all of the various grid cells. Do you have a feel for the error rates involved? I assume Figure 3 is monthly data. Is it correct to add all of the reported imbalances in figure 3 to get the aggregate imbalance over the entire period? It seems like it would be a large number if so.
Good questions, Nelson. The CERES data is provided on a 1° latitude by 1° longitude gridded basis. So all of the aggregates need to be area-weighted based on the physical size of the gridcells.
As to the error rates, the precision is undoubtedly greater than the accuracy. There’s a discussion of that here.
As to “add all of the reported imbalances in figure 3 to get the aggregate imbalance”, these are all fluxes in watts. The aggregate imbalance would be in joules (or watt-hours), so you’ll need to convert first. One joule is one watt-second, or one watt-hour = 3600 joules.
w.
Note that, although satellite measurements are used try try to measure changes in TOA radiative (im)balance (a/k/a Earth’s Energy Imbalance, or EEI), the absolute scale of it is not directly measurable.
NASA estimates it at 0.6 W/m², but that’s not measured by satellites, it’s guesstimated from other factors, like ocean temperature changes (and I’m pretty confident it is too large). Here’s an excerpt from a recent paper by Loeb et al:
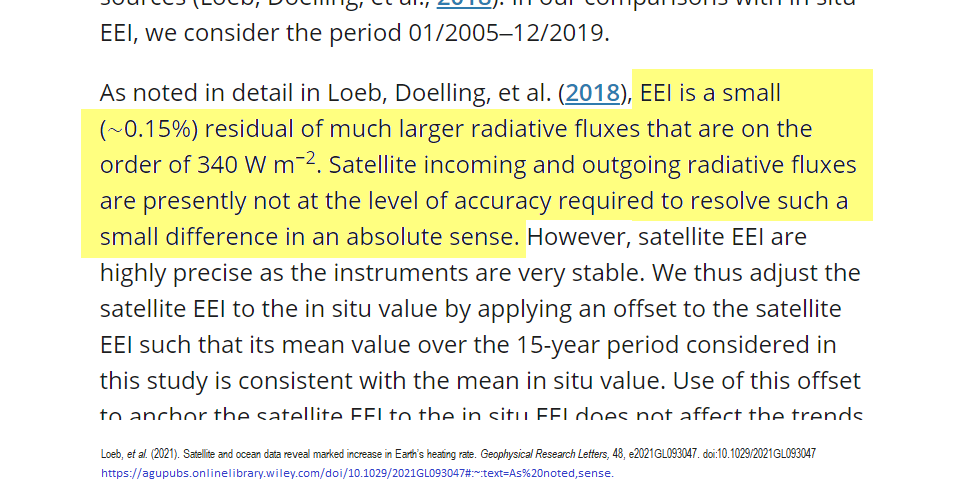
Loeb’s “∼0.15% residual of much larger radiative fluxes that are on the order of 340 W m⁻²” works out to 0.51 W/m², yet in another place in the same paper they estimate it as 0.8 W/m². That should tell you something about the uncertainty of that figure.
That +0.6 W/m2 value comes from Trenberth 2009 which itself used older data so it’s definitely an outdated estimate. The newest and most comprehensive estimate is +0.87±0.12 W/m2.
Their estimate is inconsistent with the plausible ranges of other climate parameters. A realistic value is about 0.3 W/m².
That is a super cool site. It looks like the +0.70 W/m2 figure in the alternative alarmist column is the one most consistent with observational estimates provided WE in this post and Schuckmann et al. 2020.
In the end, the system has to remain stable even without radiative gases or clouds. Hence the work by myself and Philip Mulholland previously published here and elsewhere involving firstly an entirely transparent atmosphere and then applying the basic principles to Earth Venus and Titan. For Earth see here:
https://www.researchgate.net/publication/342109625_Return_to_Earth_A_New_Mathematical_Model_of_the_Earth's_Climate
Considering advection is fine but advection is part of a complete convective overturning cycle and cannot subsist on its own where one has a mobile three dimensional mass of gas.
Thus we are forced to the conclusion that changes in convection, particularly the speed of convection, are all that really matter.
Hence the significance of those black/white lines where radiation nets out to zero.
To maintain a stable atmosphere in the face of ALL potentially destabilising factors (including radiative gases) all that is necessary is to shift those lines poleward or equatorward.
For such shifting to occur one simply needs to alter the size shape and intensity of the Polar, Ferrel and Hadley cells.
Changes in vertical lapse rate slopes caused by ANY destabilising influences will automatically alter the speed of convective overturning from place to place in order to neutralise those destabilising influences.
Since our DAET model works for a completely transparent atmosphere it follows that both the surface temperature enhancement and the maintenance of it over time are solely features of convective overturning.
If there were no such overturning then the atmosphere would thermodynamically behave like a solid with uniform temperature from top to bottom that would be limited to the temperature predicted by the S-B equation.
It is only when convective overturning is added that one then sees the development of a lapse rate slope and an enhanced surface temperature.
One can argue that the convective changes required to neutralise the effect of radiative gases do amount to climate change but it would appear that the scale of those changes are too small to measure compared to internal system variability.
Furthermore, radiative material within a convecting atmosphere actually slows down the speed of convection since it introduces an additional route for radiation to space from within the atmosphere. Radiative gases actually make our climate zones much more equable.
The more radiative material within an atmosphere the less hard convection needs to work in order to return energy to the surface beneath descending air in order to balance total radiation out to space from both surface and atmosphere with radiation in from space.
Thanks to Willis for that very useful diagram showing the areas of zero net radiation balance.
Questions popping into mind:
1.) How far would the shift of the “Eqi-TOA” LINE have to be (from whatever the “perfect” location might be) to generate the Catastrophic 1.5°C rise ?
2.) How stable has this “Eqi-TOA” demarcation line been?
Thanks, Doc, good questions.
The issue isn’t the location of the line. It’s how much energy is moved. If the movement of energy slows down, the world warms, and vice versa. Here’s the change in that value:

Since it’s increasing, it shows that the effect of the advection is to cool the planet.
As with many things climatical, quite stable … here’s a movie I just made for you. We’re nothing if not a full-service website.
w.
I suggest that if anything tries to warm the world then more energy is moved and vice Versa.
That’s not consistent with what I’m seeing Stephen, faster, deeper jetsteam flow since at least Nov 2019 in the NH, and zonal flow is dominating since soon after (early Jan 2020).
https://joannenova.com.au/2021/11/weekend-unthreaded-388/#comment-2495077
and right now …

It was a nice theory Stephen, really, it made sense, but Earth is currently in disagreement, it’s curiously doing the exact opposite to achieve an average faster and higher volume (deeper) and thus higher energy flow.
Which fits the expectation here.
It’s time to pay full attention to this locked zonal flow pattern.
We do see limited periods of locked zonal flows in favoured regions within the generally wavier meridional pattern.
That doesn’t render the entire system more zonal.
One can argue that more total energy is required to shift the global jet stream tracks meridionally rather then maintain a simple zonal flow.
Stephen, I can pick any random day during this winter (or the last two winters) and show you an image of a ZONAL dominated NH jet flow pattern, that is locked in place. And stretches 2/3 the circumference of the earth. squiggles across North America and arcs over the Atlantic where it resumes the overwhelmingly dominant NH zonal pattern.
It is not a fluke, that’s the pattern we’re actually seeing.
Zonal flow cooling.
With secondary meridional flow cooling pulses.
This is not occasional, this is by far the dominant pattern of the NH jet flow, and has been since ~Jan 2020. with some resumption of a more ‘normal’ unlocked ‘fluid’ flow during the intervening lower energy flow summer pattern.
I like your thinking-out-of-the-box: “To maintain a stable atmosphere in the face of ALL potentially destabilizing factors (including radiative gases) all that is necessary is to shift those lines poleward or equatorward.
For such shifting to occur one simply needs to alter the size shape and intensity of the Polar, Ferrel and Hadley cells.”
Any brain storming ideas how to do that? Does a wavy jet stream preclude such? Which direction should they be shifted – poleward or equatorward? Seed clouds all along their path?
What could possibly shift those neutral EEI lines?
They are shifted by changes in the regional lapse rate slopes, those changes cause a response in the form of adjustments in the speed of convective overturning.
Warming sends them poleward and cooling pulls them back equatorward.
Wavy jet streams are part of the process.
Wavy jets occur when the lines are pulled back equatorward and vice versa. Wavier jets produce more clouds and cooling. Straighter jets less clouds and warming.
Advection does produce a one way heat transfer between oceans and land. Heat input at the ocean surface evaporates water that gets advected to land where it condenses, releasing heat to space but also slowing down the loss of heat from the land surface to effectively warm the surface.
And the ocean-land heat transfer is not trivial. It amounts to about 43Tt of water evaporated every year and deposited on land. The global land mass always loses radiated heat and the global ice-free oceans always gain radiated heat.
The distribution of water and land over the surface have an impact on the global temperature. If Earth was all water then the surface would be warmer on average. In the current precession cycle, the insolation over oceans peaked 400 years ago. Since then the oceans have been warming as the water cycle between oceans and land is slowing down and oceans retain more heat. Upwelling of deep, cool water in the high to low latitude ocean circulation has been slowing down for 400 years.
Warming of the oceans cannot be achieved by increasing surface radiation unless all the sea ice is eliminated. The oceans warm by slowing down upwelling due to reduced
True, but my point is that advection is always part of a vertical overturning circulation.
But the constituents of the atmosphere are not constant. The water can and does occur in three phases in any atmospheric column. Its phase dramatically alters the conditions of any atmospheric element.
Water on the surface and in the atmosphere provide the upper and lower temperature regulating mechanism. Water driven process regulate the temperature. Temperature controls the insolation reaching the surface and OLR leaving the atmosphere. The radiation balance is the result of temperature controlled processes.
And you cannot treat the atmosphere in isolation over a water surface. Water that is evaporated in the tropics drops out at higher latitudes and over land to be returned through ocean circulations back to the tropics. The present observed ocean warming is the result of reduced upwelling as the water cycle between ocean and land is slowing down.
Water is the main heat transport component of the atmosphere as well as the oceans. It alters the lapse rate markedly.
Whatever happens to the water in terms of radiative effects is simply neutralised by convective adjustments.
Not sure about this. A solid with a warming at one end and a cold end at the other will have a gradient across it. The conductivity will control the shape and value of that gradient. Under equilibrium, the radiation to space from the “solid” also affects the gradient.
That might be so for a solid heated from below but not for a solid heated from above. The analogy with a solid is not exact because a solid is never as transparent to radiation from above in the same way that a non-radiative gas can be.
In any event such a gradient within a solid would not be related to density and pressure in the way that it is for a gas so there would be no lapse rate involved in any gradient that might develop.
“Well, if you recall from above, as temperature goes up, TOA imbalance is supposed to go down … but it’s not. The TOA imbalance not even staying level. It’s going up.”
But such a statement relies on nothing else changing and also assumes that everything is in equilibrium. And neither are true. Since 2000 atmospheric CO2 levels have increased by nearly 10% and so you would expect that the TOA imbalance to increase as a result. The surface temperature will response but at a much slower rate since it takes hundreds if not thousands of years for the temperature to reach an equilibrium due to the heat capacity of the oceans. As long as CO2 levels keep rising there is no reason expect the TOA imbalance to go down.
Plus of course it is worth noting that if Willis analysis of the CERES data is correct then the earth is on track for 2 degrees of global warming by the end of the century. Which is a lot more than most models are predicting.
And you still think Benghazi was started by an internet video….hmm
Izaak said:
Izaak, that number seemed high, so I checked it. It’s actually 0.14°C per decade. My bad, I’ve fixed the graphic.
w.
Coincidently, .14c a decade is what UAH shows as the trend since the satellite record began in 1979.
UAH trend over the same dates as the CERES data is over .16 C / decade. Everyone loves to claim UAH is a low outlier yet it is higher than the CERES data.
https://woodfortrees.org/plot/uah6/from:2000.16/to:2021.08/offset/plot/uah6/from:2000.16/to:2021.08/offset/trend
Thanks, Richard. Both the MSU and the CERES temperature data are hugely autocorrelated, with Hurst exponents around 0.9. As a result, the uncertainties of their trends are large enough to overlap, so we can’t say much about the difference between them.
WE, your final scatter plot got me thinking. After some digging around, I found an answer at Ceres.larc.nasa.gov. The Ceres net flux radiation budget ”is an 8 dimension sampling problem” that tries to integrate between now 5 different satellites. The target uncertainty for the final EBAF product is +/- 2W/m^2. The range in your scatterplot isn’t about +/-1.5W/m^2. So it is possible that the obvious lack of correlation is just data uncertainty.
That said, the lack of the ‘expected’ relationship between surface temp and radiative imbalance certainly shows that the ‘CO2 control knob’ belief simply is not correct. That belief vastly oversimplifies a complex problem.
It also means not only are most climate models observationally wrong, they cannot ever be right; and for more reasons than just unavoidable parameterization dragging in the attribution problem.
“That said, the lack of the ‘expected’ relationship between surface temp and radiative imbalance certainly shows that the ‘CO2 control knob’ belief simply is not correct. That belief vastly oversimplifies a complex problem.”
None of that is true. What the graphs above show are
1) Surface temperatures are increasing at a rate of 0.2 degrees per decade
2) The radiative imbalance at the top of the atmosphere is increasing
plus of course (although not shown)
3) CO2 levels are rising.
All three of which are consistent with the fact that increased CO2 levels drive increasing
surface temperatures. The issue is that surface temperatures respond a lot slower than CO2 levels due to the large heat capacity of the oceans.
Furthermore the CERES temperature data is giving a rate of temperature increase that is substantially larger than that predicted by most models. So if you want to say that the models are wrong using the data given here then you have to say that they are under-estimating global warming.
Then explain the GAST rise from roughly 1925 to 1950, which is visually and statistically indistinguishable from the rise from 1975-2000. IPCC AR4 SPM to WG1 said the former could not have been caused by CO2. So why do you assert the latter was mostly CO2? Natural variation did not magically stop in 1975.
Oh stop it Rud.
You know that CO2 is “The Precious” for climate alarmists.
https://www.meme-arsenal.com/en/create/template/386185
Precious
Good pic. of Izaak.
Izaak,
“increased CO2 levels drive increasing surface temperatures”
Well NO…additional photon energy from the additional CO2… increases evaporation from the ocean and increases convection with only a fraction going to actual temperature increase.
The convection heat and cloud reflection of sunlight and IR emission at cloud base temp back to ground is complex phenomena. It is not possible to measure accurately simultaneously worldwide within the 2.5 Watts/sq.M that would be needed to evaluate the imbalance within 1%. In fact the best we can do is 10 days for Jason-3 to scan the entire planet, which leaves a lot of time for the day- night change of 780 watts to 0 solar input to be distributed in diverse ways. Trenberth’s latest charts show 0.9 Watts imbalance. This number could only be back calculated from 0.14C per decade global warming, and nothing to do with radiation instrumentation readings which simply just aren’t that accurate and have 1 watt annual drift….
Izaak is merely trolling, or I hope so.
Hey Izaak for the period 2000 – 2014 the GAT trend was around zero, was there a sudden influx of CO2 into the atmosphere in 2015 or perhaps other factors were at work?
The CERES satellite data started ~2000, far too brief a period to infer anything about long-term trends.
Sorry Chris, that was me. I had a GIANT burrito at the end of 2014.
No. Izaak believes. In what, I don’t understand.
You left out one important fact.
“The declining TOA SW (out) is the major heating cause (+1.42 W/m2 from 2001 to 2020)” – Radiative Energy Flux Variation from 2001–2020, Hans-Rolf Dübal and Fritz Vahrenholt, October 2021, Atmosphere
This explains all the warming independent of CO2.
IW,
Can you please elucidate what you mean by “surface temperatures respond a lot slower than CO2 levels due to the large heat capacity of the oceans”?
By the mechanisms usually described, CO2 heat and cools on a time scale of under an hour as its radiative processes happen. What aspect of the energetics can be “preserved” if I can use that word, to be brought into play years later to heat the oceans?
Thanks, Rud, always glad to hear from you. Someone pointed out elsewhere in the thread a very good post by Dr. Roy, entitled “What Do 16 Years of CERES Data Tell Us About Global Climate Sensitivity?“. It discusses some of these issues.
Also, the precision is greater than the uncertainty, so (from my perspective) we can trust trends more than absolute values.
Best to you and that good lady who was so welcoming to us,
w.
This post would appear to be related to posts that Roy Spencer has done looking at CERES and surface temperature data — for example
https://www.drroyspencer.com/2016/10/what-do-16-years-of-ceres-data-tell-us-about-global-climate-sensitivity/
It is also the result of the energy of a bundle of light rays being spread out over a larger area as the angle of incidence of sunlight increases towards the poles.
(1) In the physical domain, energy is always conserved. Energy In > Energy Out, Energy is conserved. Energy Out > Energy In, energy is conserved, Energy In = Energy Out, Energy is conserved.
(2) As a heat engine the energy leaving Earth’s climate systems is determined solely by the physical phenomena and processes occurring within the system. The energy leaving the systems can never be specified.
(3) Any system open with respect to energy flows is not required by the Laws of Physics to attain any state.
(4) The assumption that Earth’s climate systems attain a state of radiative-energy transport balance is exactly that; an assumption that a theoretical state will obtain. The second part of that Bumper Sticker Climate Science, which is frequently omitted, states, “all other physical phenomena and processes remaining constant at their initial values.” A very strange requirement when the subject of interest includes the word “Change.”
(5) Further, while the IPCC insists that after the theoretical state is attained, and measuring over a 60 year time span, the GAST over the last 30 years will be equal to the GAST over the first 30 years, unfortunately the IPCC has yet to specify at what future time the assumed state will initially occur.
Does the CERES data contain measured incoming radiation or is that assumed to be some constant value?
Measured. The CERES system (on all satellites) has three TOA instruments:
1-2 gives net solar heating.
That minus 3 supposedly gives the net GHE forcing. Except as WE shows here, it really doesn’t.
Water vapour is the main radiative gas, the effects of which determine the rate of surface cooling by radiation.
“Clear night cooling occurs at about 1.9 0C per hour, and overcast night cooling about 0.3 0C per hour.”
https://asterism.org/wp-content/uploads/2019/03/tut37-Radiative-Cooling.pdf
During the daytime, convective surface cooling is faster than radiative surface cooling.
Right. Overcast skies reduces cooling rates by about 85%, as weather records show..
https://greenhousedefect.com/basic-greenhouse-defects/the-cloud-mess-part-3-data-data-data
Btw. that is cloud condition in “octas”. In the brackets is the numbers of samples, or nights respectively.
Thanks for introducing me to Constructal Law by Adrian Bejan. The two thermodynamics classes I took were way before 1996 when Adrian proposed this law. With a quick search, I found this interesting:
“Increasing flow is what sustains organisms and devices and stagnation kills them. Lastly, free yourself as much as you can. The freer you are, the more dynamic you’ll be. As Bejan told Business Insider, “Freedom is good for design.” It’s good for one’s psychological health, too.”
Could differences in “freedom” explain differences between forms of government – democracy, socialism, and communism? Does this imply that there is an underlying force driving towards freedom?
not really… implies the systems not based in freedom will find it more difficult to persist, as they are inherently less optimized for maximum flow of economic utility
however that in no way limits the ability of such systems to seize control of existing utility flows and fail to sustain them (e.g. Venezuela), nor does it suggest that such systems will necessarily be replaced by freer or more successful systems when they do fail
Since when did “Yikes” rhyme with WTF?
I guess it is noteworthy that even the IPCC has given up on “back radiation”.
Old GHE definition:
Much of this thermal radiation emitted by the land and ocean is absorbed by the atmosphere, including clouds, and reradiated back to Earth. This is called the greenhouse effect
https://archive.ipcc.ch/publications_and_data/ar4/wg1/en/faq-1-3.html
New GHE definition:
These substances emit infra-red radiation in all directions, but, everything else being equal, the net amount emitted to space is normally less than would have been emitted in the absence of these absorbers because of the decline of temperature with altitude in the troposphere and the consequent weakening of emission
https://www.ipcc.ch/site/assets/uploads/2018/02/WG1AR5_AnnexIII_FINAL.pdf
Isn’t the top of the troposphere at constant temperature for 5 km or so?
You mean the tropopause? Yes, though that differs with climate. It is very extensive in the arctics, and pretty small in the tropics.
Yes, and then we can see that the older more accurate NASA earth energy budget diagram without “back radiation” is the correct one.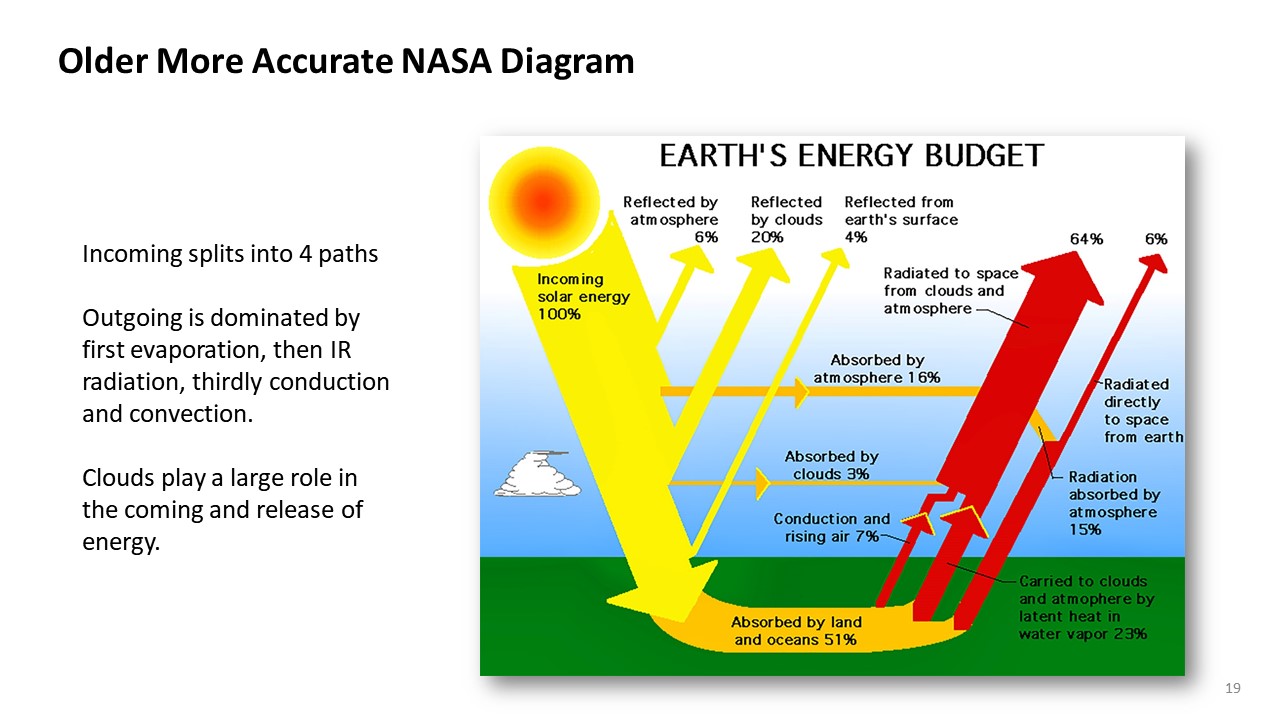
PP: That diagram simply shows net radiative flows, not countervailing gross flows. The concept of “radiative exchange” you don’t like is no more difficult that a cashier providing change for a purchase, as Willis has often pointed out.
Both warmists and lukewarmists believe in the GHE and only disagree on “How much?”.
If two groups disagreed on “How many fairies can dance on the head of a pin?”, the most notable observation would be that both groups actually believed in fairies.
Apart from the naming I do not object to the “GHE”. Again, the important question is on its magnitude and how it is composed. And I think the chart below is simple, accurate and very different from common beliefs..
Yep – So many ignorant soles have been sucked in by the GHE nonsense. In the present era, atmospheric water is a net cooling agent in the atmosphere. Reduction in surface insolation from clouds trumps the reduction in OLR from atmospheric water for nine months of the year. There are three months when the atmospheric water acts as a warming agent.
Yes, this is the emission height fallacy. It is a better description of greenhouse warming and works very well for water vapor. However, since almost all of the CO2 emissions to space occur in the stratosphere, raising the emission height actually leads to strengthening of emissions.
I do not have my own opinion on this, cause I simply do not know. The spectral analysis and the according products (hitran, modtran) suggest something different.
But I can see there is something wrong with this graph. To the sides, where the optical thickness of CO2 declines, the emission altitude will necessarily drop, falling down to levels where the atmosphere is thicker. The graph contradicts this logic.
E. Schaffer, the chart posted by Richard M 4:50pm has been altered from the original paper. For instance, the blue “400” square top of the right-hand column also makes no sense – and in checking the original paper I found it is not there. There could be other less obvious alterations. That forged copy should not be relied upon.
It comes from here.
https://hockeyschtick.blogspot.com/2014/09/oh-irony-cutting-co2-emissions-is.html
Since Paul is one of the moderators here maybe he can clarify.
It actually comes from here.
https://www.atmosp.physics.utoronto.ca/SPARC/News17/ReportTropopWorkshopApril2001/17Haynes_Shepherd.html
Actually, not exactly, because there are no horizontal dotted lines.
Though that’s an interesting find, bdgwx, thx. As I recall, that particular chart of spectral cooling rates midlatitude summer at 667 wavenumber which per the workshop authors “exhibits strong stratospheric cooling (explaining why a CO2 increase leads to stratospheric cooling) but a local warming at the tropopause”, and reduced cooling rates below, was discussed around here many years ago.
The puzzling “400” redundant blue square led me to go pull the original paper at the time to find out its meaning from the original authors.
The original paper didn’t show that blue “400” square so it was a dead end. Your link does source the chart to “courtesy of M. Iacono, AER” one of the original authors used at a workshop some 6 years after the original was published.
Thanks. I tried to pull up the original publication but I never could find a copy that was not paywalled. Here is a really good lecture by Sokolik which explains the concept of radiative heating/cooling as used by Clough and Iacono. I found the diagram on pg. 5 to be particularly useful in my understanding of how the calculations are performed.
I went to the local college library & told them I was a taxpayer not a student & they said well ok, printed off a copy for me. Still have it but under piles of other stuff, can’t quickly find it. Definitely a colorful paper – that one is only one of many similar charts.
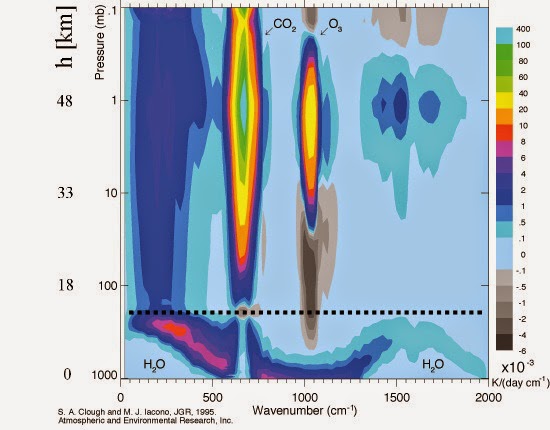
Someone posted that graph in WUWT a few months ago and I explained how to interpret it. I can’t find that post so I’ll try to explain again.
This is showing the radiative cooling rate with wavenumber on the bottom axis and pressure level on left axis with the color representing the cooling rate in K/day.cm. For the purposes of the explanation we can examine CO2’s effect over the entire spectrum and think of everything in units of K/day.
The radiative cooling/heating rate is defined as:
dT/dt = 1/cp * dFnet/dz
where T is temperature, t is time, c is the specific heat capacity, p is density, F is the net flux, and z is height.
The net flux is defined as
F(z) = Fup(z) – Fdown(z)
Fnet = F(z+Δz) – F(z)
What this is saying is:
Fnet < 0 is radiative energy gain (heating)
Fnet > 0 is radiative energy loss (cooling)
So what the graphic is showing is that for most bands and pressure levels there is radiative cooling. That’s expected because more radiative energy is exiting the layers as it makes its way to space. You can see what CO2 is doing by visualizing the graph with and without CO2. Without CO2 the troposphere would have a radiative cooling rate of 1-6 K/day peaking close to the surface and in the stratosphere of 0.0 to 0.5 K/day peaking around 1 mb. With CO2, however, the radiative cooling rate decreases in the troposphere to only 0.0 to 0.1 K/day and increases in the stratosphere to 1 to 400 K/day. What this means is that the presence of CO2 creates a barrier to the outward energy flow around the tropopause. Less energy is making it to the stratosphere which means ΔE < 0 above the tropopause and ΔE > 0 below it. Or said another way the climate system warms below the tropopause and cools above it.
In summary this graph is showing that CO2 is a very significant impediment to the flow of energy away from the surface and toward space. If you are arguing for the contrarian side you don’t want to be showing this graph.
“Or said another way the climate system warms below the tropopause and cools above it.” ..yes, due to added ppm CO2 causing same amount of added deltaE in the lower regions of higher pressure (more IR opacity) as removed deltaE in the higher regions of lower pressure (less IR opacity) as added well-mixed ppm CO2 can’t alone raise the total atm. thermodynamic internal energy E.
“In summary this graph is showing that CO2 is a very significant impediment to the flow of energy away from the surface and toward space. If you are arguing for the contrarian side you don’t want to be showing this graph.”
Why isn’t CO2 a very significant impediment to the flow of energy from the atmosphere to the surface?
It would seem that if CO2 blocks energy flow in one direction then it must also block energy flow in the other direction.
TG said: “Why isn’t CO2 a very significant impediment to the flow of energy from the atmosphere to the surface?”
There is not usually a net flow of energy at wavenumber 667 down toward the surface. The only place that happens is Antarctica in the winter when the surface is sometimes colder than the upper atmosphere.
TG said: “It would seem that if CO2 blocks energy flow in one direction then it must also block energy flow in the other direction.”
Yeah, that’s correct. It impedes the transmission in both directions. The difference is that there is more upward directed energy than downward directed energy at wavenumber 667.
If there is more upward directed wn667 energy than downward wn667 energy then how can the net flow at wave number 667 be zero?
It’s not zero.
“There is not usually a net flow of energy at wavenumber 667 down toward the surface.”
You said it,. not me.
Toward the surface means downward. If there is no net flow of wn667 energy toward the surface then something must be offsetting the wn667 energy flow toward the surface. Otherwise there *would* be a net energy flow of wn667 toward the surface.
It’s that net flow of wn667 energy toward the surface (i.e. back radiation) that is supposedly warming the surface of the earth. If the net flow is zero then how can the surface be warming?
As I was reading through the recent comments I was thinking exactly the same thing. Bdgwx is trying to manufacture a warming effect that doesn’t exist.
I believe the situation is thus, an energy transfer of a CO2 molecule (emission to reabsorption) has a shorter path length downward because the air is denser. Hence, the average energy flow is upward. When a photon finally reaches the stratosphere it has an opportunity to exit the atmosphere due to the lower density. That is what the graph is showing.
Since we now have more CO2 there may be a couple more microsecond level stops along the way and when it reaches the stratosphere the final stop averages out at a higher elevation.
This kind of averages out the energy emission to space. The stratosphere is now cooler which would lower emissions, but the higher elevation in the stratosphere of the average emission is warmer. Probably balances out. CO2 neither warms nor cools.
It is the total energy radiated to space that determines whether CO2 has a warming or cooling effect. How could it be any different?
I assume bdgwx and some others will claim the delayed route through the lower atmosphere will cause warming. I think there are more than enough energy flow mechanisms so the overall flow of energy is still sufficient to feed the current energy transmission to space. If CO2 radiation slows down slightly, then convection, conduction, other radiation and latent heat flows increase. Basic thermodynamics of heat flow.
Richard M, you haven’t read the paper or you would have known the chart you posted has been altered from the original. Obtain a copy and learn from the discussion how to physically interpret the chart along with various other charts the authors discuss & properly comment accordingly rather than using your imagination to do so.
The chart shows warming rate from added ppm CO2 @ 667 wn grey area near dotted line pressure level and reduced cooling rate relative to other adjacent wavenumbers in the higher pressure atm. below. The authors will explain to you why that physically happens.
The chart is just fine for what people need to know about CO2 emissions to space. They occur in the stratosphere. Or are you claiming that part of the chart is also wrong?
Now, since you seem to understand what deep dark secrets the authors really meant to tell us, why don’t you explain it? I explained what’s happening above from basic thermodynamic principles. Please explain what magic the authors are invoking that suspends the basic laws of thermodynamics.
“CO2 emissions to space. They occur in the stratosphere”
The original paper’s chart also shows they occur from the surface Richard, and for a substantial amount of pressure altitude below the dotted line – see the cooling rate in K/day at each wavenumber. Richard should obtain and read the paper to understand the authors suspend no laws of thermodynamics.
In other words, Trick cannot produce anything to support their assertions. Very typical troll behavior.
Your library will produce the paper for you probably for free, Richard, so you can read all of it & understand it in context.
E. Schaffer:
The “new” definition states that “these substances emit infra-red radiation in all directions”. That includes BACK to the surface.
Right, it includes back to the surface. Just like the surface radiates into these GHGs. And it does not end there. Unterneath the surface the earth emits radiation into neighboring earth, water molecules radiate into each other, GHGs within the atmosphere do it, and even in your body every molecule emits radiation into neighboring molecules. It happens everywhere!
But this trivial exchange of “back and forth” radiation does not heat anything, nor is it a flow of energy. Rather it is only a function of temperature, as the SB law tells us…
And neither it is any longer part of the definition of the GHE by the IPCC.
So what happens to the energy in the downwelling infrared radiation — reliably measured at over 300 W/m2 in most locations? Please provide an answer that is consistent with the 1st Law of Thermodynamics.
I just did. This is entropy, not “energy”
Watts are units of power — energy per unit time. That is not entropy! You have no understanding of the most basic concepts of thermodynamics. You would wash out of an introductory class in the first few weeks.
Incompetent and insulting – great combination 😉
But I see how the latter is a coping strategy to the first.
Anyone who thinks that watts are units of entropy has no business judging someone else’s competence in thermodynamics.
Re New GHE definition…that’s WORSE than the old one….definitions are for people who don’t know what the word means..so unlikely they have a degree in atmospheric physics to interpret the explanation contained in the definition.
“Much of this thermal radiation emitted by the land and ocean is absorbed by the atmosphere“ (bolding mine, tpg)
Why isn’t the “back radiation” also absorbed by the atmosphere before reaching the earth? A CO2 molecule doesn’t discriminate doesn’t discriminate between up and down does it?
Of course it is. In fact there is plenty of “back radiation” re-absorbed within the atmosphere, likely well > 10.000W/m2. But again, this is just ubiquitous back and forth radiation, not doing anything.
“More than 90 percent of the warming that has happened on Earth over the past 50 years has occurred in the ocean. “
Climate Change: Ocean Heat Content | NOAA Climate.gov
Or I would also say more than 90 percent of global warming is caused by a warmer ocean and it’s closer to 100%.
What is happening in the atmosphere doesn’t matter unless it warming or cooling the ocean.
A significant factor which cools the ocean is cold water falling in the polar regions.
If you have a larger amount of cold water falling, it’s immediate effect or what doing is warming the air, but the long-term effect is a colder world
It takes a long time to warm or cool the ocean.
Our ocean average temperature is about 3.5 C.
Whenever an interglacial period has ocean as warm as 4 C {or more} one is in the warmest time period of the interglacial period.
Or an interglacial period is not warm when the ocean is 3.5 C [or colder].
The air won’t change ocean temps…unless I’ve misunderstood your statement
“What is happening in the atmosphere doesn’t matter unless it warming or cooling the ocean.”
–The air won’t change ocean temps…unless I’ve misunderstood your statement
“What is happening in the atmosphere doesn’t matter unless it warming or cooling the ocean.”–
Well, “air won’t change ocean temps” is pretty broad statement.
I would say it can’t within a century time.
I think higher CO2 levels could result in a warmer ocean. But more obvious is warmer ocean will result in more CO2.
I would say the ocean average temperature 3.5 C is the global climate- and is called an icehouse global climate.
If ocean was 10 C, it would not be an icehouse global climate.
And an ocean which is 4 C, is a much warmer world.
And 3 C ocean make the world a lot colder.
One could say it’s good thing that takes a long time to change the ocean’s temperature
Our recent Little Ice Age which most agree ended in 1850 AD, had an ocean which about .1 to .2 C cooler than present ocean.
The warmest period of all past interglacial period had ocean which was warm as 4 C. And during such warm periods most of the Sahara Desert was grassland and forests.
An ocean which 4 C or warmer has a lot more global water vapor- or less deserts.
Or having 1/3 of global land area being desert, is what you get with an ocean of 3.5 [or colder] temperature.
We been cooling for over 5000 years, and Sahara Desert was green during the Holocene climatic optimum –
Holocene climatic optimum – Wikipedia
We are past our Holocene Peak global temperature
and within thousand years it could get as cold as it was during Little Ice Age.
But we could hope it gets warmer.
Or we actually cause our world to get warmer- but it’s unlikely that weak
effect of higher CO2 levels will do anything to stop the coming glaciation
period.
The is poorly stated and misrepresents what is actually happening.
A more accurate description is that the oceans are retaining more heat as the water cycle, ocean to land, is slowing down.
This is due to oceans receiving less sunlight since 1585 and the land more. That means the advection of moist air from oceans to land is gradually reducing, leaving more heat in the oceans. Net upwelling in the tropics has been slowing down for 400 years.
The Earth is cooler with the albedo/atmosphere not warmer because at this distance from the Sun space is 394 K, 121 C, 250 F and NOT 5 K. Remove the atmos/GHGs and the Earth becomes much like the Moon. That’s NOT what the GreenHouseEffect theory says. See UCLA Diviner mission’s site, Nikolov “Airless celestial bodies,” Kramm (U of AK) “Moon as analog for Earth,” the Int’l Space Station HVAC refrigerant design criteria and the AC and chilled underwear of an astronaut’s space suit.
The K-T atmospheric energy balance diagram (TFK_bams09.pdf (ucar.edu)) and all of its clones contain a couple of egregious arithmetic and thermodynamic errors. The term 63 W/m^2 appears twice and the upwelling Black Body calculation does not exist.
1,368 W/m^2 arrives at the Earth. This discular value is divided by 4 to spread/average 342 over the entire spherical ToA 24/7. Dumb, btw. About 100 are reflected back into space by the 30% albedo and 80 are absorbed by the atmosphere leaving 160 net/net making it to the surface.
According to the LoT 1 160 is ALL!!! that can leave. 160 in = 70 + 80 + 63 out. The incoming solar energy is balanced with and allocated to these three outputs. The balance is complete, there is no more!!!
Where does the 396 upwelling come from? It’s 54 more than the original from the Sun, 156 more than the net albedo and 236 more than the net 160 to the surface and 396 = 333 + includes a whole ‘nother second 63! The 333 is 100% efficient perpetual loop from cold to hot without adding work all of which violates LoT 2.
This entire 396/333/63 GHG loop can be removed the graphic and the balance is unaffected!!
NO GHE, no GHG warming, no man/CO2 driven climate change or global warming.
.
Talking about the afternoon t-storms in the tropics… I just watched an oral history video from a P-38 pilot based in the south Pacific theater during the war. He mentioned they would generally leave early in the morning and return during the heat of the day.
He mentioned every day they would encounter huge thunder storms going up to 60,000 feet or higher and their only way of getting through would be for them to drop down to 50′ above the ocean surface, pick what they thought was the least amount of rain and just punch through it. They learned that if they went in too high and got caught in an updraft, they might be carried to the top of the storm and it was pretty much over. They lost a lot of pilots to the tropics shedding heat to the stratosphere.
That is the nature of convective instability. It is the ocean temperature regulating process.
Nullschool interactive weather map now provides CAPE (convective Available Potential energy:
https://earth.nullschool.net/#current/wind/surface/level/overlay=cape/orthographic=-226.63,4.54,947/loc=140.910,6.134
The updraft velocity when instability is triggered, is the SQRT(2x CAPE). So the 2466J/kg in the circled zone will produce an updraft of 70m/s if triggered now. However the Cape is feeding the cyclone as it spins up. Cyclones require CAPE to spin up but once spinning they make their own weather.
yes, a recently published CERES analysis found the same thing
from a radiative balance perspective, warming over the last 20 years seems to be dominated not by (CO2-mediated) increasing downwelling LWR, but by shifts in the (cloud-mediated) shorter-wave radiation budget
“The dominating influence of a declining TOA outgoing SW is not in line with the assumption that the global warming in the last 20 years is primarily caused by holding back the LW due to the greenhouse effect. As discussed below, the greenhouse effect plays a role, however, for the period 20012020 at TOA it was certainly not dominating.”
https://www.mdpi.com/2073-4433/12/10/1297
also explains why none of the CO2-dominated models match UAH tropospheric trend since 1979… lol trendlines wildly divergent from reality by 2013, today they’re a punch line
Apologies if this is slightly off topic, but the whole global warming thing is predicated on the theory that infra red radiation is absorbed and re-radiated by CO2 in the atmosphere. If this were the case, one would expect satellite photos of the planet in the IR spectrum to be indistinct and blurry, to say the least, as the IR wavelengths would be randomly scattered in all directions. A couple of days ago I watched a re-run of a TV program, “Egypt’s Lost Cities” which documents the work of Dr Sarah Parcak, an archaeologist that has discovered a myriad of buried structures by combining visible light and infra red satellite images, which has revealed entire cities that have been buried for centuries, where nothing can be seen on the ground. Looks to me like IR from the surface makes it into space pretty much unhindered.
https://www.age-of-the-sage.org/space_archaeology/satellite_street_plan_tanis.html
Shark says:
Ummm … light rays are randomly scattered in all directions when reflected from any object, but that doesn’t make photographs blurry.
???
w.
A fair point, but visible light would be scattered by mist resulting in a blurred image. Is it not the case that CO2 is supposed to behave like mist to IR wavelengths?
IR is not visible, satellites that can record IR separate the IR into bands that are different from the visible bands.
Rayleigh and Mie scattering are wavelength dependent, with blue light being scattered (x^4) much more than IR, which is why the sky looks blue.
“light rays are randomly scattered in all directions when reflected from any object, but that doesn’t make photographs blurry.”
What do you think the effects on visible light photographs would be if the light was repeatedly reflected in all directions between the object and the camera?
A reduction in brightness from rays scattered outside the lens, and a reduction in contrast from those rays randomly scattered into the lens. Wherever the lens is focused, it should be sharp.
RHS: CO2 only absorbs significantly in the 14-16 micron band. The 8-14 micron band is commonly called the “infrared window” or “atmospheric window” because there is no significant (clear sky) atmospheric absorption in this band. In the 8-10 micron band, over 80% of surface radiation makes it directly to space under clear sky conditions.
Satellite measurements of the type you cite focus on the atmospheric window.
The US has spent billions of dollars on the James Webb Space Telescope, which is finally due to launch next week. The main point of launching this infrared telescope into space is to get it above the IR absorption of the atmosphere.
Also, IR penetrates interstellar dust better than visible light because it is not scattered as strongly.
Yes this is becoming more and more apparent. I suspect that Happer et al. will soon confirm the so-called all-sky infrared optical thickness (greenhouse effect) is rather fixed. He seems to call it ‘saturated’. Or is this ‘effect’ simply a consequence of large scale thermodynamic constraints under the mass of the atmosphere? Time will tell.
Once we can all agree the ‘greenhouse effect’ is practically stationary on human timescale we will then know that the radiative physicists don’t have much else to offer to the climate change discussions – it is then we can finally stop spinning our wheels and get on with the ever more fascinating factors of the Earth system. We thank them for their valuable contributions.
Fifty odd years in the grand scheme of things isn’t so much wasted time as long as we learned something along the way.
So many of them don’t seem to be interested in learning anything but doctrine, much like a holy-roller church or a Jihadist training camp.
I seem to recall reading that the added CO2 from emissions increases the escape height of long wave radiation by about 100 meters.
The radiant temperature of Earth remains constant at 255 K or so. The average lapse rate of 6 K/km is also retained.
The extra 100 m of height where radiation escapes into space means the surface must be about 0.6 K warmer in order that the lapse rate produce the constant 255 K at the TOA.
This is supposedly from where comes the increase in surface temperature from CO2 emissions.
I don’t believe that story either, for all the reasons you so aptly listt, Willis.
Fritz Möller pointed out in 1963 that a small change in cloud cover could easily erase any warming effect from CO2 emissions, and the climate nutcases have been studiously ignoring him ever since.
So right.
The GHE is far more complex than its acolytes make out. The GHE means a change in the relative effective emmision height. That’s way more scientific than CACA advocates are prepared to argue.
Ned Nikolov discusses this conjecture here in The Greenhouse Deffect (Karl Zeller and Ned Nikolov) and shows that it is contrary to basic physics.
Its origins go back to this paper:
Ekholm, N. 1901. On the Variations of the Climate of the Geological and Historical Past and Their Causes. Quarterly Journal of the Royal Meteorological Society, Vol. 27, No. 117, 1-61.
“Ned Nikolov discusses this conjecture here in The Greenhouse Deffect (Karl Zeller and Ned Nikolov) and shows that it is contrary to basic physics.”
https://wattsupwiththat.com/2018/12/31/giving-credit-to-willis-eschenbach-for-setting-the-nikolov-zeller-silliness-straight/
A simple explanation would be that surface temperate estimates are in error. If they are in fact going down, would it not explain rising TOA temperatures which are less likely to be in error with many less variables.
Lots of the noise in figures 2 and 3 is changing inversely, but the trends are fairly coincident. You could check that by de-trending both and inverting one of them.
From the article: “This is in good agreement with other global surface temperature reconstructions, such as Berkeley Earth and HadCRUT, although each of these global temperature datasets differs slightly from the others.”
The Berkeley Earth and HadCRUT global temperature datasets and the rest of the data sets, including the UAH satellite data, are in good agreement, with small differnces, for the period from 1979 to the present, but they are science fiction *before* 1979.
I just wanted to make that distinction. It doesn’t negate your findings with the CERES data since the temperature data sets you use for comparison can be considered legitimate. For these purposes anyway.
The atmosphere holds an average around 11Tt of water. It varies on an annual cycle and there are longer term trends. Annually the atmospheric water turnover is estimated to be 522Tt. That means the average residence time for water is about a week. In the month of December, all the water in the atmosphere will be deposited on land and replaced with a little bit more as December is when atmospheric water is at its lowest. Over a year, the water evaporated from oceans and deposited over land is estimated to be around 43Tt (I expect a low side estimate). So the atmospheric water turnover from oceans to land is 4 times each year.
In the current precession cycle, the insolation over water peaked in 1585. Since then the oceans have been getting less insolation and the land a bit more. That is slowing down the water cycle between ocean and land and causing the oceans to warm as well as the land. It is readily observed that ice-free ocean surface is at its coolest in December/January when the ocean insolation peaks and the water transfer to land is at its maximum.
No climate model has predicted the observed decline in the global freshwater runoff from land:
https://www.bafg.de/GRDC/EN/03_dtprdcts/31_FWFLX/freshflux_node.html
This is the consequence of perihelion making a gradual transition from the austral summer solstice in 1585 to the boreal summer solstice in about 10,000 years when the water cycle, ocean to land, will be at its lowest. Slowing the water cycle means the oceans are retaining more heat.
The energy balance on earth is the result of powerful temperature regulating processes that cycle massive amounts of water through the atmosphere on a daily basis at the top end and forms low thermal conducting ice layer on oceans to restrict loss of heat at the low temperature end. It is not some delicate balance upset by a trace gas.
Thanks, Rick, interesting thoughts. Unfortunately, the data source is currently down.
Rats.
w.
Willis
 ;jsessionid=38ABC1BF1E82A41A2690E5D0E1DA6122.live11314?__blob=poster
I just loaded it from there and checked since you posted this from that link.
This is just the chart:
This is another paper that gives much more detail on the overall water cycle. It is the source for the 522Tt.
https://hess.copernicus.org/articles/24/3899/2020/
It provides a lot more detail on the water cycle including estimates of land water storage.
Rick, there’s lots of stuff available … just not the data. See here for the problem. Thanks for the Koutsoyiannis paper, he’s one of my scientific heroes.
w.
OLR is increasing in any event:
Outgoing Longwave Radiation (OLR) | El Niño/Southern Oscillation (ENSO) | National Centers for Environmental Information (NCEI) (noaa.gov)
Perhaps The Greenhouse Effect and Global Warming will be more robust and durable if we emit less carbon dioxide.
Thanks, Cohenite. Unfortunately, that’s for only a small area of the planet. From your link:
From 160E to 160W is only 40° of longitude, and it’s not clear what “centered on equatorial areas” means.
Regards,
w.
Long time readers will recall I have been punting my favourite engineering prof for years. I think a search of WUWT will even find a mention of the Constructal law.
The guy is a genius and I don’t understand how anyone can write so many text books. My main go-to book is “Convection Heat Transfer”.
Willis, in that book there are several sections on how a fluid like air or water between a lower hot plate and an upper cool plate, near but above, breaks into cells in order to convect the maximum amount of heat. Nature hates imbalance.
Not only do “cells” form in a repeating pattern across the plates, they form as square cells, or hexagon (etc) according to conditions that are well understood (by Bejan).
The Earth’s atmosphere is like a warm spherical plate with a thin fluid above it (air is a fluid , not a liquid) and space represents the cold plate. Thunderstorms should therefore appear in a square pattern or hex, depending on conditions. That might be something worth cloud-searching.
These square and hex patterns are emergent phenomena. We might explain the presence of large hexagonal clouds at the north and south poles of gas giant planets in our solar system.
We can see that every day phenomen when boiling water or while cooking.
Thanks, Crispin. I discuss the Constructal Law in over a half-dozen posts here on WUWT. See here.
w.
A serious new law of physics, the “Constructal Law”? I myself happen to be new to the concept, but I’ll take a really quick ‘go’ at it!
Looking back a few years now, in a previous article (as you generally refer to above), say,
https://wattsupwiththat.com/2010/11/15/the-constructal-law-of-flow-systems/ , you wrote (about the earth’s climate flow system):
“It maximizes the sum of the work done driving the planetary circulation, and the heat rejected back to space at the cold end of the heat engine.”
So to paraphrase just a bit, the earth’s heat engine is considered as maximizing both some measure of work done, plus maximizing the heat that that this ‘Earth engine’ is able to radiate into space at any given time?
Does this imply that the kind of math solution that would be suggested by this sort of model is then a nonlinear maximization problem, one with dynamic fluctuations (as one might well expect)?
If so, and given that this is a basically *nonlinear* system (with no assurance of nice, reasonable, linear-type behavior), who is to say that such a system might not meander far from life sustaining conditions at any time?
Or, say, the system might throw itself into some sort of furiously fluctuating global weather oscillations at any time?
I’m just not quite seeing how the ‘constructal’ concept of evolving to different configurations helps with the overall stability of certain important things, like the fluctuating — but predictably or within reason — temperatures on the earth’s surface.
Maybe what we’re saying here is that ‘configuration change helping with stability’ is just one more big Guess, Hypothesis or Assumption,
i.e., the kind of Law that you just have to make when you recognize it in enough situations?
But if we look at the last 200Ma Earth’s temperature only went down and brought us the recent ongoing Ice Age (last 3.2Ma).
And don’t greenhouse gases emit in all directions? So more ‘greenhouse’ gases = more long wave radiation out to space cooling the place.
It is hard to think the “broken lines” would be stable in position. More likely to move North and South influenced by the ITCZ.
Thanks to your concise summary of Bejan’s Constructal law:
According to the Constructal Law, flow systems far from equilibrium must constantly change and evolve in order to persist
I think I get what it’s about finally.
Thanks for that! Constant change mandated by the nature of the system – that sounds compelling.
Is there any link between Bejan’s law and “Constructor theory” as proposed by David Deutch and Chiara Maletto from Oxford, as described here on PBS SpaceTime?
https://youtu.be/hYc97J2MZIo
This is a “recipe” for building theory from binary facts (constrained by conservation laws). This originated from John von Neumann’s “universal constructor”. I wont pretend I’m an expert on it, it’s explained in Maletto’s book “The science of can and can’t”.
Does it share anything with Constructal law other than having a similar name?
No clue, Phil. I’ve tried to wrap my head around Constructor Theory without success.
My description of the Constructal Law above is only partial. The Law also describes the direction of the change/evolution. Here’s Bejan:
It doesn’t evolve willy-nilly. It evolves in such a way as to increase the interactions of the currents. Take as an example a river in flat marshy country. It has two flows—the flow of water down the river, and the flow of water all along the river edges from the marshland into the river.
To increase the interaction between these two flows, according to the Constructal Law, the river perforce must lengthen endlessly, growing longer, cutting off oxbow loops, lengthening again, forever.
The ramifications are endless …
w.
Thanks – on reflection I think the two are quite far apart. Constructor theory is about physics and attempts to unify quantum with gravitation, etc. Bejan’s constructal law on the other hand is – IIUC – connected with chaotic nonlinear systems and emergent behaviour. It would be a long stretch from one to the other although maybe not impossible.
I also suspect that Constructal law and emergent climate homeostasis are underpinned by the powerful least action principles (Fermat, Lagrange, Noether). Complex systems such as climate with dissipative heat flow will adapt to changes while minimising “action” such as heating. CO2 warming theory is the opposite of this, something like “most action”.
Can you have a river or current of heat? In the Constructal law sense?
Fascinating to observe the areas of anomalous significant negative radiation imbalance in the NH – anomalous for the latitudes involved. In particular, the desert regions of the Sahara and Arabia, but also Central China. There are hints of similar anomalies in the SH, such as parts of Australia and the area of the Humboldt current off western South America, but nothing as major as in the NH.
The Sahara and Arabia are major desert regions, which may be the cause of the anomaly there, but the area of Central China is by no means a desert region – so what is happening there? Very curious.
Great article with real data!
As I understand it, the TOA imbalance reflects energy-in minus energy-out. If the planet was in a stable situation, the TOA would be zero. If more energy comes in than goes out, the TOA imbalance will be positive. Since the CERES data shows a positive and increasing TOA imbalance over the last 20 years, this means the planet is receiving more energy-in than energy out. Could this be due to melting ice? Has the effect of melting ice been considered? If so, is it ignored because it is too small an effect, or is it significant?
Don, total system ice melt is not really very significant. The uptake of solar energy by Earth system has been reported with 95% confidence nature’s true value lies in the range at 0.03 +/- 0.01 W/m^2 from ice warming and melt and atmospheric and lithospheric warming out of a total “unbalance at the top” 0.71 +/- 0.10 W/m^2 in the period July 2005-June 2015.