INSTITUTE OF ATMOSPHERIC PHYSICS, CHINESE ACADEMY OF SCIENCES

CREDIT: MINGNA WU
A new study demonstrates that the naturally occurring warm-to-cold change in the tropical Pacific Ocean is the major cause for the recent intensification in Pacific Walker circulation, the most prominent feature of the tropical Pacific.
The study was published in Nature Communications on Nov. 11. It was conducted by researchers from the Institute of Atmospheric Physics (IAP) of the Chinese Academy of Sciences and the Max Planck Institute for Meteorology.
The Pacific Walker circulation, a large east-west atmospheric circulation along the equatorial Pacific, is observed strengthening during recent decades (1980-2015). The strength of Walker circulation can regulate the heat budget of the global climate system via air-sea interactions and has extensive impacts on water cycle over regions like the South Asia, the Maritime Continent and the Amazon basin.
However, the physical driving mechanisms of the observed strengthening trend of the Walker circulation remain unclear. A range of factors may have contributed to the observed changes of the Walker circulation, including external forcing and natural variability.
The study showed evidence that natural decadal variability related to the Pacific Ocean played a more significant role in modulating the Pacific Walker circulation change and the Walker circulation was projected to weaken in the coming decades.
The phase transition from positive-to-negative of the ENSO-like fluctuations, known as the Interdecadal Pacific Oscillation (IPO), could explain 63% (~51-72%) of the observed Pacific Walker circulation strengthening over the period of 1980-2015, according to Tianjun Zhou, a senior scientist at IAP, the corresponding author of the study. Zhou is also a professor at the University of Chinese Academy of Sciences (UCAS).
“Based on the large ensemble simulations from six climate models, we quantified the contributions of external forcing and natural variability to the long-term change of the Pacific Walker circulation for the first time. We have identified the leading role of the Pacific Ocean in driving the decadal change of the Walker circulation and provided a constrained projection of its near-future change,” said Mingna Wu, the first author of the study, who is a Ph. D student from the UCAS.
“Looking into the future, the phase of Interdecadal Pacific Oscillation in the Pacific Ocean could last into the coming decades and the Walker circulation is likely to weaken if we use the IPO phase predicted by the most skillful ensemble members to constrain the PWC projection,” said Chao Li, a climate modeler at the Max Planck Institute for Meteorology, co-author of the study. “Consequently, the South Asia summer monsoon rainfall might be reduced, the northern part of the western Amazon is likely to experience a drier climate, and less rainfall is expected over large areas of the Maritime Continents.”
These findings highlight an urgent need to improve the prediction of IPO and other decadal internal modes of climate variability.
JOURNAL
Nature Communications
DOI
ARTICLE TITLE
A very likely weakening of Pacific Walker Circulation in constrained near-future projections
ARTICLE PUBLICATION DATE
11-Nov-2021
Cooler = natural variability.
Warmer = Global Warming ™.
Got it.
The most significant natural effects are from solar variability.
As with ENSO, UV flux is important, due to its effect on air pressure (the Southern Oscillation), hence the trade winds.
Solar magnetic field strength also matters, thanks to its impact on cloudiness, hence SST.
East Asian monsoon and solar cycle strength:
https://journals.ametsoc.org/view/journals/clim/32/10/jcli-d-18-0288.1.xml
A recent one of numerous such papers. Also for the Indian monsoon, affected by ENSO. Indeed its fluctuations led Walker to discover the SO, ie the differences in air pressure between Darwin, NT and Tahiti.
“Solar magnetic field strength also matters, thanks to its impact on cloudiness, hence SST.”
Yes, and the Sun’s magnetic strength is lower, and the Walker circulation is projected to get weaker. And the global temperatues are cooling.
Coincidence?
I think not!
One reason “climate science” GIGO computer gaming (which differs from climatology) is so unsettled is that the natural variability component of observed climatic changes is poorly constrained.
Because this research is “based on models”, does this mean that we can safely ignore it…?
Maybe, because we know climate models run hot …
& those made from Plasticine go all squidgy;
The Lego ones are far more stable.
It depends how hot they get…
Any model i ever built out of LEGOs was pretty stable.
As opposed to those built out of GIGO.
Plasticine was an earlier geological epoch.
Sounds like the research is based on actual data, and then using ‘models’ to automate the calculations.
If they publish their raw data, methodology for massaging the data, massaged data, methodology of the models used and their computer codes – then it should be given proper consideration.
As well as continuing observation and real world data.
Data? We doan need no steenking data!
We need data, but just make them up.
This “quantifies” nothing but the assumptions which were built into the climate models: Von Neuman’s elephant on steroids.
Until models are demonstrated to have to have predictive ability and provide not just climate wiggles but wiggles which match real climate behaviour, it is a study of science fiction to analyse what happens inside climate models at any level.
It is well known that climate models make a very poor job of reproducing these various “internal oscillations” in either time or magnitude. So we do know that whatever they do, does NOT inform us about the real world climate.
This is orthodoxy , not science.
The Boy Scouts had it right. Be prepared.
“This “quantifies” nothing but the assumptions which were built into the climate models”
That’s what I was thinking, too, when I read it.
You can bet these models are putting too much emphasis on CO2.
At least they seem to be on the right general track in that they acknowledge an internal oceanic influence on the general atmospheric overturning circulation.
That is something I was writing about more than ten years ago and which would explain changes in climate zones that would account for all the past warming and cooling spells without involving radiative gases.
The next step is to ascertain the main cause of internal oceanic variability and the most obvious is variations in the proportion of solar radiation that are absorbed by the oceans.
Which brings us back to cloudiness changes caused by solar effects in the upper atmosphere changing jet stream meridionality/zonality.
My contention is that solar changes alter the gradient of tropopause height between equator and poles so as to allow polar air either to be constrained more tightly around the poles for general warming elsewhere or to be allowed to surge out into lower latitudes more often for general cooling.
When polar air is allowed to surge outwards more often we see wavier jets,longer lines of air mass mixing with more clouds, less solar energy into the oceans and a shift in favour of cooling La Ninas rather than warm El Ninos.
Stephen, this latitude wind effect blocking or allowing polar air excursions into low latitude areas is something I have mentioned before here on WATTS. Without knowing anything other that ENSO status and trend the growing season here (Mendoza, Argentina) is known with reasonable certainty. As I sit here writing this, December 10, at just before 7 AM, the temperature is 58 deg F (normal around 70 deg F), there are low scud/light rain clouds everywhere, we are in the middle of a two week colder weather with cool rain (and snow at higher elevations), and yes, according to NOAA, we are in a La Niña phase. No doubt about it, El Niño is a good boy, and La Niña is a bad girl.
Cloudy here in Valparaiso region.
La Niña however is good for Peruvian fishing. She has dumped too much rain on our native region in the north temperate zone.
If I have chose between fish or wine I don’t know which.
Happily, wine keeps.
‘The next step is to ascertain the main cause of internal oceanic variability and the most obvious is variations in the proportion of solar radiation that are absorbed by the oceans.
Which brings us back to cloudiness changes caused by solar effects in the upper atmosphere changing jet stream meridionality/zonality.’
One must first remember that all of the oceans major cycles, such as the AMO, PDO, ENSO are correlated. Willis Eschenbach, in his post ‘Adding it Up’, 2021-04-09, demonstrated this. In addition, the period mentioned in this article, 1980 – 2015, corresponds almost exactly to the transition of the Atlantic Decadal Oscillation from its trough shortly before 1980 to its broad peak, 2000 – 2020. As we know the AMO is a repeatable cycle of a period of approximately 70 years.
Therefore it is a reasonable hypothesis that the ‘internal oceanic variability’ discussed in this paper is part of a repeatable worldwide oceanic cycle, of a periodicity of approximately 70 years.
It must also be remembered that the most important factor in the amplitude of any harmonic cycle is the amplitude of the previous cycle. External forcings will only modify the underlying harmonic cycle. This of course complicates the job of trying to ‘ascertain the main cause’ of any external forcing, as any correlations require that the mechanics of the internal oceanic harmonic cycle are first reasonably well understood, something that I have so far seen no evidence of.
Unfortunately that 70 year periodicity doesn’t account for the Mediaeval Warm Period and Little Ice Age hence the need for another factor.
Oymyakon Plateau Temperature Yesterday
Maximum temperature yesterday: -50 °C (at 20:00)
Minimum temperature yesterday: -58 °C (at 02:00)
Average temperature yesterday: -54 °C
I just looked up “Oymyakon”, it is in the northeast part of Siberia, Russia. 80 proof vodka freezes at -24 deg C, so this current temperature might be considered an emergency. No insult to Ireneusz, who I am delighted to see commenting here.
Oymyakon lies near the Road of Bones, so named for the bodies buried under it, to avoid having to make new holes in the permafrost. Estimates range from 250,000 to a million dead gulag prisoners in the frigid hell of the Kolyma camps under Stalin.
Like much of Siberia, Oymyakon has lost population since the end of the USSR, down from 2500 to maybe 900. But it’s still the coldest permanently inhabited town on Earth. The South Pole doesn’t count as a town, but is colder. Average low of coldest month is -57 F at Oymyakon, but -83 at the South Pole.
No warming at the South Pole since continuous record keeping began in 1958, despite the heat island effect of permanent occupation by scientists. Yet with such dry air, it’s exactly where the GHE of CO2 should be most pronounced.
That hypothesis shall not be addressed by climate science. How dare you?
Who dares wins!
Maybe some of the alarmists will weigh in on why there is no warming at the South Pole in this time of “Global Warming”.
A quick look at the U.S. today shows the ole jet stream is dipping south again. It’s going to get chilly for a little bit.
https://earth.nullschool.net/#current/wind/isobaric/500hPa/orthographic=-112.64,29.50,350
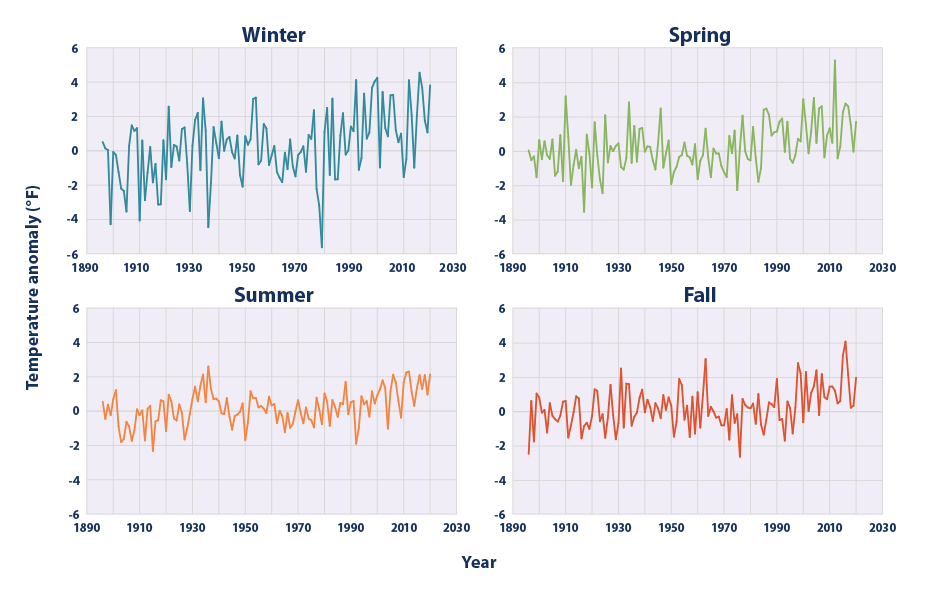
The weather forecasters are making a big deal out of the “record warmth” the central U.S. has experienced in the last few days.
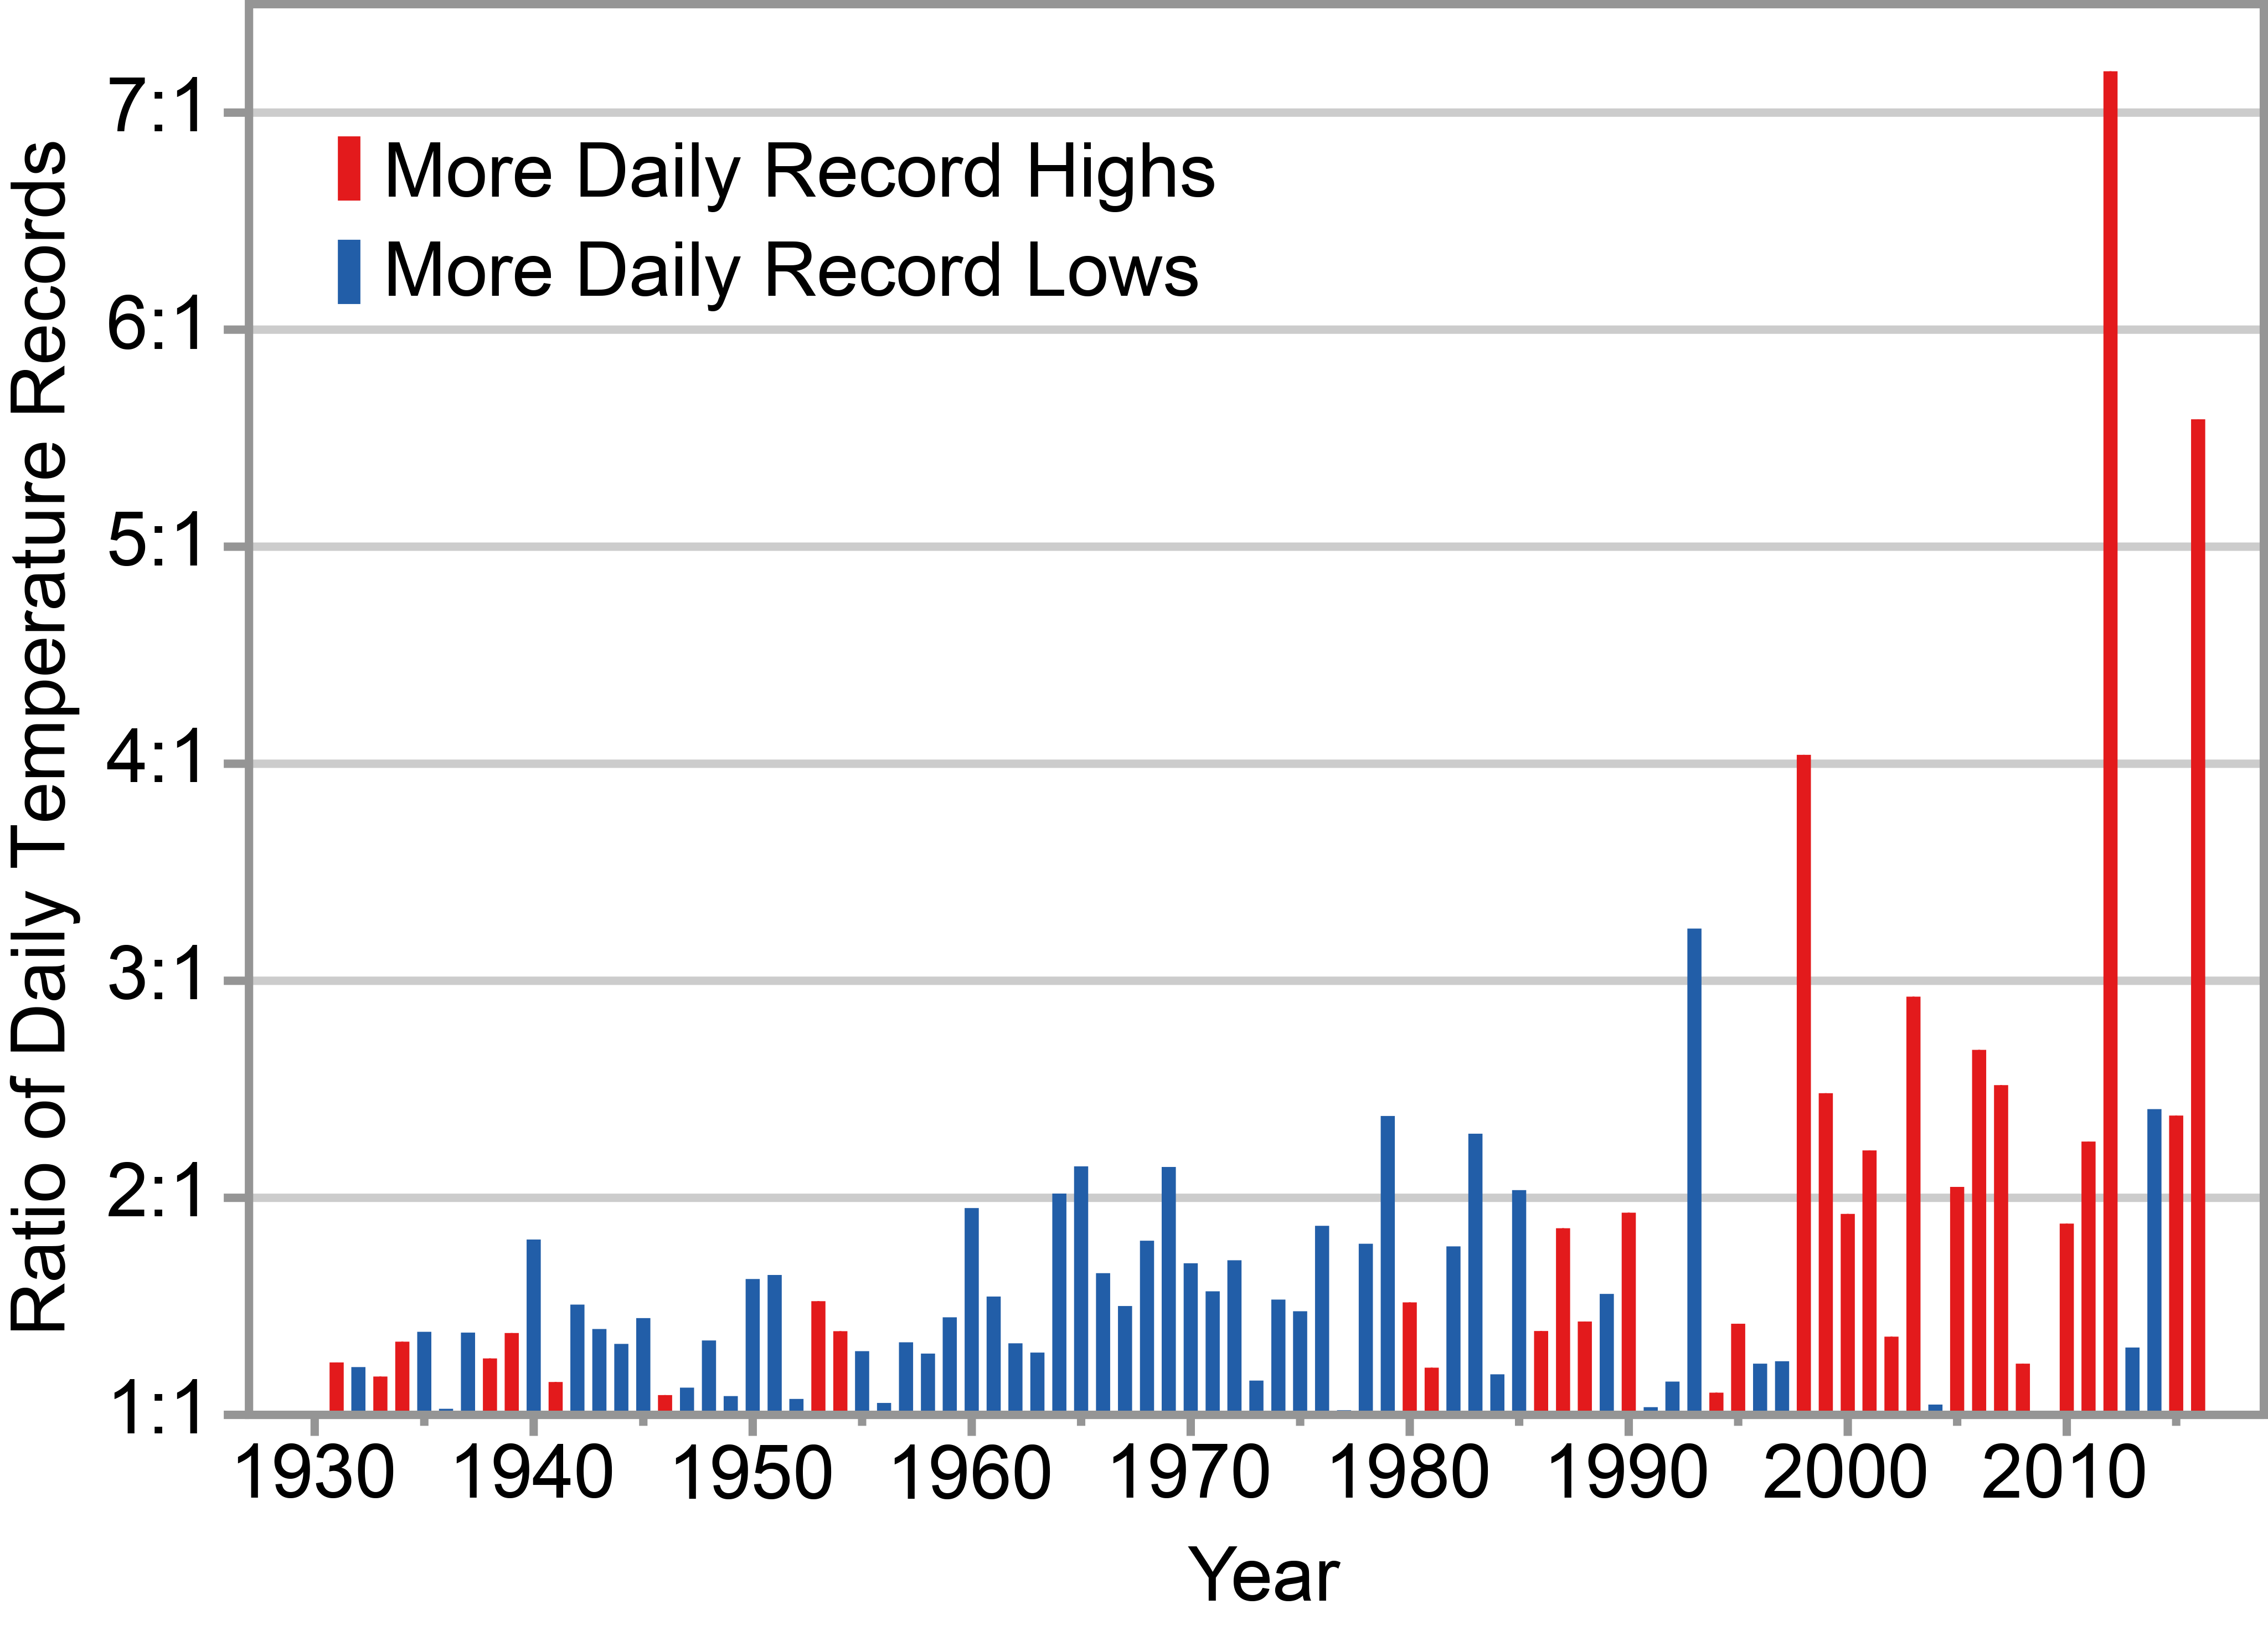
I thought it was funny that some of the examples of record highs being broken were the highs set in the 1930’s.
So we are just as warm as the 1930’s today. In other words, there is no unprecedented warming to speak of today.
And, of course, these few warm days will be gone in the blink of an eye.
I plan on getting out and mulching some leaves with my lawnmower this last warm day. The push lawnmower doesn’t like to start in 50 degree F weather. It should be up in the 70’s today.
“So we are just as warm as the 1930’s today. In other words, there is no unprecedented warming to speak of today.”
The undying myth ….
(for just 1.6% of the Earth’s surface)
Many high temperature records that exceed those of late were set in the late 1800’s. Conveniently, your analysis does not include these.
“ it’s exactly where the GHE of CO2 should be most pronounced”
Indeed so …..
“Our findings indicate that unique climatological conditions over the Antarctic Plateau—a strong surface-based temperature inversion and scarcity of free tropospheric water vapor—cause the negative greenhouse effect.”
https://www.nature.com/articles/s41612-018-0031-y
But it’s not just the plateau. Antarctic sea ice waxed, 1979-2014, all the while it was waning in the Arctic, 1979-2012. So clearly, the control on sea ice is not CO2.
Plus, Patagonian glaciers grew under increasing CO2, as did so many others in the SH and even NH.
Why?
Its just warm air, mainly created by Australia rising up into the sky – as warm air does and because Aus is a desert = high temps and low energy
Then; looking at the schematic, why is the descending air assumed to have come from ‘australia’ – its just ‘descending’ cold air and could have come from anywhere
IOW The strength of this Walker ## circulation is little more than a thermometer for Australia and its general part of the world
## Even if it is a circulation – why is rising air created by Aus destined to do what is claimed and thus descend upon California?
Quote:“These findings highlight an urgent need to improve the prediction of IPO and other decadal internal modes of climate variability.
Utter bollox, apart from the usual request of “More funding please”
What these findings find is an urgent need to KISS
“Its just warm air, mainly created by Australia rising up into the sky – as warm air does and because Aus is a desert…”
Ummm…no. Most of Australia is a dry desert because of High Pressure = descending air. Low Pressure has rising air which is why cloudiness & precipitation are associated with them.
Basic Meteorology 101
PS – I don’t think Australia rises that far into the sky 😉
My biggest question is why does this study stop looking at real data in 2015? Why not at least include data up to 2020? They are missing the majority of changes due to the PDO shift in 2014.
So, why ignore the changes after 2015? Could it be the changes seen don’t match any output from the models?
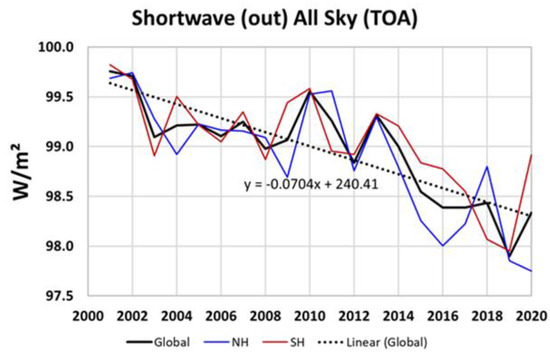
We know from Dübal / Vahrenholt 2021 that significant changes occurred in global clouds especially in the tropical east Pacific. It also appears that these changes in clouds account for all the 21st century warming. It’s very unlikely this matches anything coming out of climate models.
“ Based on the large ensemble simulations from six climate models, we quantified … ”
Things are so nice and simple in model outputs!…
“The Pacific Walker circulation, a large east-west atmospheric circulation along the equatorial Pacific, is observed strengthening during recent decades (1980-2015).”
“The phase transition from positive-to-negative of the ENSO-like fluctuations, known as the Interdecadal Pacific Oscillation (IPO), could explain 63% (~51-72%) of the observed Pacific Walker circulation strengthening over the period of 1980-2015, according to Tianjun Zhou, a senior scientist at IAP, the corresponding author of the study.”
Wikipedia on Walker circulation:
“A scientific study published in May 2006 in the journal Nature indicates that the Walker circulation has been slowing since the mid-19th century. The authors argue that global warming is a likely causative factor in the weakening of the wind pattern.” [the cited NOAA source link is broken, and I could not find the paper in a web search]
Which seems contradictory although the time-spans are a bit different.
But then they continue with:
“However, a 2011 study from The Twentieth Century Reanalysis Project shows that, aside from El Niño Southern Oscillation cycles, the overall speed and direction of the Walker circulation remained steady between 1871 and 2008.”
I guess it being steady for over a century means it is just a multi-decadal oscillation and no long term trend. So increased CO2 has no apparent impact on Walker circulation.
So it is steady 1871-2008 and it is slowing 1950-2006 according to one study and it is rising 1980-2015 according to another…
Reinforces two things in my mind:
1) Climate science in general is far far from settled
2) Anyone can cherry pick whatever study you can find to support your climate worldview (corollary: researchers can cherry pick whatever data time-span to generate results that fit their worldview)
aka ‘Hi! We used fantasy to identify real weather…’
Never mind. More self satisfaction circles.
The climate research community dances around the question of ocean driven multi-decadal climate oscillations like AMO, PDO etc. Some days they believe in it, some days they don’t.
How can such science be made based on the RCP8.5 scenario? (even Zeke Hausfather rejects RCP8.5). Fortunately it shows that the PWC is not sensitive to what RCP scenario is used – as I read it CO2 has only a very brief effect here suggesting that a real ECS near 1C as many scientific papers suggests maybe much more accurate.