After the heavy rains of the past few days over central and northern California, a number of media outlets are talking about California suffering from “Weather Whiplash”, since the record precipitation this autumn follows a year of drier than normal conditions.

And several media outlets are going much further, claiming the the “whiplash” is the result of climate change and is worsening over time (see below). Such articles quote from scientists whose research suggested increasing whiplash based on their examination of climate model projections.
Well, what is the truth?
Global warming has been significant for several decades so we should see evidence of increasing “whiplash” if climate change is a major forcing mechanism. Strangely, none of the handful of studies in the scientific literature on whiplash has looked at the observational record. Just the climate models.
But in this blog, the analysis will be done!
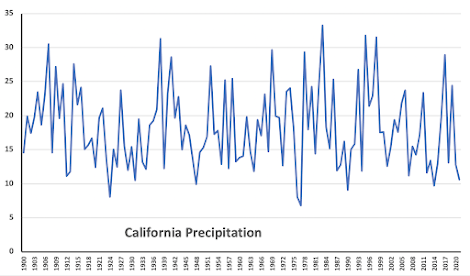
Let’s examine the NOAA/NWS climate division data for California, and specifically, the precipitation for California’s wet season of November through March from 1900 through 2021 (see below).
One is struck by several things.
There is really not much trend in California’s winter precipitation.
And there is a lot of up and down variability—yes, weather whiplash. But there does not seem to be any long-term trend for more or less precipitation whiplash.
To illustrate this point, let’s plot the yearly whiplash…a WHIPLASH INDEX.. by simply taking the difference between each year’s and the previous year’s winter precipitation for California. Since we don’t care which way the whiplash goes (wet to dry or dry to wet), I will plot the absolute value of the difference. I also plotted (red dots), a 10-year moving average to smooth out the variation over time (see below).
Really very little long-term trend in California precipitation whiplash, with the worst of it from roughly 1975 to 1997.
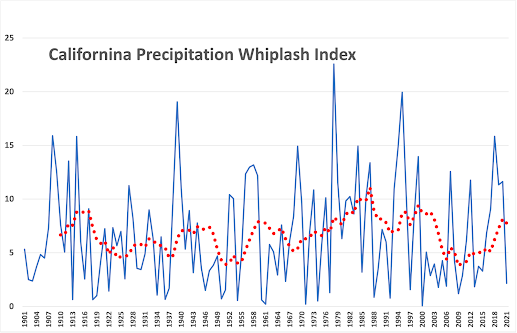
So the bottom line in all this is that there is really little OBSERVED evidence for a long-term increase in year-to-year whiplash for California precipitation and certainly no evidence that global warming is making whiplash worse during the past few decades.
Why has California experienced precipitation whiplash so often?
Because it is near the boundary between the dry subtropics and the moist, storm-laden midlatitudes. A few times a year, the jet stream dips southward, bringing in potent storm systems, or scooping moisture from the tropics in atmospheric rivers. Miss a few of these excursions and California has a dry winter. Have an active year when the jet stream pushes unusually southward….heavy rain and precipitation.
In contrast, the more northern Pacific Northwest is reliably under the influence of the storm-laden jet stream. Less whiplash.
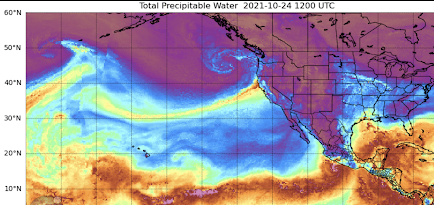
An atmospheric river heads into California
Will whiplash get worse in the future?
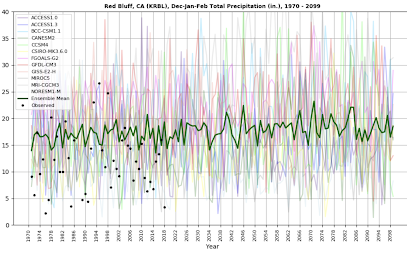
I am involved in regional climate simulations, using an ensemble of high-resolution projections driven by an ensemble of many global climate models. This is the gold standard for such work. We ran these simulations using the highly aggressive RCP 8.5 scenario for increasing greenhouse gases, which is certainly not realistic since it assumes that mankind keeps on burning increasing amounts of coal, among other things.
Below are the results for Red Bluff in northern California (winter precipitation) through 2100, with the green lines being the average of the many forecasts. During the end of the century, there is perhaps some suggestion of occasionally larger whiplash, but also extended periods of less whiplash. But again, the amount of CO2 emissions is undoubtedly too large.
I think the jury is still out on whether California whiplash will increase significantly during the second half of this century. And the research studies that have suggested big increases during this century also predicted major whiplash increases during the past two decades. These have not verified with observations.
But the jury, viewing the observations, have released a definitive ruling on whether precipitation whiplash is increasing during the past 120 years in California: no evidence for it, case dismissed.

Good luck getting anyone in authority to listen.
They are as blinkered as the old Witchfinder General.
If they can’t prove a climate problem they’ll make it up just like all of AGW.
Next on the climate “science” news:
“A cold jab all over Europe (from climate change, with the left hand, for sure)”
“Antarctica suffering a thermal kick (from the hoofs of climate change, of course)”
“Climate change slapping the Tibetean plateau”
…
Should we hypothesise that climate “science” has entered its wrestling phase?
If the atmosphere were to be relatively deficient in cloud condensation nuclei, how would precipitation events differ? I have a vague recollection that CCN deficient clouds would tend to release rain in harder, shorter bursts.
Any sign of that phenomenon in the data?
JF
I thought that RCP 8.5 was not realistic because it shows massive temperature rises based on rises in CO2 emissions that are broadly in line with what’s actually happening. It actually proves the CAGW hypothesis wrong.
Judith had a long post recently on RCP8.5. It is unrealistic for two reasons. First, supposedly BAU but actually far from it. Second, the amount of FF (especially coal) use projected is borderline impossible given recycled steel and CCGT. But you are correct that it’s regular use to project future alarm proves the unrealistic climate model alarm biases.
A new alarmist term—weather whiplash (caused by climate change). The older alarm of increasing extremes has apparently been put to bed since they were not increasing. Demonstrated that for all examples in Chapter one of the 2014 National Climate Assessment in essay ‘Credibility Conundrums’ in ebook Blowing Smoke.
Now we find CA doesn’t have worsening whiplash, just the same old weather whiplash it always had. And regional downscaled climate models don’t show CA whiplash increasing in the future, either. How disappointing for Californians forced into renewables and banned from ICE garden equipment and chain saws for forest management.
Yes, same old, and in California’s early days there was a bias toward real action.
“Visitors learn of the multiple natural disasters that challenged the City from its start in 1848, including fire, disease and flooding. The most devastating of these threats was flooding. On multiple occasions during the city’s first years, rising waters from the Sacramento and American Rivers—the city’s major highways and keys to its economic and political success-inundated Sacramento at tremendous cost and human loss. They counteracted the force of nature by building levees, re-routing a river, and physically raising the streets of its business district over 20 feet above the flood plain.”
https://www.parks.ca.gov/?page_id=26259
Being willing to report that the weather varies so much due to unknown causes already there is no pattern is something a zealot cannot do.
If Calizuela is suffering from “climate whiplash” they need look no further than who is driving!
When you allow Progressive politicians that are likely on the take from the CCP to run your state for decades, then you should consider yourself lucky that the airbags have not yet been deployed! Perhaps part of the whiplash effect is due to watching major parts of the old California Dream flashing by and disappearing in the rear view mirror!
Californians are experiencing historically typical weather for California. Get comfortable with it.
I am in No. CA and am comfortable with it. Yes it had always been this way. We should all realize that record for autumn, is record for AUTUMN, not ever.
Johnny Carson once joked (when the mudslides came invariably after a big fire season) that California was the only place you could get a speeding ticket on Pacific Coast Highway while sitting in your living room.
You just don’t understand! ANY weather event is simply the result of “climate change”! ANY event! EVERY event! GET WITH THE PROGRAM, DAMMIT!
The last time this happened was in 2004 and the ski resorts opened by holloween. They will be doing it again this year. It’s not at all unprecedented and happens every 10-15 years. If anything, the gap between this time and the last time was on the long side, although the storm itself was on the cold side for as much tropical moisture it contained and definitely was one of the earliest winter storms we’ve seen. The 8″ of rain followed by 4″ of snow at 5K feet did muck up my backyard construction project …
Two years ago we visited daughter and family for thanksgiving week. Evergreen CO. We got 2 feet on Tuesday, sledded on the property Wednesday with the grandkids, and went skiing with daughter at Estes Park on Friday. They had been making snow to open mid December, but the 2 feet of wettish snow meant an all run early open. Gorgeous day, lucky weather.
Among hard-core back-country skiers, it used to be a thing in Colorado to have skied at least one day in every single month of the year.
Albeit the skiing in July, August and September is pretty lousy, if one doesn’t mind a hike, it’s still possible to ski any day of the year.
October will be month 60 in a row for me. My previous streak was 131 months. And yes, summer skiing usually involves hiking up to about 10K+ feet, but if you have the right vehicle, you can drive to about 9K in a few places and then you don’t need to pack as much beer for the hike.
I have to correct you on one point though, some of the most fun corn snow I’ve skied has been on summer snow fields in August. If it’s a big winter, high altitude summer snow tucked away in North facing bowls can be really good.
Are you in CO? I’ve only done St. Mary’s Glacier in the summer and would like to hear about a good North facing bowl.
I’m in Nevada.
Good explanation of how the weather changes from day to day naturally.
It seems Calafornia is a geographical location that has it’s fair share of extremes . .
Periodically. :-}
The last time the Central Valley flooded was in the 1860s. When the rains began, the Native Americans warned everyone that the water would rise higher than the trees. They left the valley for higher ground. Many who did not head their warnings died. The governor’s mansion in Sacramento was only accessible by boat through the second story windows.
This weather event is well documented.
Interestingly, the latest rendition of the Salton Sea was formed in 1905 from Colorado River flooding. Apparently, it had been a dry lake since the late 1500’s.
Actually, the Sacramento Valley was originally pretty much a large swamp until drained for agriculture. However, Highway 50 is elevated for a good stretch before Sacramento because it floods so often even in modern times.
However, the Great Flood of 1861-1862 created a continuous lake about 20 miles wide by 300 miles long! https://en.wikipedia.org/wiki/Great_Flood_of_1862
I think you mean I80. 50 terminates when it joins 80 in Sacto.
And the flooding is because there is a weir just upstream on the Sacramento river that floods the Yolo Bypass when the river gets high enough to prevent Sacramento itself from flooding. The Yolo Causeway elevates I80 over the bypass which eventually reenters the river in the Sacramento/San Joaquin Delta.
It was the Yolo Causeway that I was thinking of. I’ve been gone from California for about 20 years now. Thank you for the correction.
“…using an ensemble of high-resolution projections driven by an ensemble of many global climate models. This is the gold standard for such work.”
Uh huh. And tell me how often this “gold standard” has accurately predicted anything 25 years in the future.
Sorry, but what you have is more unproved models – and whether they give an answer favoring one side or the other – they are simply unproved models with no scientific value.
It is the gold standard because the most expensive, not because it actually works.
But in this case, by the gold standard not showing increasing whiplash, maybe we should make an exception and give it a passing grade.
Yes, the first part based on actual data is good. It shows, once again, how scary climate change really is: it is causing normal weather on an unprecedented scale. Unless we can bring back the monster storms of the Little Ice Age (as per H.H.Lamb) then we really are doomed.
Sorry, original poster, whoever you are, I can’t take anyone seriously who thinks junk computer models can predict the distant future. Using ensembles is a joke: how can a hundred junk models be any better than a single junk model?
Chris
Or tell us how much gold has that standard…
Sure weather whiplash is real. In Calgary we call it change of seasons. It seems to be an annual event. I am more concerned about climate constipation – a condition of being so full of sh#t you can’t tell nice weather from Armageddon.
Here in Calgary we call it a chinook
-35c to +10c in one hour
Boom
And a more authoritative source (rhymes with leotardo carpaccio) tells us the Chinook is actually climate Armageddon.
From the article: “Why has California experienced precipitation whiplash so often?
Because it is near the boundary between the dry subtropics and the moist, storm-laden midlatitudes. A few times a year, the jet stream dips southward, bringing in potent storm systems, or scooping moisture from the tropics in atmospheric rivers. Miss a few of these excursions and California has a dry winter. Have an active year when the jet stream pushes unusually southward….heavy rain and precipitation.”
Here is a good illustration of what you are talking about. It’s the Nullschool link for today with the dip in the jet stream over the western U.S. marked:
https://earth.nullschool.net/#current/wind/isobaric/500hPa/orthographic=-82.96,57.57,264/loc=-96.865,36.392
Averaging the averages? Produces invalid results
Right final sentence, wrong reasoning.
Using the impossible unrealistic RCP 8.5 averaged ensembles and considering it a “gold standard” is patently absurd.
Further, using said average RCP 8.5 ensemble and accepting any future projection is madness.
One can only ask, what CO₂ emissions?!
You’ve not provided any information regarding CO₂ levels, or are you claiming current CO₂ levels are too high?
Based upon what? Realclimate or NOAA’s delusional mutterings and specious claims?
“But again, the amount of CO2 emissions is undoubtedly too large”
Maybe he was referring to Nature’s CO2 emissions, which are around 30 times higher than mankind’s. How dare Nature emit such huge amounts of that polluting poison?
Chris
If your view point is a short enough time span , any cycle will look like a trend.
Who was that masked man going by the name of “Guest Blogger?”
I doubt that it’s Willis E. – he likes to use photos as backgrounds to his graphs.
whiplash = cognitive dissonance
We living in 34 million year icehouse and global warmer believers think we going to get too warm
Given that California has a town named “Atascadero” (Spanish for ‘muddy place’), I tend to believe that there have been many years of plentiful rainfall in the past.
I grew up in Southern California. I see nothing in the reports coming from there recently that differs from my personal experience living there for several decades.
It’s like they’re eliminating the past.
The article started out well showing actual data. It then went off the rails by showing “predictions” made by “gold standard” models using the completely discredited RCP 8.5 scenario. These models have never been shown to have ANY skill in predicting long term precipitation. The only thing that can be concluded from the models is that they’re all over the map. Look at thei extreme variability from run to run. It’s stunning that the author missed the inescapable conclusion that models are useless for predicting changes in precipitation let alone precipitation whiplash.
Newsflash: Bomb cyclone causes weather whiplash.
Notice the hysteria that news agencies generate and promote.
Who ever thought that “our democracy” was beholden to purveyors of mass hysteria? That’s all you see in the press anymore. But when you look outside, its the same as it ever was.
Doonman,
You’re right.
And I bet you’re experientially gifted [‘old’ as it used to be known, pre-Woke].
Kids these days believe everything is new.
‘Cor! Look at that! What is it, Dad?’
‘That’s sunrise, Junior!’
Auto
Can you post a link to the first graph?