
Video shows how the redistribution of tropical ocean heat to the Arctic can raise the global average temperature without any added energy to the earth’s climate A simple at home experiment demonstrates the dynamic.
It also shows how variations in the inflow of warm Atlantic water has caused variations in Arctic sea ice and Arctic temperatures over the past 9000 years.
A transcript of this video is available at : https://perhapsallnatural.blogspot.com/2021/10/how-transport-of-tropical-ocean-heat.html
Great lecture about the most important feature of ‘climate change’, the one that really explains what moves surface temperatures.
(and thanks for the transcript)
Yes, excellent video!
solar wind drives climate, not CO2
https://solarclimate.tumblr.com/post/662931197224271872/solar-wind-drives-climate-not-co2
good basic science explanation
shame general public are so uneducated
I imagine/hope this video is highly compressed and edited:
People Sign Petition to Preserve the Triceratops
https://youtu.be/KFuFqA4CG78
But it is disturbing to see even a few sign, as I learned this in the “dinosaur module” in the 3rd grade.
I don’t know what is happening in our schools these days. (sigh)
Ban dihydrogen monoxide!
Ban Carbon Dioxide remove it all from the atmosphere
consequences of sure death for all life but we would be decarbonised
Been saying much the same for over 10 years now.
If this is correct, if the consensus and the IPCC reports really do omit to distinguish between redistributed heat and increased heat, there is a fundamental conceptual failure in the consensus account.
If they really do assume that all local temperature rises are due to rise in temperature from forcing.
I will need some persuasion of this, but, if its really so, its a fundamental flaw and would almost certainly lead to a refutation of the climate sensitivity hypothesis.
It really is a fundamental flaw, and it shows itself by talking about a “global temperature” in the first place. In actuality, we have hundreds of unique climates, and they all obey the laws of thermodynamics, meaning they will respond to each other to lower the total energy in the system.
Flows of energy from one location to another, like the currents in the oceans, are what cause our weather in the first place. Trying to treat it all as a single, homogeneous body/mass is what fails. Won’t work – because it’s not what we are.
Sir Walter Rawleigh’s experiment was a closed system and was like a closed glasshouse
the earth’s atmosphere and oceans are open systems to and from space which is at absolute zero
The fundamentals of open and closed systems are completely different
physics is important
todays climate scientists are no more than political social students
when you have an engineering degree / physics degree and demonstrate you understand the laws of thermodynamics then you might be okay to develop a basic model
Yes, physics is important, and if you understood physics and thermodynamics, you would know that even in an open system – energy tries to equalize across adjoining realms, with the appropriate thermal resistances, etc. impeding that flow.
Add more heat to a boiling pot, and the heat is quickly distributed throughout the water. It doesn’t stay in just one location. This is like really basic stuff here…
Dan, your model of temperature distribution within the water volume is better served if your illustrative pot of water is not yet boiling, as by that point added heat energy only drives off more water vapor while the pot’s contents remain stably distributed at its boiling temperature and so is capped from going higher in any location.
It is certainly very evident here. Things get hot when high pressure makes for very still air. A few days later the local pressure changes, cooler winds move in, and temperatures go down significantly. During the warmer half of the year, the sky is almost always cloudless and the sun bright, for both phases of the pressure cycles. Local high and low temperatures are very much influenced by air that moves into, or gets temporarily stuck over the valley here, seemingly as much as by anything that occurs locally. These cycles repeat throughout the year but are most noticeable, at least to me, in the summer.
I just commented at the tallbloke site four days ago (Oct 16), that although the global mean surface temperature (GMST) records follow the El Niño-La Niña ocean cycles quite well (I cited what I considered the best evidence, of the work of Dr. Horst Malberg, in that comment), they do not, in fact, change the GMST
<a href=”https://tallbloke.wordpress.com/2021/10/15/qa-la-ninas-back/comment-page-1/#comment-172696″>tallbloke comment 101621</a>
So the real meaning of this report is to confirm that the GMST temperatures are WRONG, due to a fundamental incompetence. Tony Heller, a.k.a. Steven Goddard, has amassed a huge amount of historical reports and data analysis to independently prove this, and I myself showed from his data that <a href=”http://theendofthemystery.blogspot.com/2012/10/us-temperatures-have-been-falsely.html”>US Temperatures Have Been Falsely Adjusted According to the Level of Carbon Dioxide in the Atmosphere</a>, and why any good physicist should know this, based only on the one degree supposed rise in GMST over the last century.
My 2012 blog post, <a href=”http://theendofthemystery.blogspot.com/2012/02/on-fundamental-warming-of-atmosphere.html”>On the Fundamental Warming of the Atmosphere</a>, not to mention my seminal Venus/Earth comparison two years earlier, first reported the obvious truth, that the atmosphere is maintained in its governing lapse rate temperature structure by direct absorption of incident solar radiation, in the infrared, while the (winds and other) weather is driven by direct, but uneven, heating of the Earth’s surface.
So, like Stephen Wilde, I solved the “global warming” false science 11 years ago. The truth lies in the century-old Standard Atmosphere, which had it right all along.
Great video, should be shown to schoolchildren above 10 or 11 years of age. Most of us knew or suspected that is the case. I have written number of comments on this blog stating many of the facts and points raised here.
Thanks to all involved in making this video and the transcript available,
In the CET we have 350 year long record, so let see what it shows:
In the northern hemisphere most of the solar input is during the summer months of Jun-July, but the temperature does go higher due to thermal capacity of the land and nearby Atlantic ocean.
The Met office data shows that the June-July mean temperature was rising at 0.1C/century (see trend line on the graph below), i.e temperature rose a mighty 0.3C during the last 350 years from an average of 15C to 15.3C. It is surprising that despite the recovery from depths of LIA rise is not greater.
Looking at spectrum of the data there are two notable peaks of 9 years (N. Atlantic’s AMO) and 22.2 years (Sunspot magnetic cycle).
On the effect of both I commented before, this time attached is the updated graph (click on to see detail)
The northern hemisphere polar ocean has been in existence at least since the Cretaceous.
The same mechanism of ocean heat transport from the tropics resulting in warming of the arctic latitudes occurred then as now.
Golovneva, L.B., 2000. The Maastrichtian Late Cretaceous climate in the Northern Hemisphere.
Good to see that important article again. Interesting is Golovneva’s Figure 2: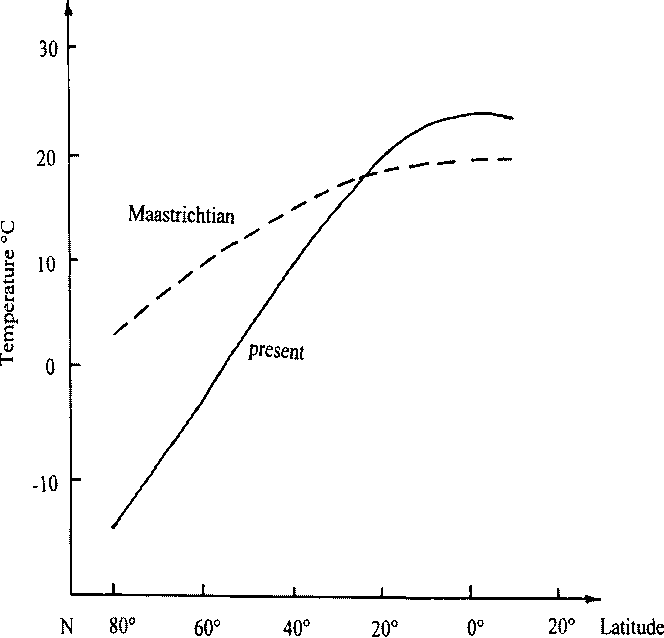
The smaller gradient in warmer periods shows why ‘a warm North Atlantic wave’ during a warm period has smaller temperature consequences than a warm wave during periods even colder than present (= during a glacial). The Dansgaard-Oescher events (that in my opinion are caused by the same oceanic changes) caused temperature changes of 8-10 degrees, as shown by Greenland ice cores. When the temperature gradient is high, the changes in weather systems are much larger when sea ice temporarily melts and with much higher consequences: more ice and snow will melt, causing a much higher temperature fluctuation over the NH and over the Earth as a whole.
1 – Heat distribution is really important.
The heat the Earth radiates to space is determined by the fourth power of the temperature. If the atmosphere, and oceans, and rotation perfectly distributed heat, and the planet’s temperature were same all over, the average temperature would be such that the apparent greenhouse effect would be cut in half.
2 – As Jim points out, the sea ice mostly melts from the bottom up starting in about March in the Canadian high arctic. Only much later in the season, does one see melt water on the surface of the ice.
3 – A very high proportion of the heat entering the arctic is transported by the atmosphere.
From the transcript: “Now researchers also compared the warmer Atlantic inflows during three reason warm periods to the intervening cold periods, their results also found a strong relationship between increasing warm inflows and decreasing sea ice. During the cold periods inflows decreased and sea ice increase.”
So what causes the decrease and increase in inflows? I’m thinking speed of currents here. Or are you just referring to increased warmth in a steady current? I guess I’m a little confused here.
Excellent presentation, Jim.
And thanks for the transcript. I can’t copy and paste from a video. 🙂
Tom Abbott: “So what causes the decrease and increase in inflows? I’m thinking speed of currents here. Or are you just referring to increased warmth in a steady current?”
WR: Tine Rasmussen was the author of many papers regarding a change in oceanic fluxes in the North Atlantic during the last Glacial and the Holocene. Her papers give a lot of interesting information. From Polyakov et al. I understood that recent warm influxes in the Arctic were subsurface inflows of warmer than normal Atlantic water. Atlantic water is more saline than the top layer of the Arctic that lost a lot of salt during freezing of sea-ice and because of its lower density (even being colder) keeps floating on the intruding North Atlantic subsurface waters.
I also wondered what the reason for the ‘warmer than normal subsurface inflows’ was. My guess is that more saline than normal surface water became transported from the N. Atlantic Gyre to the North, probably by slightly changing weather patterns. That more saline water (being denser from the beginning) could sink in the Norwegian Sea when it was warmer than other less saline surface water that cooled equally but, because of its lower salinity, only can sink when it cools down more – and so only could continue its round trip through the Arctic as colder subsurface North Atlantic Water.
So I hypothesize that it is the combination of transport of more saline water from the North Atlantic Gyre to the North, a transport in which changing weather patterns play a role as well. When more saline water first comes northward it will sink at less high latitudes, changing the upper layers of the oceans in the downwelling area and so changing local/regional weather patterns etc. etc.
Thanks for that explanation, Wim, it is much appreciated.
Another great video Jim!
I hope that some day soon there will be DVDs of your lectures to share with family, friends and students! Keep up the great work!
and describes an epic case of Emperor’s Clothes – which we see here monthly coming from Roy Spencer
Spencer uses Sputniks to look at the emissivity (radiative energy emissions) of Oxygen/Nitrogen to get his Global Temperature results
We get figures for various parts of the globe, North South Land Water
How Many People take/mistake the results there for ‘air temperature‘ over the oceans to be the temperature of the actual water?
Do you?
Spencer can not measure the water temperature so when he asserts that the temperature of the ocean is ‘changed’ ‘hotter’ ‘colder’ ‘whatever’ do be aware of what he is saying.
(He does make it very clear every time, but………………)
What he’s measuring is wafts, draughts, blasts, plumes call them what you will of air that has come off the land and blown out to sea.
The Santa Ana wind being a gorgeous example but we’ve also got the Bora, Sciroco, Chinook etc = all things being heated by the Foehn Effect and a lot of them blowing out to sea
And if the last thing they do before leaving shore is blow over a desert, they will be hotter than if they blew over a forest of any description, even just a forest of grass
Carbon Dioxide didn’t do that. Natural Variation didn’t do that. Neither did El Sol
Chainsaws, Ploughs, Ammonium Nitrate, Roundup and Goats did that and, while they were working, released a True Shedload of CO2
Not least the Argo floats and (lockdown) data from Mauna Loa agree with me.
Farming didn’t stop when all else did during lockdown – Covid created the corpses, not any lack of food
Peta, I live in Chinook country and would like to post my understanding of this phenomena for comment. First, the Chinook is generated from drying Pacific air moving inland and falling down the eastern slopes of the Rockies. The heat is generated from compression and friction effects on the air mass.
This wind is definitely not moving heat out to the ocean, and can blow at strongly at night so solar heating effects are minimal.
Correct, all it needs is a high-low pressure gradient, in Colorado they are typically southwesterly (but not always).
Uh, Peta, desert areas are shrinking with the greening caused by more CO2. So much for your INSANE theory about nutrient free dirt causing climate change. Give it up. You’re giving climate alarmists ammunition to claim that climate realists are a bunch of nuts and distracting from well thought-out skepticism like Jim Steele’s.
“redistribution of tropical ocean heat to the Arctic can raise the global average temperature without any added energy to the earth’s climate”
An excellent and crucial point.
It follows logically from the vast heat capacity of the oceans that circulation related heat changes are going to be adiabatic (no overall heat gain or loss) in the short term which for the ocean means some years.
A “crown jewel” argument of alarmists is their data showing ocean temperatures increasing. Show that to be artificial and that leaves a big hole in the alarmist narrative.
The paradigm of the alarmists that any change of climate temperature can only be top of atmosphere radiation budget, is only possible if you ignore the ocean altogether.
As Richard Lindzen says, this heat redistribution in the ocean that Jim is describing means that climate could change substantially and continually for a thousands of years with zero change to the climate (ocean) heat content.
Thank you for the transcript. This is why I come to WUWT.
Loved the illustration of a boiling saucepan and the kitchen floor. It’s simple and obvious once you read it.
Very clear.
Oh dear, the Averagers won’t like this:
In addition, Northern Hemisphere temps are out of phase with Southern Hemisphere temps. When you combine them to form a data set being used to find an “average” temp you are finding the average of at least a double-hump population. In such a case the mean (average) is meaningless. It describes nothing about the populations at either end of the population. It’s actually even worse than that since you are actually creating a multi-modal distribution, e.g. the temp distributions of Spain, Cairo, Toronto, or Buenos Aires are all different. You wind up with numerous “humps” in the overall data set. And, again, the mean calculated from all these non-congruent distributions tells you nothing about any of them. Weather differences from year to year can cause a change in the mean without actually telling you anything about the global “climate”.
P.S. Using anomalies won’t help since they are calculated from non-congruent, local “averages”. All the anomalies do is mask the fact that there are multiple, non-congruent distributions – the average of the anomalies is still as meaningless as the average of the absolute values.
The amount of hand-waving that is done to justify these meaningless calculations is overwhelming.
Whenever anyone brings up the topic of temp. distributions they go quiet and jump to something else.
Anomalies are designed to hide variance. That is why each station has its own baseline that is used to calculate an anomaly. Think of the variance between Chicago in the winter while Rio de Janeiro is in the summer. The variance is truly huge and causes a double hump in the population distribution. Now reduce that variance by concocting an “anomaly”. You just lost the ability to recognize any total temperature variations in either location. Are summer temps falling or rising? Are winter temps falling or rising? How about a little of each? What locations? Where should we be looking for why? Who knows. At the very least, a common, global baseline should be used at each and every station. If that means large anomalies, well so be it!
Making global surface temperature more uniform causes the average surface temperature to increase in order to radiate away the same amount of heat, because the rate at which a surface radiates heat is nonlinear with temperature in a concave upward manner (proportional to temperature to the 4th power for a blackbody radiator.). What doesn’t change is the “root mean 4th” surface temperature. (Oversimplified to the case of the rate at which a surface gets rid of heat being proportional to temperature^4.)
Meanwhile, nearly all of the world has warmed including most of the tropics. Both average and “root-mean-4th” global surface temperatures have increased, although the average increased more than the “root mean 4th” temperature has. This increase of both average and “root-mean-4th” global surface temperature is from increase of greenhouse gases returning to the surface some of the heat radiated away by the surface.
It’s not obvious from anything I can easily find that tropical sea temp has increased much, if at all. There is so much more sea area at the equator than land area, that it is the sea temp that would dominate in any “average” temp.
The average global surface temp is a farce. It is mixing different temperature populations into a multi-modal time series distribution. The “average” from such a distribution really tells you nothing useful at all.
It still upsets me to no end when people say “surface temperature”. The planet has a surface composed of land and oceans that is basically heated by the sun. The atmosphere IS NOT the surface and receives heat from the surface. The atmosphere has an entirely different composition and entirely different fluidic motion compared to the land and oceans.
Please distinguish what “surface” you are discussing, the planet surface or the lower atmosphere that is in contact with the real surface.
I have been watching the sea surface temp chart almost daily since 2008 and noticed frequent long spells of sea surface heat anomalies in and North of the Bering Straight, off the Arctic Coast of Siberia. North of the Hudson Bay and some times to the east between Iceland and Greenland and wondered where the anomalously warm water came from. I doubted that geothermal heat would be massive enough to heat up that much sea water and wondered if tropical water could be the explanation but did not understand how it could move so far north and why. So thanks… the study and video really helps a Father trying to steer the minds of to teenagers.
This reminds me of the old story about the famous bank robber in the Great Depression, Willie Sutton, who was asked “Why do you rob banks?”, and his answer was “Because that’s where the money is”.
Same thing applies to heat energy – why do the oceans contain most of the surface heat energy and control the distribution thereof? Because that’s where the joules are.
The world’s oceans are massively larger than the world’s atmosphere in two respects:
1) Mass. The total mass of the world’s oceans is about two and a half orders of magnitude greater than the mass of the world’s atmosphere.
2) Specific heat capacity. The specific heat content of water is approx. 4.5 times the specific heat capacity of air at normal standard conditions.
So basically, most of the world’s variable heat content, outside of the rocky planet itself, is contained not in the atmosphere but in the oceans – by at least three orders of magnitude.
In other words, the world’s oceans constitute a massive heat sink vastly more influential than the atmosphere.
The warmunists claim that the atmosphere is the heat engine for the oceans, when it is obvious that the opposite is true.
Therefore ocean circulations are what control atmospheric conditions both in the short term and in the long term of geological timescales.
And you don’t even have to have a strong education in the physical sciences to see this at work … just pay attention to the weather forecasts.
In the summer, it is the influence of warm moist oceanic air masses that results in moderating influences created by the astrophysical conditions (earth’s tilt on its axis affecting the solar energy input) that prevents all land masses on earth from experiencing scorching low altitude air temperature, and also delivers rain fall. In the US, with the influences of the prevailing westerlies coming off the Pacific Ocean crossing the American continent west to east .. and the prevailing low pressure zones over the very warm Gulf of Mexico to the south that control both temperatures and precipitation, with the drier areas in the “wind shadow” of the Rocky Mountains being much drier and hotter than in the coastal areas, or much further “downstream” in the eastern great plains and trans-Appalachian of the eastern US.
In the winter, it is the warm moist Pacific westerlies that create both massive precipitation, especially in the Sierras and Rockies, as well as moderating temperatures that are fall higher than in the dry continental interior of the continent, subject to repeated very dry and very cold air masses penetrating from the Arctic all the way down to the Gulf of Mexico and western Atlantic, the typical winter “cold fronts”.
Other factors also figure in, such as coriolus effects on wind circulation year around, such as the trade winds in the tropical zones, the “doldrums” just north of the tropical zones, and the strong westerlies to the north oft he doldrums … and similarly in the southern hemisphere.
But regardless of where the wind comes from, it is extremely impacted by the stored heat and moisture created by the worlds oceans … not the other way around.
My own unscientific test at my lake in SW Saskatchewan in the summer of 2020 confirms this.
Ice thaws in the spring then the lake warms steadily to ~76F at end of july even though it was one of the coolest least comfortable June-July periods in years. Then the pattern shifted and late July all through august we had much warmer temps and yet by the end of august the lake had cooled to 64F.
Its the sun height/angle, the temperature of the air over the lake had almost no effect.
Excellent summary. This is exactly what I was trying to point out in a shorter fashion above. The “surface” is made up of two parts, the /and/ocean and the atmosphere. They each have their own heat capacity and more importantly, different gradients throughout.
Duane, anyone viewing an animation of wide western U.S. satellite imagery or even serial forecast maps over a few days will see that its not just plain Pacific westerlies bearing water vapor due east to condense over the continental U.S., but those cold/dry Gulf of Alaska bred ‘cold front’ air masses are wringing out the condensing water vapor transported from ‘warm front’ air masses originating over lower Pacific Ocean latitudes driven by southern branches of the jetstream looping upward from lesser southwest to higher northeast latitudes (lately nicknamed ‘the pineapple express’ when impacting us here in southern California from Pacific Ocean regions at semi-tropical Hawaiian latitudes), in a Coriolis force driven comma-like arching precipitating meeting of the two, the more locally tightly twisted near the associated low atmospheric pressure area.
Mr. weekly rise recently asked for “global” stuff, maybe he can post some graph showing Steele is wrong and how he really, really wants the best for us.
From the Transcript (greatly appreciated as I am 98% deaf)
bolding mine
I saw that pattern a few years ago when I came across a number of published papers showing that low levels of Arctic Sea Ice especially in the summer coincided with increased inflows of warm waters from the Atlantic.
Here is a list of publications:
Thread Title: Little to No Summer ice in the Arctic
Forum Link
Thanks for the link
The polar regions are long appreciated by atmosperic physicists as the Earth’s variable radiators. They vary both cloud cover and sea ice cover to both alter albedo and ventilation of ocean heat back to the atmosphere, all in a complex manner.
Compare this to the equatorial tropics which are Earth’s energy input, at 50% of Earth’s surface between 30N to 30S. They can vary energy input (short wave solar energy to surface) only by cloud cover.
This difference in complexity and coupled nonlinear dynamics makes a sad joke of climate models and the modellers trying to figure out what is going on.
My wife got really mad at me when I dumped the hot water on the kitchen floor. Guess I should have picked up the throw rugs and gotten some old towels out first. 😁
LOL. I considered warning people to first get their spouse’s OK
Thanks Jim. I really enjoy your posts here. Very well done.
Why would wind blow from the cooler land to the warmer ocean? Doesn’t wind blow from warmer to cooler? That is what Cliff Mas said about the pacific northwest where global warming would preferentially warm the land so the wind would blow towards the ocean whereas the opposite is observed.
Paul, Winds blow from high pressure to low pressure. Higher temperatures create lower pressures than colder temperatures. On a local scale consider ocean or lake breezes. The land heats faster than the ocean during the day, the breezes blow onshore. At night the land cools faster than the ocean and the winds blow off shore. I suspect you misunderstood what Cliff Mass was arguing