Guest essay by Larry Hamlin
The Orange County Register has published in the last month 3 climate alarmist hyped articles (the latest article is shown below) which grossly exaggerate claims by California “experts” that the state’s future coastal sea level rise by 2050 might be 3.5 feet or maybe 6 feet or maybe 7 feet by 2100 or maybe 10 feet by 2100.

The rate of California’s coastal sea level rise is not a mystery but is in fact clearly documented by NOAA measured tide gauge data going back more than century.
This ridiculous coastal sea level rise guessing game by the state’s “experts” is based solely upon using flawed and failed UN IPCC computer climate model scenarios while deceptively and dishonestly ignoring more than 100 years of actual NOAA coastal sea level rise tide gauge recorded measurements at numerous California locations that demonstrate the rate of coastal sea level rise remains consistent with past periods and is not increasing despite decades of failed climate alarmist assertions otherwise.
This absurd political guessing game of the states future coastal sea level rise is illustrated below from the 3 successive Register articles starting with the most recent as noted above.
“The Ocean Protection Council, which provides sea-level rise projections for other agencies to plan by, has set benchmark targets to prepare for 6 feet of rise by 2050 and 7 feet by 2100.” (Register E-Edition article as published September 25, 2021)
“The Ocean Protection Council, which provides sea-level rise projections for other agencies to plan by, has set benchmark targets to prepare for 3.5 feet of rise by 2050.” (Register website article version of the same September 25,2021 article noted above)
“The state’s Ocean Protective Council, whose predictions about sea-level rise are used by the commission, last year updated its recommendations, calling for state to get ready for 3.5 feet of sea-level rise by 2050. A number of cities had been using — and some continue to use — a benchmark of 6 feet to 7 feet of rise by 2100, although that standard has been criticized for being too extreme because it has been given only 1 in 200 chance of occurring by the council.”
“The new Coastal Commission proposal, however, uses the even more extreme planning benchmark of 10 feet of rise by 2100, an “extreme high risk” projection that’s considered such a long-shot that Ocean Protective Council doesn’t offer odds of it happening.” (Register article of August 27, 2021)
All the state’s games with coastal sea level rise numbers are supposedly supported by “probability distribution” assessments which attempt to convey some degree of scientific certainty with these guesses.
The real picture however is that these “probability distributions” are nothing but subjective assessments as determined by the “experts” paid by the state that are doing the analysis using their “expert elicitation” as noted in the reference contained in the state’s reports.
“Expert elicitation” is defined as being “The elicitation of scientific and technical judgments from experts, in the form of subjective probability distributions, can be a valuable addition to other forms of evidence in support of public policy decision making.”
The various state reports that supposedly address the state’s sea level rise issues are completely devoid of assessments of actual long time period NOAA tide gauge data measurements which clearly demonstrate that at numerous locations the rate of California’s coastal sea level rise is consistent with and not increasing over the last century and that the measured rates of increase are far below the alarmist politically driven guesswork schemes presented in the state’s reports.
For example the NOAA data for the 97 year long coastal sea level rise trend at Los Angeles of about 4 inches per century (not 3.5 feet in less than 30 years) is shown below.

The state’s “lower estimate” of 3.5 feet of sea level rise by year 2050 is 26 times greater than the average rate of California’s coastal sea level rise documented by the longest time period actual NOAA coastal tide gauge measured data.
This ludicrous rate of coastal sea level rise is 26 times greater than the average rate of coastal sea level rise that has been measured by NOAA tide gauge data at numerous coastal locations including 7 locations (San Diego, La Jolla, Los Angeles, Santa Monica, Port San Luis, Alameda and San Francisco) with between 75 to 123 years of continuous NOAA tide gauge coastal sea level rise data which shows these locations will average only 1.6 inches of coastal sea level rise in the next 30 years – not 3.5 feet!!
The state’s “higher estimate” of 6 feet of sea level rise by year 2050 is 54 times greater than measured NOAA tide gauge data measurements.
NOAA tide gauge data updated through year 2020 (more than three decades after the Democrats infamous climate alarmist 1988 Senate hearings where Democrats claimed coastal sea level rise could increase by 4 feet in the next 40 years) estimates that the global absolute rate of sea level rise is about 0.7 inches per decade (between 1.7 to 1.8 mm/yr. amounting to 2.8 inches over 40 years versus the flawed 4 feet hyped by Democrats in the 1988 climate alarmist hearings) far below the absurd coastal sea level rise claims being made by California’s climate alarmist hyped process.
Many of the higher California estimates of future coastal sea level rise are based upon the UN IPCC high emission RCP 8.5 climate model scenario.
The UN IPCC high carbon emission scenario RCP 8.5 has been challenged numerous times including by former chief scientist for Obama’s Energy Department Steven Koonin for positing completely ridiculous and implausible assumptions of increases in coal use a century from now which is just one of dozens of assumptions thrown into these scenarios.
All UN IPCC climate scenarios utilized by the state in assessing coastal sea level rise have no probabilities associated with their scenarios and should be considered as being only “plausible and illustrative.”
These speculative climate model driven scenarios are inappropriate for establishing California’s government policy that commit trillions of dollars in mandated coastal sea level rise actions based upon nothing but politically driven climate alarmist guesswork that deliberately and systematically ignores NOAA measured California coastal sea level rise data.
If at first you don’t succeed (to scare) just make it up.
I wonder how many of these Council/Commission members are not Democrats?
One thing’s for sure CG, they’ve all been counseled by committed liberals.
Infiltration (of institutions) has been going on for quite a long time.
Nearly, nearly…one
It’s the same old M/O, Keep It Simply Stupid And Sufficiently Scary (KISSASS)
Scaring is probably low on the list of desired outcomes. Establishing justification for extensive property grabs is the more likely impetus.
They tried this junk in Australia with a few coastal councils trying to do the same. It all ended in court and with most States making sea level rise protection from councils invalid. You can now only make planning on the situation here and now any future predictions can only be given as advice to purchasers or planning consideration.
It might be educational to add these values into the graphic you posted. . just to show how absurd these numbers are.
That would be an interesting shape on the graph.
Probably shaped something like a hockey stick!
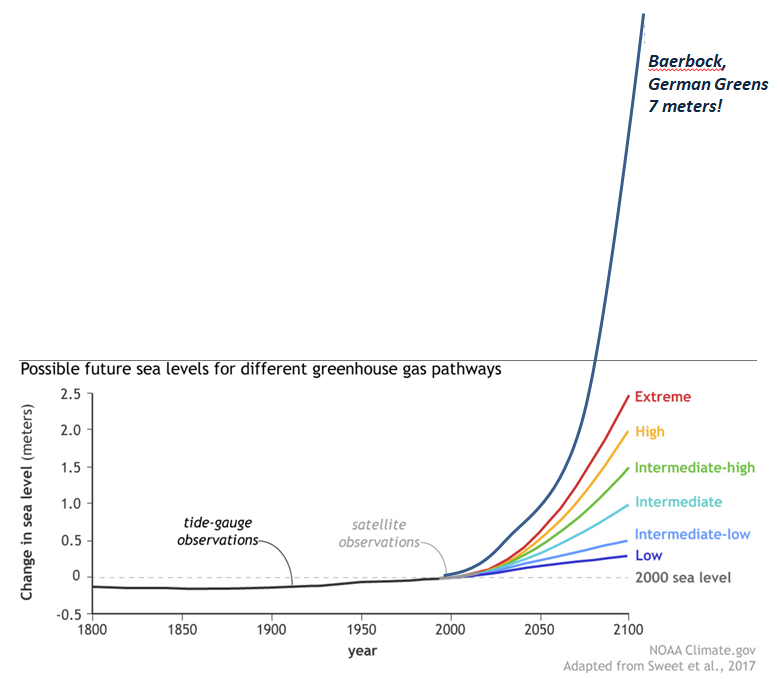
That is what Pierre Gosselin @ No Tricks Zone did with an recent absurd sea level claim by a German Green Party politician:
Measure the speed of the Earth’s rotation.
( This method first postulated by Professor Nils-Axel Mӧrner, Ph.D., Emeritus Professor of Paleogeophysics & Geodynamics, Stockholm University, Sweden )
If all the land borne and floating ice was to melt, sea levels would rise by 60-70m depending on which estimates you use. This motion of mass from the relatively slow speed polar regions to a more even distribution biased towards the oblate equatorial regions requires the Earth to slow down in order to conserve its angular momentum – a straightforward law of physics.
This is much like a spinning figure skater raising her arms outwards to decrease her rate of spin.
The raised sea level (or rather the redistributed polar region ice mass) would cause the Earth to slow down increasing the length of the day.
This is slightly offset by an increase in speed required to offset the motion of mass from a higher to a lower elevation. Ice sublimating from Kilimanjaro would speed up the Earth’s rotation. The amount of high level – near equatorial ice is so negligible that this can be safely ignored.
The sub-sea landslip that caused the Eastern Tsunami in 2011 shortened the Earth day by 2.68 millionths of a second (the mass moved lower and the Earth sped up). This may not seem like much especially since the Earth slows down naturally by about 15 millionths of a second per year. However this does show how accurately we are capable of measuring this variable.
It has been calculated that a melt of sufficient land borne ice resulting in a 20m sea level rise would lengthen the Earth day by 0.67 seconds.
http://www.uwgb.edu/DutchS/PSEUDOSC/IceCaps.HTM
However alarmists are stating that sea levels have risen 100mm in the last decade alone (based on biased data-set selection yet again) – this would have lengthened the day by about 3 thousandths of a second – it just simply hasn’t happened.
From the above calculations it should also be obvious that had the sea risen 100mm ALL the floating ice would be melted – again it simply hasn’t happened. (Where else would all that water have come from ? The floating ice would be the first to melt.)
Sea levels estimated from the sidereal (star time = astronomical time) rotation of the earth show slight sea level rises up to about 1978 thereafter no discernible increase in trend.
Sea levels have been rising slowly since we started emerging from the last ice age (which we are not yet out of), no reasonable interpretation of the data can bring us anywhere near to the alarmist predictions.
Refer to the following link to a 2019 study of the world’s most reliable tide gauges with records of more than 100 years.
https://notrickszone.com/2019/06/20/worlds-76-best-tide-gauges-100-years-of-data-show-a-mean-0-34-mm-yr-rise-negligible-acceleration/
It finds that seas are rising at about 35mm per century and the rate of acceleration due to warming is a negligible 0.007mm per year2.
35mm/century ?????
35 cm/century is closer to what we can expect as the average rate to 2100.
The California Coastal Commission has long been staffed with BANANA environmentalists, who oppose the hoi polloi contaminating the coast with their persons.
So pulling sea level rise estimates from their nether regions would not faze them. These are the type of yahoo’s who mandate the posting of no parking signs at every turnout on US 1, to keep peasant scum from fouling their beaches (along with fining tourists, which some locals like to indulge in).
They didn’t pull this out of their butts,they simply recycled Hansens nonsense from 1988 that Manhattan and Maledives(Womanhattan and Femaledives in woke speak) will drown by 2018.
And Hansen himself recycled most of his fearporns from the ice age scare (It’ s exactly the same script except that the villain is not a white cool guy but a hot black lady)
There’s an easy and very fair way to stop such predictions.
If the experts are off by more than 95% than they and their family members shall be executed.
As this is a very communist way of dealing with things (except that commies will kill you for 1% being wrong if you are not on their side)
these guys wont mind accepting the deal.
My prediction for 2050.
The man made sea buildings that are located on opposite sides of the planet Fort Denison/Australia and Bishops Rock England will have the same sea level as they have now(+ /- 4-5 inches as result of natural fluctuations )
no need for executions. Pulling their grants would suffice.
How did a society forget that the value of a prediction is directly related to the accountability of the person making it?
I’ve made quite a few predictions over a career; not being Michael de Guzman (Bre-X for the non-geologists) I’ve been held accountable for every one of them. Pretty easy for me to predict you will find a 200 gm/tonne gold orebody in 2050; pay me.
Hey, if you pay me double I’ll even make a prediction that you’ll find 400 gm/tonne in 2100!
Predictions with zero accountability are the bastion of astrology and psychics; if you believe in climate predicters but not psychics–why? There’s a mental disconnect between believing one but not the other, and you’ll have to come to terms with it.
I’ll make a prediction for which I will stand accountable–any society that puts Gretards on pedestals and worships them is going to make some really, REALLY stupid mistakes. (My hat’s off to the inventor of ‘Gretard’; I read it in a comment under a recent post here.)
Good comments, Len, and I lived through the Bre-X scandal, am acquainted with Doug Leishman who stood up at a presentation and said there needed to be an independant audit of the claimed resource, and the NI-43-101 rules put in place in the aftermath. There now exists an audit process that minimizes scams in the Resource business, for those companies selling stock anyway. Us geologists get a Reality Check as soon as the assays arrive from the drill hole we designed and monitored. The politicians selling the CAGW redistribution of wealth scheme are banded together and do not allow any fact-checking, and are producing the greatest scam “scientists” have ever perpetrated. Follow the money.
I happened to be doing exactly the same job in the West Kootenays as De Guzman was doing in Indonesia, at the same time–but doing it honestly. There was little gold in that property then and still isn’t, and I wasn’t liked much by the client for telling them so. But de Guzman is/was(?) rich and I’m not; in addition he was BMOC right up until the last. Bre-X–Dead Man’s Story by Lenarciak is an excellent read.
That’s why don’t make predictions anymore. PROJECTIONs is what you get these days.
A relative owns a couple acres of ocean cliff across from the Polo grounds in Santa Barbara. When the time came to build in the early 1980s the Coastal Commission used a fuzzy aerial photo from the 1920s to determine they needed to build 80-85 feet back from the edge to allow 100 years of erosion. In the ensuing 4 decades? A few inches. The century old trees holding the edge still harbor monarch butterfies on their annual migrations and far richer neighbors have corrupted the Coastal Commission such that they build out over the edge. Century old pictures of Moro Bay and the rock show no rise. Sea level rise is not about safety or environment.
The history of Capistrano Beach (pictured above) is also interesting. From Wiki:
“Development of Capistrano Beach started in 1925 with residential homes on the bluff. The Capistrano Beach Club was built along the shore of the new development. In 1929, the Petroleum Securities Company (owned by Edward L. Doheny) became the new owners of the Capistrano Beach development. In 1931, following the death of Doheny’s son, he donated over 40 acres (16 ha) to the state for Doheny State Beach. Capistrano Beach became part of the city of Dana Point in 1989.
During the excavation of the land during development, the bones of a mastodon (or possibly a mammoth) were discovered in 2016.
The 1,180 feet (360 m) wooden pier was popular for strolling, sightseeing, and fishing. The pier was severely damaged by waves in 1964, after which it was condemned and demolished in 1965. The Capistrano Beach Club became rundown and, in the late 1960s, was dismantled.
During storms in 2018, a boardwalk collapsed and an outdoor basketball court was severely damaged after being undermined by erosion caused by the waves. The storm exposed old cars put there decades prior as part of a now corroded sea wall. More Boulders were placed to protect the basketball court that was damaged. The Serra Siding project is proposed along the shoreline that would build 1.2 miles (1.9 km) of additional siding track. The project would create additional train capacity along this busy corridor.”
Aaaaah! History AND science! Thank you, Scissor, for the fun facts!
The figures are certainly absurd but it is still not a good idea to let people build right up to the edge of a cliff overlooking the Pacific Ocean. The Pacific is not that pacific.
And, the Henry Dolger development in Daly City, south of San Francisco, documents that all too well. Loading the cliffs with structures and roads, and concentrating runoff from the surface with increased impervious area, resulted in slumps at the cliff face and the loss of dozens of homes.
It is the cliffs that are unstable, not the ocean. Erosion is a bad problem all along the coastal bluffs of Southern Califonia.
50 years ago I liked to go to the Sea Lion restaurant with my family because it was built right at the edge of the ocean with nothing but a breakwater made of large boulders to keep the waves back by 5 to 10 yards. The best was when the foam from a large wave would spray onto the windows. That restaurant is still there but now is called Duke’s. Nothing about the beaches is noticeably different from 50 years ago. You can see many of our beaches in movies from even longer ago and they always look the same. Yes, the Sea Lion had the windows breached a few times during particularly bad storms, but it wasn’t from global warming, and it still survives.
Hoyt,
I used to pop over the hill to the Crow’s Nest, on the beach near Santa Cruz Yacht Harbor. It’s been in the same location for over 50 years, and probably will be for another fifty!
I’d love to dine there again, watching the waves breaking a few yards away; but I don’t think I’d want to pay the exorbitant Commifornia prices, or spend the time required to remove all the weapons from my car to become CA compliant!
Looking forward to the day I can sell my 2 bedroom house for a cool million and get out of CA for good. No sarcasm at all.
I remember both the Sea Lion… and the excitement of watching the waves break, and spray into the restaurant. Later in my life, I worked as a Firefighter along the coast in Malibu. Now, I occasionally drive past on our way to the central coast. I can’t see any noticeable difference in Malibu’s coastline over the last 70 years… so what am I missing…
Wade Crowfoot is the current California secretary for natural resources. He was appointed to the position by Governor Gavin Newsom (D) on January 11, 2019.[1]
Biography
Eleni Kounalakis Lieutenant Governor of California
Jared Blumenfeld was appointed California Secretary for Environmental Protection by Governor Gavin Newsom in January 2019. As Secretary, Jared oversees the state’s efforts to fight climate change, protect air and water quality, regulate pesticides and toxic substances, achieve the state’s recycling and waste reduction goals, and advance environmental justice. As a member of the Governor’s cabinet, he advises the Governor on environmental policy.
Ben Allen (Democratic Party) is a member of the California State Senate, representing District 26. He assumed office on December 1, 2014. His current term ends on December 4, 2022.
Assemblymember Mark Stone (D-Monterey Bay)
“Public” member: Dr. Michael S. Brown has worked at the cutting edge of sustainability for over 3 decades, leading trailblazing efforts for industry, government, and NGOs.
“Public” member: Jordan Diamond is the Executive Director of the Center for Law, Energy, and the Environment (CLEE) at the UC Berkeley School of Law.
How can so much disinformation be disseminated so freely in Kalifornistan lately?
Follow the money.
This is so crazy that even crazy Griff won’t come around to defend it.
SxyxS, you spoke too soon.
Damn it.
This guy is so radical that he has no shame to undermine my lowest expectations.
Yes Virginia, we are being systematically lied to. What else is new under the sun?
The Truth shall set you free, and that is why they cannot tell you the Truth….
In NZ an earlier generation of legislators had the good sense to say regulatory response to coastal hazards had to take into account of advice on the “likely” effects of climate change.
However to date this hasn’t stopped mad hand waving up to the extremes of RCP8.5 by our local governments following on from worst of the probabilistic forecasters, notwithstanding what Riahi et al originally had to say about all this.
However a problem is now emerging for the extremists with AR6 WG1 injecting some good sense into all this acknowledging that the likelihood of SSP3-7.0 and SSP5-8.5 is low, if not implausible. Regulators are having to pull back from their ambitious plans to unnecessarily close down large areas of NZ coast line.
Thanks to Zeke Hausfather who looks as though he and others led to this refocusing on what really matters when managing coastal risks. Give that man a beer.
I agree that the RCP8.5 extreme forecasts are ridiculous, but I also have a fair bit of sympathy for public officials making these decisions.
The baying hounds of #whoknew-dom look for any kind of sign that people did not act with the power of hindsight. Why open yourself to exposure of public “environmental defender” suits which you have to defend out of your own pocket?
Bureaucrats are people not know for a large willingness to take risks. What decision would someone with that mindset default to, especially when making a conservative decision carries no risk.
The saving grace here (and I suspect elsewhere) is any planning rules are matters that can be tested in Court, and that process will focus on the legal provisions (and set precedents for subsequent decisions). If the legislation says “likely” and a UN body of experts sets a line in the sand (as it were), and the progressive nature of the risk, the options that creates and the costs of exaggeration are made clear, Judges will simply follow the law.
I first became aware of sea level when I fished off the PCH bridge in Playa Del Rey, CA in 1958. Hasn’t changed that I’ve noticed since.
And the other side of the Pacific agrees with you. The latest MSL measurement in Sydney Harbour [Aug 2021] is about 4 inches [93mm] lower than the first one in May 1914.
Sea level rise in the biggest ocean in the world is steady and almost nothing:
http://www.bom.gov.au/ntc/IDO70000/IDO70000_60370_SLD.shtml
Really want to say that there was more sea level fall between May 1914 and June 1914 then May 1914 and August 2021?
Maybe seasonal variation on a monthly basis is bigger than anything long term? Looks like there is a lose trend which has sea level rising from Jan to about May, then falls again to the end of the year.
Long term trend according to NOAA is a very slight increase in sea level over a long data set.
Sea Level Trends – Sydney, Fort Denison 1 & 2, Australia – NOAA Tides & Currents
The predictions are far enough in the future that they will be long forgotten when they fail to come true.
California proposes new Bill to address SLR Planning and Adaption
https://www.latimes.com/environment/story/2021-08-20/california-lawmakers-have-big-ideas-for-sea-level-rise
$100,000,000 proposed per year to fix a “problem”.
Sooner or later a coastal county will need to give an explicit SLR height for both design of sea walls and permits for new houses.
It wont be 2mm/yr.
A factor of 50? Well that’s close. 🙂
Actually Los Angeles has one of the lower rates of sea level rise. 2 mm per year would probably be closer to the average for costal cities in California. Link
No need to cherry pick. Its still a huge difference between the alarmists and reality
California S.B. 83 section 30976 (b) says “Current projections indicate California’s coast will experience a sea level rise of one-half of one foot by 2030, two feet by 2050, and seven feet by 2100. A higher sea level exacerbates the threats of coastal erosion, storm surge, and flood damage along California’s coastline and will very likely result in saltwater intrusion that will threaten drinking water supplies.”
I’m having a hard time figuring out how they think 7 feet by 2100 can be classified as a “will experience” certainty. If I’m reading IPCC AR6 right they show only a 2.5% chance of that occurring even for the unlikely SSP5-8.5 scenario.
https://www.newportbeachca.gov/government/departments/community-development/planning-division/current-projects-and-cases/sea-level-rise-vulnerability-assessment
The above assessment from Newport Beach in LA basically goes into detail how a 0.8 foot increase by 2030 causes FA damage.
Alarmists need something scary, but whenever a county looks at details, a small SLR is not scary
Aaaaack!! He said Newport Beach in LA!? That’s like saying La Jolla is San Diego!
Hell, it’s even a different county! Orange County used to be a bastion of conservatism before the DemoKKKrat Socialists used their ballot harvesting system to turn it blue!
I used to live on Newport Harbor and take my constitutionals on Balboa Island. Downtown LA was only a two-hour, thirty mile drive away!
AM
Sorry for the inaccuracies.
But from an international point of view, LA is huge and includes Newport Beach.
Here are in Melbourne Australia the coastal suburbs of Rosebud and Point Cook (110km apart) are both supposedly impacted by SLR.
An American would consider both theses suburbs part of Melbourne.
since SLR is the only verifiable metric of climate change and it is constantly blatantly lied about I think that is where we should make the most public outcry .
Have they any plans if a tsunami hits the shore of California?
Yes. They say you should run uphill. How far uphill, they never say.
Accept all greentards who should stop where they are and protest.
“The Coast” of California is 770 miles long and intercepts thousands of earthquake faults, all of which are capable up upthrusting the land, as noted by the existence of the Coastal range, which runs its entire length.
Major earthquakes happen about once a century where coastal areas can rise by a foot or more as has been previously documented in the literature.
Yet no mention of these known phenomena that affect sea level by the noted “Experts”.
Obviously the strength of the gravity at the coast of California is rapidly rising and this is causing the sea water to locally mound up there. It must be due to all those subsurface rocks piling up at the fault line as the crustal tension builds towards the next Californian mega-earthquake. /sarc
Philip,
Wouldn’t increased gravity along the Commifornia coast cause the sea water to flow away?
I’m sure that there is something to your claim, as the increased density of the local inhabitants has been noted by many observers; but I think you may have switched a sign somewhere in your SLR calculations!
Does anyone else, like me, still think ‘camera’ when you see that acronym?
Show us your hockey stick and mine will beat it.
The graph looks more like a change from flacid to another state.
Baerbock seems to have a c..ck bigger than Berlusconi (rumoured).
The trend seams to be stable in Los Angeles.
But with a longer record as in San Francisco You will find periodicity:
https://tidesandcurrents.noaa.gov/sltrends/sltrends_station.shtml?plot=50yr&id=9414290
With higher sea level rise in the beginning of the series
dishonestly ignoring more than 100 years of actual NOAA coastal sea level rise tide gauge recorded measurements
what is it it says in the small print on investment ads? ‘Past performance is no guide to future results’ or some such?
If, as seems certain, sea level rise is accelerating, then we will see more sea level rise than 100 years ago, increasingly, as we go forward.
That is totally non sequitur … even for you that is full special needs and probably qualifies you for mental handicap payments.
If you referring to data obtained from satellite SLR measurements, can you explain how these satellites, travelling overhead at around 1350 kms above an ocean that has lots of lumps and holes, could ever measure SLR to fractions of a mm. And where I live, the SLR increase, measured by a long-term tide gauge, is 1.7mm/year over the last century, and is NOT increasing its rate.
“If, as seems certain …”
Good, griff! A very clear statement of faith. A very clear refusal of considering a scientific approach to understanding nature.
JM,
The griffter seems to be becoming a parody of itself! Kind of a griffter^2!
Now that’s a scary thought!
Hi Griff
You have not answered my previous post, so here it is again. Indeed I might post it after each of your comments until you do reply…………………………….
“I can see that you are fond of deferring to ‘authority’, obviously this saves you the trouble of doing some logical thinking for yourself.
Let’s just review the situation, CO2 has been increasing and temperatures have been rising, there is a recognised mechanism for this, the Greenhouse Effect. I accept that, all other things being equal, a rise in CO2 leads to higher radiative forcing on the Earth and therefore higher temperatures.
However, this depends on ‘all other things being equal’. So have they been? A pretty key question don’t you think?
What is the main component of the Greenhouse Effect? Well that is overwhelmingly water vapour. CO2 is only a minor player compared to this.
So you would think any scientist worth his salt would have looked at trends in atmospheric water vapour over the so called problem period. I think that would be hard to disagree with, what do you think?
Well if you bother to look at such a thing some scientists have looked at it. Also and this is right up your deferring to authority strasse, it is the World Metrological Organisation, through their Global Atmosphere Watch programme.
Mind you, it seems very few other scientists have been minded to look at atmospheric water vapour, probably because of this statement in the report.
…………………….
“It is impossible for us to control directly the amount of water vapour in the atmosphere since water is found everywhere on our planet – it covers 71% of Earth’s surface.”
……………………………………..
Not much money to be made studying something we have no control over is there?
So what did they find has been happening to water vapour over the so called problem period?
………………………………
“Research has found that a 10% decrease in stratospheric water vapour between 2000 and 2009 acted to slow the rate of increase in global surface temperature over this time period”
” More data suggest that stratospheric water vapour probably increased between 1980 and 2000, which would have enhanced the decadal rate of surface warming during the 1990s. These findings show that stratospheric water vapour is an important driver of decadal global surface climate change.”
………………………….
They also say.
………………………………..
“A recent study showed that reanalysis data on high-altitude atmospheric water vapour, critical for the greenhouse effect, are not as accurate as previously thought. Water vapour data for the UTLS region from these reanalysis data sets have been compared to water vapour data from the Microwave Limb Sounder (MLS) on the AURA satellite. These satellite data have not been used in the production of these reanalysis, so they represent an independent data set well suited for validation. The study found that the reanalyses differed quite a lot from the MLS observations, overestimating the annual global mean water vapour in the upper troposphere by about 150%”
…………………………………
Oh dear, what does this mean for the modellers who have been pugging this data into their models?
The report states……..
………………………………
“More accurate data with better geographical coverage is needed. The observed temporal trends in stratospheric water vapour are poorly understood and this demonstrates our lack of understanding of how water vapour enters the stratosphere.”
……………………………………………
Oh dear again! To finally put the cherry on the cake.
……………………………
“The models that are used to predict future climate use reanalysis data to verify that the current climate is modelled correctly. The lack of accurate water vapour data in the important UTLS region will therefore limit the ability of these models to predict future climate.”
…………………………………
Of course the WMO couldn’t help themselves when they said…………
“Research has found that a 10% decrease in stratospheric water vapour between 2000 and 2009 acted to slow the rate of increase in global surface temperature over this time period”
What they should have said is that ‘CO2 rose and water vapour fell and temperatures decreased’.
https://www.woodfortrees.org/plot/uah6/from:2000/to:2009/compress:12/plot/uah6/from:2000/to:2009/trend
Best not to set the sheeple thinking, eh Griff?
So what do you think Griff? (do you think or are you currently going La La La in your head.) Do you think you can put WMO into the sceptical column?
I bet you wish you could claim that atmospheric water vapour and atmospheric CO2 are in lockstep with each other but the report kiboshes that as it states water vapour fell between 2000 and 2009 whilst CO2 continued its upward march, so there is no lockstep relationship between CO2 and water vapour they can alter independently of each other.
So what do you think Griff? Water vapour rose and temperatures increased and CO2 rose at the same time. Water vapour fell and temperatures stabilised or also fell.
Given that water vapour is by far the stronger of the two in the greenhouse effect which would you think was responsible for the vast majority of the temperature rise? Care to give an opinion based on logic not faith?
Now this might involve thinking for yourself, alternatively you can just defer to authority and accept the WMO report, which completely undermines any reliance you can put on the model predictions.
https://public.wmo.int/en/resources/bulletin/observing-water-vapour
Hey Alan we share the same name including spelling, just as well we share similar thoughts 😉
Why does it seem certain.
None of the data supports such a belief.
Griff, using the financial investment warnings in SL rise context implies that SL is NOT certain to rise.
If this is the message you wished to convey here, I thoroughly agree.
an inch or two, 3.5-6 feet. What will terrify kids more?
Not withstanding the number of good reasons to question extreme forecasts, I found this bit quite encouraging:
“A number of cities had been using — and some continue to use — a benchmark of 6 feet to 7 feet of rise by 2100, although that standard has been criticized for being too extreme because it has been given only 1 in 200 chance of occurring by the council.”
It is encouraging to see this being put into a risk framework (risk = probability x impact). Given the potentially large impact of sea level rise it is rationale to at least investigate what actions can be taken to avoid, mitigate, or minimize those impacts.
I don’t necessarily trust city governments to make rational decisions about that, as they may propose spending $100 now to save $10 in 100 years, but it is an improvement over framing the problem as a certainty and requiring by law that every possible action be taken no matter the cost.
I think one of the biggest fallacies in climate adaptation analysis (or rather lack of analysis) is the ubiquitous assumption that current infrastructure is perfectly tuned to the climate of the recent past, and therefore must be changed to accommodate a changing climate. It may be current infrastructure is already under-sized, just right, or even over-built but it seems we never start with that investigation.
Q: “How high should the sea wall be?”
A: “Higher”
When people refuse to accept the lies they just lie louder.
How long before NOAA data is restricted from public access?
If the average sea level rise rate over the past 97 years at Los Angeles has been 1.03 mm/yr, one would expect a sea level rise by 2050 of 30.9 mm, or about 1.22 inches.
A projected sea-level rise of 3.5 feet (=1,067 mm) by 2050 would require an average sea level rise rate of 35.6 mm/yr, or about 34.5 times the average sea level rise rate over the past 97 years.
But the sea level rise rate won’t abruptly increase by 34 times in one year, then remain constant at the higher rate for 30 years. If we assumed a constant acceleration “a” of sea level rise, then the total rise over t tears would be y = 0.5at^2. If we set y = 1,067 mm and t = 30 years, the acceleration rate would be 2.37 mm/yr^2.
This would still require the sea level rise rate to more than triple in the first year, and the sea level rise rate by 2050 (t = 30) would be 71.1 mm/yr, or 69 times the current sea level rise rate.
As Isaac Newton wrote, acceleration of anything must be caused by an unbalanced force. What “force” would suddenly cause the sea level rise rate to accelerate at such a rapid rate over the next 30 years, when those same forces caused NO acceleration over the past 97 years? Where will this huge magical force come from? Increasing the CO2 level from 410 ppm to 500 ppm, when the prior increase from 280 ppm to 410 ppm caused no acceleration?
Can the California sea level alarmists please come up with an explanation for this using physics? (Probably not!!!)
“California “propagandists” hype sea level rise by 2050 50+ times greater than actual data shows.”
#FixedIt
Great, so the Californians are now focused on climate change and water elevation instead of upon earthquakes. The only one of the three likely to harm a lot of people is earthquakes, but we ignore those now. California will not need to do anything about sea level rise when the next big earthquake raises the surrounding land area by a few feet. I imagine climate change won’t seem so important either.
Their answer will be to raise taxes and hire more experts to study climate change impacts 100 years away (actually never going to happen given the impacts they keep reporting).
Who is going to lose out if the sea does rise 10 ft?
Barbara Streisand, Al Gore, Robert Redford. Hey, the heck with them.
The poor people have to live inland anyway, far away from the cooling ocean breezes.
I hope the ocean rises and wipes out Malibu.