SKOLKOVO INSTITUTE OF SCIENCE AND TECHNOLOGY (SKOLTECH)

Scientists from the University of Graz, Kanzelhöhe Observatory, Skoltech, and the World Data Center SILSO at the Royal Observatory of Belgium, have presented the Catalogue of Hemispheric Sunspot Numbers. It will enable more accurate predictions of the solar cycle and space weather, which can affect human-made infrastructure both on Earth and in orbit. The study came out in the Astronomy & Astrophysics journal, and the catalogue is available from SILSO — the World Data Center for the production, preservation, and dissemination of the international sunspot number.
Our Sun is a big boiling ball of gas, most of which is so hot that electrons are ripped off from atoms, creating a circulating mix of charged particles, called plasma. These moving charges endow the Sun with an enormous magnetic field, which bundles up as it rises from the solar interior and creates dark areas known as sunspots on the surface.
Sunspots are the primary sources of solar flares and coronal mass ejections, or CMEs. These are huge magnetic clouds of plasma released from the Sun at great speeds. When directed toward the Earth, they cause powerful magnetic disturbances that can damage the equipment on satellites, incapacitate telecommunications, and even cause blackouts in a city — with devastating effects on the economy.
The appearance and disappearance of sunspots varies according to a roughly 11-year cycle. It begins with almost no sunspots. As it progresses, more and more spots emerge on the middle latitudes and migrate to the solar equator. Since the Sun’s equator rotates faster than the poles, its magnetic field becomes entangled and strengthened in bundles over the course of the cycle. Eventually, the field line bundles become strong enough to get pushed out through the photosphere as loops that trap and eject plasma as CMEs.
Monitoring sunspots is therefore crucial for predicting dangerous space weather events and their effects on air travelers, astronauts, and the equipment and infrastructure — both on Earth, in orbit, and on long-term space missions.
Initially observed by Galileo in the 17th century, sunspots are now monitored daily by about 80 observatories across the world. The World Data Center SILSO at the Royal Observatory of Belgium is the global hub for all sunspot data. Systematic data on the total count of sunspots is available starting from the 18th century. However, recent models suggest that solar activity is better understood as an interplay between the activities in the northern and the southern hemispheres considered separately. Such data is much more scarce, with the most important solar activity index — the International Sunspot Number — only recording sunspot counts by hemisphere since 1992.
The authors of the recent study in Astronomy & Astrophysics came up with a method to greatly extend the available data by reconstructing historical hemispheric sunspot numbers. As a result, they released a continuous catalogue of daily and monthly data of the northern and southern hemispheric sunspot numbers going back to 1874. The team showed its high correspondence to the existing hemispheric data and demonstrated that solar cycle predictions are indeed more accurate when the evolution of sunspot numbers is considered separately for the two hemispheres.
“Our Sun is an intriguing star, and its physics is both simple and complicated. We have learned from our study that we can obtain a better understanding of the long-term evolution of the Sun’s activity by simply treating first the two hemispheres separately and only afterwards summing both contributions up to obtain the overall activity. The newly reconstructed data on hemispheric sunspot numbers will be available to the scientific community, and we believe they can provide an important basis to develop new, more accurate prediction schemes of solar activity,” said Astrid Veronig, the lead author of the study, professor at the University of Graz, and head of the Kanzelhöhe Observatory for Solar and Environmental Research.
Skoltech graduate student and study co-author Shantanu Jain highlighted the practical utility of the new catalogue: “We believe that this new catalogue will be essential to accurately predict space weather since we now have continuous hemispheric data for a longer period to make meaningful solar cycle predictions. If we were to face extreme solar eruptions in today’s age of technological dependency, it could easily knock out our power grids, satellite communications, the internet, and cause economic losses of up to trillions of dollars. An accurate prediction of space weather can help prepare ourselves and avoid such a scenario.”
“For permanent technical infrastructures, for long-term issues like ozone depletion or climate, and in view of future long-duration manned space missions to the Moon or Mars, there is a growing need for mid- and long-term forecasts of the trend of solar activity over the next few months or years. As part of an emerging discipline called ‘space climate,’ such long-term predictions of the strength of the solar cycle can only rest on a detailed knowledge of the actual evolution of many past solar cycles. Our new extended data series is one of the key steps in the growing efforts to revisit and fully exploit legacy data collections using the modern tools of the 21st century,” study co-author and the head of the World Data Center SILSO Frédéric Clette commented.
“Currently, we still do not fully understand how the solar dynamo works and how the solar magnetic field is generated during the 11-year solar cycle. All the planets of our solar system orbit around the Sun in a so-called ecliptic plane. It means that observatories on Earth or instruments on board any Earth-orbiting satellite which make images of the Sun never really see what happens on the solar poles. However, in February 2020 a groundbreaking space mission — the Solar Orbiter — was launched to fly very close to the Sun. It will perform gravitational maneuvers to reach out of the ecliptic and glimpse at the poles for the first time in history. The first polar pass is expected to take place in March 2025 with the spacecraft reaching an inclination of 17 degrees above the ecliptic plane and increasing to 33 degrees in July 2029. We think that the newly developed product of hemispheric sunspot numbers together with the unprecedented observations and fundamentally new knowledge from the Solar Orbiter will help us to advance solar cycle studies and space weather predictions. And whatever storms may rage, we wish everyone good weather in space,” said Tatiana Podladchikova, a co-author of the paper and assistant professor at the Skoltech Space Center.
###
Video:
“Monitoring sunspots is therefore crucial…”
Because abcd.
But Loydo my man, are you not concerned about the effects on your catastrophic weather fear porn?
Ah! I see! Allowing people to discuss sunspots may cause them to think the sun is more important for our climate than CO2.
Can’t have that, can we, Loydo?
Loydo says sunspots are fake news….
If you want to follow along….
https://wwwbis.sidc.be/silso/eisnplot
https://solarmonitor.org/
https://www.sws.bom.gov.au/Solar/1/6
http://sunspotwatch.com/
Tracking down the new catalog…
In this cycle, the large spike in nov2020 corresponded to the sat/jup/Sun conjuction. Coincidences…..????
Most likely, yes. How many spikes happen when there is no conjunction?
Here is link on site
https://wwwbis.sidc.be/silso/extheminum
Have not down loaded data yet
Placed previous post with a bunch of links to track Sun cycle activity. Hung up in moderation. Probably to many links in one post. Will repost if it does not come out of moderation
(Please be patient) SUNMOD
Reference article:
“Hemispheric sunspot numbers 1874–2020“,
Astrid M. Veronig, , Shantanu Jain , Tatiana Podladchikova , Werner Pötzi , and Frederic Clette
https://arxiv.org/pdf/2107.00553.pdf [July 2021]
60 years of no correlation, must be something else.
https://climate.nasa.gov/internal_resources/2165/
1) NASA’s bogus TSI plot is based on faulty models.
2) NASA GISS temperature record is a continually altered dataset.
3) The Sun controls the climate, absolutely:
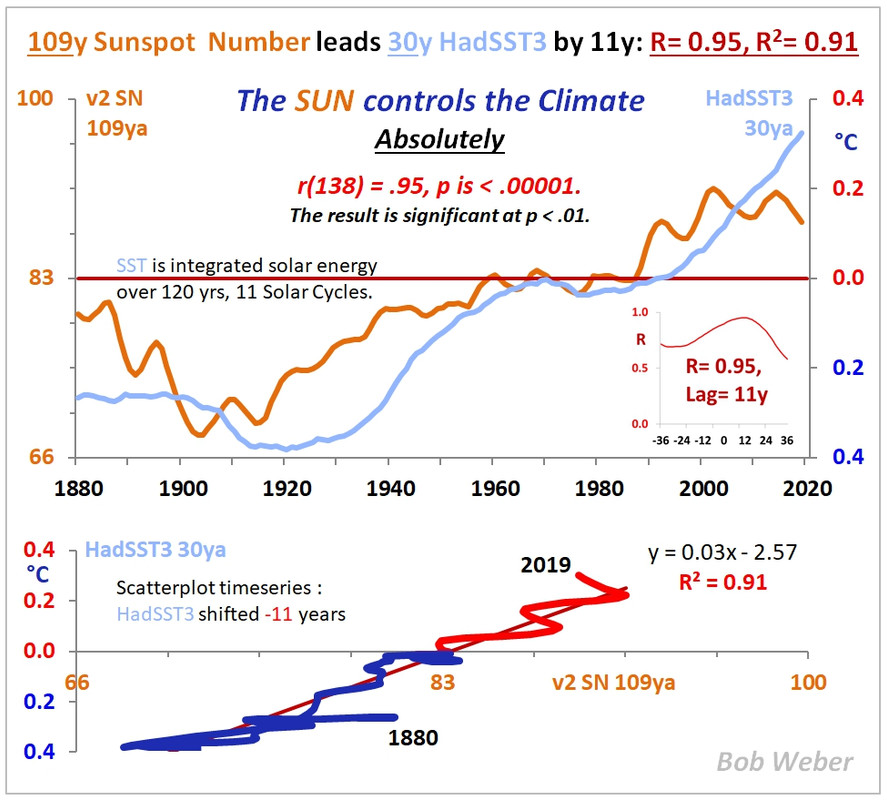
Thank you Bob Weber for posting this information. After I saw the NASA artwork in a previous post I was almost ready to concede that climate change is responsible for reduced solar output.
Joe
The sun is the driver and the oceans the primary modulator.
Rah:
No, the sun is the driver and interfering volcanic and industrial SO2 aerosols in the atmosphere are the modulator.
What dataset are you using for the sunspot number?
The 109y average SN was computed from monthly v2 SN:
https://wwwbis.sidc.be/silso/DATA/SN_m_tot_V2.0.txt
Got it. What would the graph look like if you did a 30yr average to match the HadSST timeseries or change them both 10yr averages?
GUESSTEMP – diminishing the past to ensure a positive future.
NASA caught “adjusting” Global Temperature Graph (again!)
https://electroverse.net/nasa-caught-adjusting-global-temperature-graph/
I’m not sure why there is a focus on 2016 here. GISTEMP reprocess every year and every month every time it runs. All values will change some with each update. Most of the time the changes can only be seen at 3rd or 4th decimal place, but occasionally it will happen at the 2nd decimal place especially when the value is close to a rounding threshold like what is in play with 2016. You can modify the gio.py source code file to display more digits if you like. You may have noticed that 1902 bumped up a tick, but there are many other changes aside from 2016. Note that the only adjustment the GISTEMP code does is in step 2 where it corrects for UHI which turns out to be insignificant. You can actually disable this entire step if you run the code on your own machine. The adjustments you are seeing on a month-to-month basis are due to the upload of observations that are months, years, and even decades old. There are still record digitization projects ongoing so expect more changes even for months/years 100 years ago like what happened with 1902 recently.
“You may have noticed that 1902 bumped up a tick”
That’s just ridiculous. The Data Manipulators have the temperature profile undulating like a snake every month with their computer adjustments. 1902 had one recorded temperature. The Data Manipulators should leave it alone.
The temperature profile undulates like a snake?
1902 had one recorded temperature?
GHCN should not allow uploads of observations?
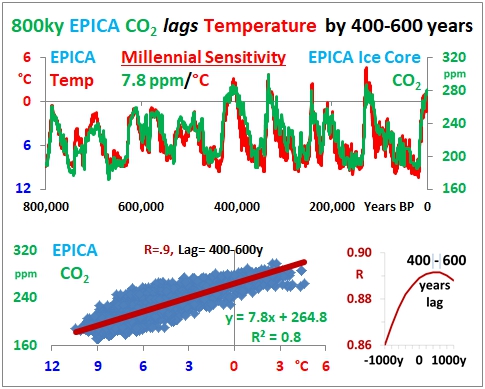
Hundreds of thousands of years with no correlation between CO2 and temperature hasn’t stopped you.
Hi Mark, there actually is a significant lagged correlation for CO2 wrt temperature which I’m sure you were aware of, but it’s still not in Loydo’s favor:
What would your graph look like if you switched to the northern hemisphere?
Here’s a plot where you can see the same general pattern (note this time axis is switched):

I’ll make my own plots for Vostok to complement EPICA.
Vostok and EPICA should be similar since they are in the same hemisphere. What does the northern hemisphere look like?
Renee Hannon’s plot for Greenland over 50ky w/similar pattern:

Which indicates Antarctica CO2 (blue) has much less variability.
The variability is probably due to differences in the way CO2 appears in the cores. CO2 is well-mixed gas so it probably won’t vary by more 10 ppm or so between NH and SH at least on decadal and longer time scales.
There is also going to be difference in the lag time between NH and SH due to the see-sawing of temperatures caused by ocean current changes like the AMOC. That was my primary point. The comparisons are CO2-to-NHtemp, CO2-to-SHtemp, and CO2-to-GLOBtemp. Each one will be characterized by a different lead/lag profile. See Shakun et al. 2012 for details of what I’m talking about.
At any rate, we expect CO2 to primarily (but not always) lag global temperatures during the Quaternary Period because in lieu of large pulsed releases (like from volcanoes, asteroids, humans, etc.) the primary mode of modulation was by the temperature. That does not mean that CO2 does not also modulate the temperature. It does. It just means that something else was the triggering or catalyzing agent for the temperature change first for these glacial cycles. But once the CO2 started changing it too participated in planetary energy imbalances and helped drive the temperature changes further. The best candidate for the triggering or catalyzing agent is orbital perturbations (Milankovitch cycles) with randomly timed volcanic activity, ocean current changes, large flood events, etc. providing a enough of a nudge beyond the orbital forcing to send the climate system over the tipping point.
Well, Mark, if correlation is not causation, lack of correlation must be causation, right?
Changes in circulation (inhibition of latitudinal circulation) caused by very weak solar wind and unusually high galactic radiation will cause weather disasters, both in summer and winter.

Is Germany already warned of another wave of heavy precipitation?
If warned, no idea, but I knew about since some days.
Kachelmann is up to date 😀
imagine, youtube send me a rainweather warning on my phone today. I was surprised, as I didn’t allow to most apps to send whatever infos…
I am currently in Marion, IL. During the solar eclipse of 2017 I happened to be in the center of the band of totality just south of here at the right time. I had my welding helmet in the truck just in case Of such an eventuality as I drove home from a run to Laredo, TX.
People were pulling over to the shoulder of I-57 as it darkened. I pulled off on the shoulder of a ramp to observe. It was awesome. Only the second total I have been able to observe in my life time.
I was at Ga Tech when Atlanta was in the center of an annular eclipse. I was rather disappointed. The sky darkened a bit and that was all. The area I live is going to be just a few miles from the center of the 2024 eclipse. I’m remain hopeful.
Was in Casper and took some pics of the 2017 total.
https://www.amazon.com/photos/shared/bHs4ZfZ7ReWWH6-gmovIHA.U1jDP4eSwLvZ-C_RQtSZzL
Waiting for Leif’s take on this new study.
There is a huge difference between being inside or outside of totality. Make sure for 2024 you are fully within the totality shadow. Even a few miles outside of the shadow will be a disappointment.
An annular eclipse doesn’t come close to the experience of a total eclipse!
I was in La Paz (Baja, Mex.) for an 8-minute total eclipse. As it darkened, the temperature dropped about 1 deg F per minute, dust devils spun up, and roosters started crowing to announce the sun rising all around us. It was like an epic Cecile B. Demille movie of Christ on the Mount.
We had physicists from all over the world coming to Atlanta to study the eclipse. Having a world class physics department, smack dab in the middle of totality was quite an opportunity for them.
Butterfly plots capture and graphically illustrate Sunspot numbers by hemisphere. Been around for 117 years. Maunder plotted them in 1904. give credit where credit due.
Sunspots look like melanomas, so therefore sunspots must cause melanomas.
Where’s my Nobel?
Very nice video. I’m up to Sept. 2013. Wonder if they sell a DVD of it?
I guess I answered my own question. NASA has an mp4 download available. On 57 minutes left.
A Decade of Sun
Music: “Solar Observer” written and produced for this video by Lars Leonhard (https://www.lars-leonhard.de/)
Video credit: NASA’s Goddard Space Flight Center/SDO
Scott Wiessinger (USRA): Lead Producer
Tom Bridgman (GST): Lead Data Visualizer
Mara Johnson-Groh (Wyle Information Systems): Lead Science Writer
Monitoring sunspots is crucial because it’s a sign of climate change/catastrophe.
Talk about CHEMTRAILS and our manufactured weather down here on Earth. And while you are at it talk about how the Sun’s turning to increased sunspot activity promises REAL global warming for the next 30 years.
“The authors … came up with a method to greatly extend the available data by reconstructing historical hemispheric sunspot numbers. As a result, they released a continuous catalogue of daily and monthly data of the northern and southern hemispheric sunspot numbers going back to 1874.“
Am I the only one suspicious about this?
GIGO?
If the backcast is good, why not forecast? Problem of length of next cycle solved!
Sunspots that occur in the current solar cycle show weak magnetic activity (no strong flares).
http://www.solen.info/solar/images/AR_CH_20210720_hres.png
Nice video BUT. If they think there is a 11 yr sunspot cycle why isn’t the video 11 years long, or 12 to be safe?