By Andy May
In the last post, I discussed the problems comparing modern instrumental global or hemispheric average temperatures to the past. Ocean temperature coverage was sparse and of poor quality prior to 2005. Prior to 1950, land (29% of the surface) measurements were also sparse and of poor quality. Only proxy temperatures are available before thermometers were invented, but, again, these are sparse and poorly calibrated prior to 1600. So how can we compare modern temperatures to the distant past? We can’t do it globally or hemispherically, the past data are too poor or too sparse or both. Why not pick the best proxies and compute comparable modern temperatures to compare to the proxies at the specific proxy locations? It is easier to lessen resolution than to increase it.
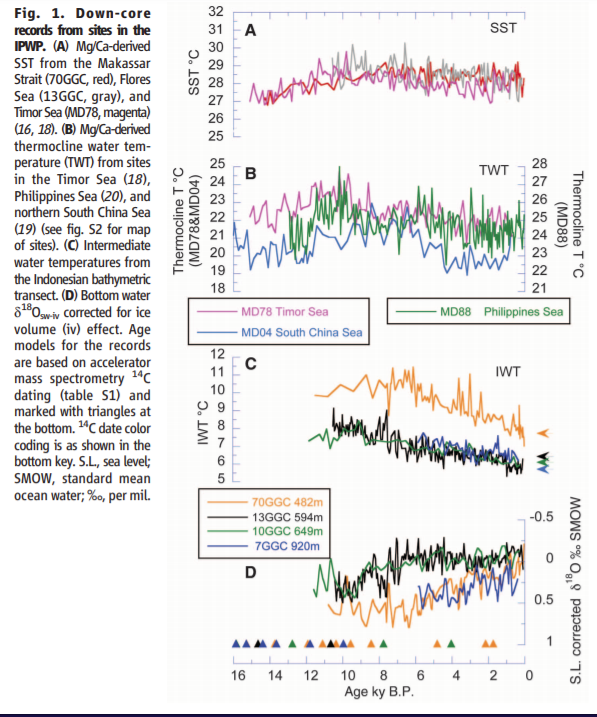
Rosenthal, et al.’s temperature reconstruction, plotted in Figure 1, shows ~500-meter temperatures from the “Indonesian Throughflow” (Rosenthal, Linsley, & Oppo, 2013). Their data are from sediment cores taken in the Makassar Strait east of Borneo Island. This strait is a portion of the main connection between the Indian, Southern and Pacific Oceans. Its temperature is reflective of the temperature of significant portions of these three large water masses at 500 meters.
Rosenthal, et al. used an Mg/Ca (Magnesium/Calcium ratio) proxy from benthic foraminifers to estimate the 500-meter temperatures and they claim a temperature accuracy of ±0.7°C. Dating was done using radiocarbon (14C) and is probably no better than ±50 years. The radiocarbon dating was checked using distinctive volcanic ash layers and lead isotope dates (210Pb).
The fossils and shells studied by Rosenthal and his colleagues are from a bottom-dwelling foraminifer that lives at about 500 meters depth in the strait. Sea level varied over his study period, but he has corrected for this. Five hundred meters is deep enough to be insulated from short-term weather fluctuations on the chaotic surface, but shallow enough to reflect longer-term surface climatic fluctuations. In addition, from the University of Hamburg we have an accurate modern temperature for the period from about 2006-2016, at 500 meters, of about 7.7°C, this modern temperature is identified on the plot with a red box. Rosenthal’s reconstruction only goes back to 7100 BC and has a resolution of 20 years to 30 BC, and 50 years before then.

Figure 1 represents ocean mixed layer and upper deep ocean temperatures in three major oceans. These oceans contain more heat capacity than the entire atmosphere. The reconstruction in Figure 1 illustrates the steady drop in surface temperatures since the Holocene Climatic Optimum, which ended about 6,000 years ago. The period of cooling after the Holocene Climatic Optimum is called the Neoglacial. Figure 1 suggests that the average temperature from 2006-2016 is quite normal, even cool, relative to the past 2,000 or 1,000 years, and before then. This temperature is only applicable to the Makassar Strait, but it is connected to three large oceans.
Several historical events are noted on the plot to show how civilization has been affected, at least in part, by the increasingly cooler temperatures. Historical events are important climatic indicators since they are accurately dated, and often indicate climate changes over large areas. The “Little Ice Age” or LIA, was a very cold and miserable time for humanity. It contributed to the Black Death Plague, the end of the Viking settlements in Greenland, and to the burning and persecution of witches and Jews in Europe, as they were often blamed for the cold weather (Behringer, 2010, pp. 98, 128). This is the “pre-industrial” weather the alarmists want us to return to, and without the benefits of fossil fuels. Welcome to Hell!
The Medieval Warm Period (MWP), The Roman Warm Period (RWP), and the Holocene Climatic Optimum are all warmer in the Makassar Strait than today. The Neoglacial cooling period, after the Climatic Optimum is well defined at this site.
Bo Christiansen and Fredrick Ljungqvist’s reconstruction of the past 2,000 years (Christiansen & Ljungqvist, 2012) is also important. As discussed in the previous post, they avoid spatial regression in their reconstruction to preserve as much climatic variability as possible. Their reconstruction is shown in Figure 2. It is only for the extra-tropical Northern Hemisphere. The red box, plotted at the year 2000, is the average extra-tropical Northern Hemisphere HadCRUT5 average temperature from 1970-2020. In this case it is meant to be compared to Christiansen and Ljungqvist’s 50-year smoothed reconstruction. The HadCRUT5 anomaly has been moved from the HadCRUT5 zero (1961-1990) to the 1880-1960 zero point used by Christiansen and Ljungqvist. “Extra-tropical” includes all HadCRUT5 5°x5° cells from 27.5°N to 87.5°N, ignoring null cells. The average HadCRUT5 cell temperature is area-weighted by latitude.

Just like in Figure 1, we did not try and expand the proxy record to more than it is meant to cover, we reduced HadCRUT5 to the area the proxy record covers. In this case the HadCRUT5 50-year average fits the proxy reconstruction well and is also roughly the same temperature as the MWP. The faint lines in Figure 2 are yearly proxy temperatures, they show much more variability than the 50-year smoothed curve but are not as meaningful as the 50-year average in terms of climate change.
In Figure 2 we show some of the warming and cooling events documented in Soon, et al.’s 2003 papers for the past two millennia (Soon & Baliunas, 2003) and (Soon, Baliunas, & Legates, 2003c). Soon and colleague’s make the important point that climate is a local thing, it does not vary uniformly across the globe. Large scale indicators of climate, such as global glacial advances and retreats, suggest that globally the Medieval Warm Period (MWP) was warmer, and a time of global glacial retreat. The Little Ice Age (LIA) was a period of glacial advance and colder weather. But, looking at detailed records suggests that both warming and cooling existed during both periods, depending upon the location. Most of the world warmed during the MWP, but it cooled significantly around Taylor Dome in Antarctica. The world generally cooled in the LIA, but Switzerland and Antarctica warmed significantly in the decades around 1540AD and 1800AD, respectively. The peaks of these global climate anomalies were reached at different times in different places.
Comparing these reconstructions to Vinther’s 2009 Greenland reconstruction (see the first post, Figure 2, where it is compared to Antarctic temperatures), as we do in Figure 3, illustrates how climate varies by region and by hemisphere. These local variations confound the “global warming” narrative.
Vinther’s reconstruction is built using the average of the Agassiz and Renland ice cores in Greenland, after correcting them for elevation changes. The Agassiz core is not actually from Greenland, but on a neighboring island. Vinther’s paper has a map of the two sites. The central graph in Figure 3 is the Vinther reconstruction in actual degrees C. The red box is the Greenland temperature average from the populated HadCRUT5 5×5 degree cells closest to the Agassiz and Renland sites for 2000-2020. As you can see, it is not very anomalous, relative to the Vinther record. It is lower than the peaks in the MWP, RWP and one to two degrees lower than the Holocene Climatic Optimum.

There are a large number of historical references in the timeline shown in Figure 5 and we will not explain all of them here, they are well documented in earlier posts here and here. We will just make the point that significant local climate changes, the only climate changes that matter to people, are historical events that are often described in detail by the historians of the time and dated precisely. These historical descriptions can be more valuable than biological or ice core proxies. There are three significant Northern Hemisphere or global climate changes that deserve special mention.
Roman Warm Period
The Roman Warm Period (RWP) was a period from roughly 100 BC to 200 AD, depending upon where you are. This was the time when robust civilizations developed in the Americas, around the Mediterranean, China, and India. Ch’in unified China by 200BC and Alexander invaded India just 136 years earlier. The Mayan civilization rose to prominence before 250 AD in present-day Mexico, Guatemala, and Belize. The Roman Warm Period truly marks the beginning of modern civilization, written records document all major events over most of the world since this time. These writings and most recent reconstructions suggest that temperatures, at least in the Northern Hemisphere, were warmer than today.
Medieval Warm Period
The Medieval Warm Period (MWP) is normally given as 800 AD to 1250 AD, but it began and ended at different times in different places. In the beginning of this period, temperatures in Central Greenland rose by about 1.5°C in about 200 years, but they are erratic. It has been well documented as a worldwide event, but is not synchronous. It is uncertain what the global average temperature was during the period and whether the world was warmer then, than now. But, certainly in many areas where we have records, such as Greenland, the UK, and China, temperatures were comparable to today and in many cases warmer. During this period, the Vikings were a dominant force in Europe and in the Middle East.
Little Ice Age
The Little Ice Age (LIA) was not a true ice age, but a cooler period that followed the Medieval Warm Period. It is generally considered to have started by 1350 AD and it ended between 1850 and 1900 AD. The LIA was the coldest period in the Holocene. Northern Hemisphere temperatures dropped from 1°C to 1.5°C on average, but, like the MWP, it was not synchronous around the world. Many areas in the Southern Hemisphere were warmer than normal, especially in Antarctica. It was not cold over the entire period, but the Little Ice Age saw many periods that were very cold, from the famous year without a summer (1816), to the great famine of 1315. New York Harbor completely froze over in 1780, the Norse colonies in Greenland starved and had to be abandoned. A recent study notes several droughts in Europe during the Little Ice Age. These occurred in AD 1540, 1590, 1626 and 1719, plus an especially intense drought from 1437-1473 AD.
Modern Warm Period
The Modern Warm Period starts between 1850 and 1905, which is also the time when people began systematically recording and collecting objectively calibrated instrumental surface air temperature data from around the world. These temperatures were spotty in the beginning, but by the middle of the 20th Century a good, land-based worldwide temperature database was developing. In 1979, satellites were launched that could give us a reasonably accurate and complete lower troposphere temperature record over nearly the entire globe. A discussion of the accuracy of the satellite temperature measurements can be found in an interesting paper by John Christy, Roy Spencer, and William Braswell (Christy, Spencer, & Braswell, 2000) here. Satellite data suggests the lower troposphere is warming at an unimpressive rate of 0.14°C/decade.
Conclusions
Modern global instrumental temperatures have only been available for a short time. Even if the entire 170-year record is used, it is too short to be representative of documented temperature extremes seen over the past 2,000 years. New York Harbor has not frozen over recently, and many areas now covered in glacial ice were ice-free in the MWP.
Going further back, to the beginning of the Holocene, temperature proxies are very sparse and constructing a hemispheric or global temperature reconstruction is futile. The proxies are not accurate that far back, and there is no way to establish that the proxy to temperature functions used will work that far back in time with only a 170-year calibration period.
As we show in this report and as recommended by Soon, et al. (Soon, Baliunas, Idso, Idso, & Legates, 2003b), it is far better to deal with proxies one at a time. Combining them statistically is misleading. When the exact location of the proxy record is known, modern temperature data is accurate and dense enough to extract a reasonable modern instrumental temperature record for the location at a matching temporal resolution. In the examples shown in this post, modern temperatures appear to be well within the range of natural variability for the past 2,000 years and the past 15,000 years.
It is well known that insolation varies by latitude and the records discussed in this post support that. Carbon dioxide is a well-mixed gas and one would expect it to affect global average temperature change approximately evenly over some sufficient time period. We see no evidence that this is the case now, but the record is short.
In the words of Professor Steven Mithen (Mithen, 2003, p. 507):
“The next century of human-made global warming is predicted to be far less extreme than that which occurred at [9600 BC]. At the end of the Younger Dryas, mean global temperature had risen by 7°C in fifty years, whereas the predicted rise for the next hundred years is less than 3°C. The end of the last ice age led to a 120 meter increase in sea level, whereas that predicted for the next fifty years is a paltry 32 centimeters at most…”
Perspective is important, we must recognize that the climate and temperature change we have observed over the past century are very tiny relative to past natural changes. To gain that perspective we must do valid comparisons of historical climate changes to today. That means local comparisons, not global. That means recognizing the poor temporal resolution of proxies and their questionable accuracy, which degrades with time. It is also important to recognize that while the Northern Hemisphere network of land-based weather stations has been good for some time, a good network in the Southern Hemisphere is very new. Finally, decent temperature records of the oceans are a very recent addition. Since oceans cover 70% of Earth’s surface, they are a reliable global temperature record, a record that has been underutilized to date. To put modern temperatures into historical perspective, we should go local, not global.
Download the bibliography here.
If pictures are worth a thousand words then photos like this easily dispel the idea glaciers are melting in unprecedented speed and temperature have never been higher.
Where is this – I cannot read the legend.
RE
I read it as north Canadian Tundra, Tuktoyaktuk Peninsula.
Found a map here:
https://www.geoexpro.com/articles/2013/04/geochemical-surface-expression-of-oil-and-gas-in-arctic-terrains
Just east of the Mackenzie Delta in Canada’s Northwest Territory about 100km north of the tree line where today, in spite of the catastrophic warming of today over which alarmists are wetting their pants, it is still too cold for trees to grow. Yet during the mid-Holocene, they flourished.
”Oh yeah but that was just local. It doesn’t prove anything”……I was told by a zombie one day..
Yes exactly – trees growing in the Arctic thousands of years ago is a local aberation to alarmists, if they even know about it, but a bit more melting of ice one year over another is the end of the world.
Thank you for a very informative summary.
I hope this will be widely distributed to Global Warming folks, who often scare-monger us about dire happenings.
They use a recent fire, or flood, or hurricane, etc., to “support” their narrow-visioned “predictions” of doom.
They want us to ATONE FOR OUR SINS by SUBSIDIZING, per Wall Street’s wishes, the
planting of a billion trees every year
building of millions of wind turbines every 20 – 25 years
thousands of square miles of solar panels every 25 – 30 years
building 1.5 billion EVs every year
building 1.0 billion heat pumps every year
building 10,000 TWh of batteries every 15 years
Plus, those GW folks want use to drag 3 to 4 billion people out of poverty, so they too can enjoy our doomed life styles.
All of that would cost hundred of trillions of dollars for many decades and physical resources.
WORLD AND US PRIMARY ENERGY CONSUMPTION AND CAPITAL COST
https://www.windtaskforce.org/profiles/blogs/world-total-energy-consumption
“It is well known that insolation varies by latitude…”
It is?
At any given point ToA ISR varies 700 W/m^2 summer to winter.
90 W/m^2 perihelion to aphelion.
Compare those to 1750 to 2010 of 2 W/m^2 and RFP 8.5 W/m^2.
Even if CO2 actually did anythang it still amounts to nothing.
Yes, and even if the IPCC models are correct, 260 years of CO2 only amounts to 3.4 W/m^2, way too small to measure with the data we have today. If more people were simply quantitative in their thinking, they would see this nonsense for what it is in an instant.
The 90 W/m2 variation from perihelion to aphelion is at TOA and perpendicular to the surface. To compare this with other RF values you need to project it onto a sphere and then adjust for albedo. That means the seasonal RF range is actually 90 / 4 * 0.7 = 16 W/m2. But this is but an oscillation around a mean of 0 W/m2 with a sine behavior from -8 W/m2 to +8 W/m2. The CO2 RF changes are integrated from 1750-2010. So to compare the orbital RF changes with those of CO2 we need to integrate those as well. This comes out close to 0 W/m2 as it oscillates equally between negative and positive values. In other words, orbital RF is essentially zero (or least very close to it) from 1750-2010. The solar RF induced by the grand cycles is orders of magnitude higher than the orbital RF. Even still the solar RF from 1750-2010 is only on the order of about +0.2 W/m2 at most (See Kopp 2016).
Source and data
bdgwx,
You assume too much and simplify too much, a common mistake. Below is a plot of the uncertainty in TSI at Earth’s orbit, this is the uncertainty in every measurement. There are measurements almost every day. Thus, the uncertainty is from 0.5 to 0.65 W/m^2 every day. Further, there are two competing TSI records, one shows a long term trend (ACRIM) that is longer than the ~11 solar cycle, and one (PMOD) does not.
Thus, given 3.4 W/m^2 modeled CO2 effect over 260 years (0.0011 W/m^2 per month) we don’t have a clue how to measure the effect, it is lost in the uncertainty of the measurements. Your assumption of an orbital or other natural effect of zero is based on nothing, but lack of data.
That is the daily mean TIM uncertainty on the absolute 1-AU TSI. The monthly and annual mean uncertainties would be around +/- 0.1 W/m2 and 0.05 W/m2 respectively. Refer to Dr. Kopps’ TSI plot below which has the 351-day moving average showing the +/- 0.05 W/m2 uncertainty during the TIM era. Note that this is the same source as what Krishna Gans and you posted above.
But…this doesn’t have much relevance to orbitally induced RFs or whether it has changed in the last 260 years. The Milankovitch cycles work on extremely long time scales; thousands to tens of thousands of years at a minimum. There just isn’t enough of an orbital perturbation in the last 260 years to make any significant difference. Nevermind that these orbital perturbations do not change the amount of solar radiation received (at least not significantly). They change the distribution of it both temporally and spatially. It is the change in distribution that can induce an EEI imbalance indirectly via the feedbacks that occur as a result of the changing distribution of the energy. Contrast this with GHGs, aerosols, solar cycles, etc. that induce an EEI imbalance directly.
I don’t really have an opinion on short term orbital forcing, you may be correct that over one to two hundred years it nets to near zero, but you are guessing that is the case, you don’t really know. TOD (time-of-day) changes correlate with some climate events. As rbabcock mentions, cosmic rays striking the Earth changes and this might correlate with cloudiness, the UV radiation from the sun varies a lot short term, etc., etc.
My point is, the natural effects on climate are not known. The assumption that they all net zero over the past 50-100-1000 years is just that, an assumption. Yet, the IPCC always assumes it.
For more on this:
https://andymaypetrophysicist.com/2020/04/18/ipcc-politics-and-solar-variability/
It’s not a guess. Orbital dynamics is a very mature discipline. No significant perturbations exist that would cause a significant change in the 1 AU distance. The best estimates constrain the drift to no more than about 1 m/century away from the Sun, That is about one part in 150 billion. And per the inverse square law that means TSI would decrease by about 0.00000002 W/m2. That is hardly going to cause any substantial EEI during the 260 year period in question. Nevermind that it is in the wrong direction anyway.
And your statement that “natural effects on climate are not known” is incorrect. They are known with reasonable confidence. The IPCC does not assume they are net zero. Some of the natural effects can be quite large in fact like aerosols from volcanic eruptions. Even solar is not assumed to be net zero. Sure, it is estimated to be small, but not net zero. Refer to IPCC AR5 WGI chapter 8 for details on their estimate of <= 0.1 W/m2 (down from <= 0.3 W.m2 from AR4). I went a little higher with +0.2 W/m2 using Kopp 2016. Either way that is not net zero.
There is TSI and there is the total energy hitting the Earth from the Sun. When calculating all energy, you have to figure in CME/Solar Flare contributions, which is not inconsequential. Plus cosmic rays increase and decrease as the Sun goes through the sunspot cycle. I think this decade will have a lot of papers illustrating just how much influence CME’s and Solar Flares contribute to weather and climate. Good paper on energy coming in from these.
https://ntrs.nasa.gov/api/citations/20070008101/downloads/20070008101.pdf
That is a good paper. If I have read the paper correctly it looks like even the most energic flares like the infamous Halloween Solar Storm of 2003 only delivered a peak flux of 0.001 to 0.01 W/m2 for a couple of days. You can find this event in table 1 and cross reference it to the flux received in figures 4 and 5 in that publication.
Another thing to consider is although TSI varies tenths of a percent on average during the sunspot cycles, it actually drops quite a bit when a CME hits the Earth. So when the Earth actually is getting more energy from the Sun, the TSI indicates it is getting less. Since these are relatively short lived events it is hard to say how much of an impact (no pun intended) it actually has, but a CME hitting the Earth will compress the ionosphere and do lots of other things which are probably not that well understood at this point.
I’m not sure I’m following you. Your link says even the most energic storms deliver but a feeble amount of energy to Earth (assuming I’ve read it correctly). And you’re also saying that TSI decreases? How much does TSI decrease? If it decreases by more than 0.001-0.01 W/m2 then these CME events would actually lower the amount of energy received by the Sun. No?
The spectral distribution of sunlight varies with the sun spot cycle and with transient activities on the sun’s surface.
The apparent peak of visible radiation from the sun differs whether one calculates the intensity by wavelength, or the energy carried by the photons. That is, the calculated peak shifts towards blue if one uses total energy as the metric. Also, it appears that wavelength can be important because of stratospheric heating by shorter wavelengths.
A lot of sins can be hidden by averages.
Yes. The thermosphere responds a lot to the solar cycle as well.
There is an offset between the PMOD and the ACRIM instruments which the radiometer gurus ponder and cogitate over.
Don’t overlook the yearly Earth-Sun distance variation in AM0 which introduces a 2% or 27 W/m2 uncertainty interval if a fixed value for the AM0 total irradiance is assumed.
One of my pet sayings is “If your data is crap, so is your science.” This applies of course in spades to “climate science,” the so-called “data” for which is a joke. Scientifically speaking.
1/4 seasonal adjustments. 1/4 radiative distribution. The Earth just got warmer, and four times more perturbed, without any progressive forcing mechanisms.
Sorry, I’m not following what you’re saying. How does that related to what I said above?
That is the wrong question,
mate.
You should not have asked.
But hey, is there now.
Locally, in the short term, I can compare past, present and future.
The modern climatology record in Boulder Colorado goes back to the late 1800’s. Of course a lot has changed over that time, a population increase of almost two orders of magnitude, the wide spread use of fossil fuels, adoption of electricity, etc.
Yesterday it was hot in Boulder, a high temp of 94F (date record high is 104F set in 1954)
In a few hours, the projected high for today is 81F (just a little below average for the date)
Tomorrow’s forecast calls for a high of 69F (well below average but 8F higher than the record low high for the date, which was set in 1958)
In fact, Boulder’s climate has not significantly warmed or cooled in the past 120+ years of good record keeping. The highest decadal temperatures were set in the 1950’s followed by the 1930’s.
Perhaps all of the non-indigenous trees and lawns planted around here, along with irrigation, compensate for all of the asphalt, use of HVAC, etc. Anyway, situation normal and all the rest.
Andy,
“This temperature is only applicable to the Makassar Strait, but it is connected to three large oceans.”
Three? But anyway, it is also only applicable to a depth of 500m (IWT). Rosenthal had quite a lot to say about why that might be, but in any case, they also showed results for the thermocline (TWT) and surface (SST)
They tell a radically different story. SST has been very stable. TWT also fairly stable. It is only at depth 500m that the Holocene cooling appears. This may be of interest to the organisms down there, but seems less likely to be reflective of global surface temperature.
Global averaging of anything is arrant nonsense.
We’ve got > 30 distinct identified regional climates around the globe, and God knows how many locality behaviors within those, all doing their own individual things at any given time.
As this post observes, go local if you want any sensible analysis of climatic behaviors.
“go local if you want any sensible analysis of climatic behaviors”
OK, then you learn about the climate at 500 m depth in the Makassar strait. Useful?
Yes
Andy, the thing is, you have drawn a graph seeking to associate the variations in temperature at 500 m in the Makassar Strait with the collapse of Egypt, the failure of Greenland, the burning of witches. How could there be such an association without a claim that those temperature variations apply globally?
And if there is supposed to be such an association, then why would the nearby SST not have an equal claim to be telling that story? Because that story is very different.
Nick,
Don’t confuse “SST” with “SST reconstruction” – models are not data. My position is that IWT reflects climate-time SST better than planktonic foraminifer proxies, lots of geologists will agree with that opinion.
Obviously, the Indian Ocean and Pacific Ocean SSTs matter to civilization. We just have a difference in reconstructions. That isn’t the same as a difference in the actual SST and IWT.
Well, the sentiment that started this was local is good, global nonsense. Now you seem to be saying that some local (IWT) is global and good.
Nick,
No, local is good and global is nonsense, I totally agree with that. The comparisons to historical events was not meant to imply that the reconstruction was global at all, it was to show that there are events consistent with the reconstruction. Reconstructions are very iffy due to the error in calibrating them to such a short instrumental record and this reconstruction goes back thousands of years.
As for SST’s, look at them in this figure from one of Javier’s essays. They fit short term, just not long term, suggesting foram adaptation. This is analogous to tree rings, which are also good short term, but not long term.
Essay:
As it pertains to “climate” as opposed to “weather” deep ocean temperatures are far more relevant than surface temperatures. This is why benthic foraminifera δ18O reconstructions are used to reconstruct past climate changes.
Nick, I dunno if historical estimates of temperatures at 500 meters depth in the Makassar Strait are useful of themselves to some researchers or not.
What I do maintain though, is that adding these temps to similar temps taken from say the Georgia Strait in BC Canada, then dividing the sum by 2 to compute an average, then asserting that this construct has any real-world application, is arrant nonsense.
Which is essentially what is being done with all “global average” climate elements.
With only 2 samples acting as a proxy for a global mean you’d have a huge amount of sampling uncertainty. That won’t be very representative of the global mean. It’s the same with primitive ice core studies which only utilized Antarctic and Artic cores. That sample is highly biased towards the poles so does not adequately represent the globe. More recent reconstructions like what Kaufmann 2020 provide utilize hundreds of proxy time series of varying types spread out over the globe. They certainty aren’t perfect, but they do provide a useful picture, albeit a bit blurry, of the global mean temperature in the distant past.
Again, what real- world application has a “global mean temperature”?
I get that many climate hobbyists are very invested in the entrails of climate elements, which makes for interesting academic discussions, but let’s not forget that it was all the hullabaloo over “hockey stick” global temps constructs that has led us into massive wastage of scarce public funds on totally useless CO2 reduction boondoggle, declarations of war on climate, and indoctrinating kids that their very existence is in jeopardy if we can’t “stop the climate from changing”
Tracking the global mean temperature is useful for analyzing the heat uptake by the climate system and tracking the planetary energy imbalance. It also provides a convenient metric for testing various hypothesis related to the behavior of the climate system and observation of the climate system. It is also useful for quantifying the magnitude of climate change events in Earth’s past and in explaining the various aspects of Earth’s different climatic eras.
As I said – an interesting academic exercise.
But without real-world application.
There is no such actual condition as a “global average (or mean)” temperature.
It’s just playing spreadsheets. (Where you can always get the result you’re looking for)
Mid-range temperatures have little to do with indicating climate at any location, let alone on a global basis. The global “mean” being used by the climate scientists is actually the mean of mid-range temperatures. The same mid-range temperatures can be generated by significantly different minimum and maximum temperatures at different locations.
That is why the integral of the temperature curve gives a far better indication of the climate at a location. This is called the cooling degree-day or heating degree-day value (and even the growing degree-day for farmers and gardeners).
Temperature is a poor proxy for anything having to do with heat.
Which can get really messed up on days that deep cold fronts roll through a site.
It’s no more or less of a “condition” than the average temperature of the human body, swimming pool, food, etc. And that doesn’t even scratch the surface of the many different ways the average temperature of a body is used in many disciplines of science. It is measured, analyzed, predicted, and used for all kinds of purposes all the same.
I don’t take the “average” temp of my body.
I take a best representative reading FROM THE SAME SPOT EVERY TIME.
Then any observed variations from reading to reading can indicate something that may or may not suggest a problem.
This article is about why LOCAL conditions compared over time to the same LOCAL conditions is the only rational way to analyze any climatic effects.
Averaging readings from all over the place under different influences then comparing these constructs to other similarly-derived constructs is arrant nonsense.
Uhhh,, temperature is not heat. To measure heat content you must measure the enthaply. Atmospheric enthalpy is not just temperature dependent but also pressure and absolute humidity dependent. Most federal stations since 1980 are capable of providing all this information and would allow calculating the actual surface enthalpy. Ask yourself why climate science is not doing this.
A global mean temperature is not a good metric for measuring heat uptake by the climate system.Too many missing factors.
Enthalpy is considered too. This is especially important when energy transfers from one reservoir to another via phase changes like with melting/freezing of ice or evaporation/condensation of water.
bdgwx,
Kaufman, 2020 is a very good analysis of the various multiproxy methods out there and I am enjoying the paper. But, we only have a short instrumental record, as I state in these two posts, we can only rely on it for the past 20 to 70 years, and 70 years is a stretch.
Kaufman has a lot of proxies, but that doesn’t help much, they have varying resolutions and these average 164 years, much longer than our current “good data” period – max 70 years.
Second problem, we have only warmed approximately one degree in the past century. The error of Kaufman’s estimate is over two degrees. We can’t possibly compare what he has done to today. Individual proxies yes, his various reconstructions no.
Resolution is definitely a problem. I, like everyone else, wish it were better. Concerning the uncertainty I’m seeing about +/- 1C around the time of the Holocene Climate Optimum. The last 2000 years looks to be less than +/- 0.5C. That is the 95% CI in figure 3. Where are you seeing the +/- 2C?
bdgwx,
That is the value he gives in the supplemental spreadsheet, cell G131. He labels it “Value used for uncertainty estimates in this study.” I always look at the supplemental materials, that is where the real story is. The papers are driven by editors and peer-reviewers and tend to be nonsense.
Try here:
https://static-content.springer.com/esm/art%3A10.1038%2Fs41597-020-0530-7/MediaObjects/41597_2020_530_MOESM1_ESM.xlsx
Gotcha. Thanks. That is helpful. But unless I’ve misread something it looks like those are the uncertainties for the individual proxies similar to what is in table 1. I don’t see a line item for the final composite of the 5 stacking methods as illustrated in figure figure 3. G131 is the uncertainty for the D18O isotope proxy from what I’m seeing.
bdgwx, True, I don’t see it either, but I doubt it is less than 2 degrees. The average of all the values given for the various proxies is 1.9, but I don’t know how they are distributed among the various multiproxy methods. Multiproxy methods have so many sources of variability loss and error, both systematic and random, that they are useless in my opinion. This is why I wrote these posts. As someone else wrote, “global is crap, local is good.”
Figure 3 has the 5-95% envelope for global composite. The range is less than 2C for most of the period and less than 1C for the last 2000 years. If this is useless then undoubtedly single proxy methods from single sites are useless as well since they have higher error. And if all of this is useless then how do you propose the global mean temperature be estimated?
Indeed. There is always the chance that a single point might be reflecting local peturbations that are specific to the area. The Makassar Strait throughflow is known to be ‘highly variable in space and time’. Perhaps not what you want in a proxy site.
https://www.researchgate.net/publication/258662731_The_Makassar_Strait_throughflow_and_its_jet
John,
Possibly, I’m not familiar with the geological history of the Makassar Strait. But the idea of having a proxy in a major throughflow is good, as long as it is a major throughflow. I think it was a throughflow throughout the Holocene, if so, we are good. I’m not worried about wind and weather so much because we are using IWT, but if I were using SST, weather and wind makes a difference.
Actually the lot looking for the missing “cooling” shall go as deep as the lot looking for the missing “warming”.
Do not think 500m will actually cut it…especially for the loot looking for the missing of the cooling, as that is some equivalent of a deficit of ~5-6C in a 7K year trend.(according to paleoclimate data).
No matter what tricks like Andy’s tired… still it will be there.
cheers
Nick,
You have a funny definition of “stable” or perhaps you are not looking closely at the scale. I admit Rosenthal’s Figure 1 is hard to read, attached is the high-res version of the figure which may help. All depths vary a lot over the Holocene, none are stable.
SST: drops over 2 degrees in the LIA
TWT: drops 2.5 degrees in the LIA
IWT: just shows a steady decline.
I don’t have the data for Figure 1, only 2 and 3, or I’d plot it up at a better, more readable scale. But, you can verify these numbers on the attached plot. None of these records, at any depth, could be called stable.
“You have a funny definition of “stable””
It is Rosenthal’s.
“In contrast with the substantial IWT cooling, reconstructions of sea surface temperature (SST), based on Mg/Ca ratios in the mixed-layer foraminifer Globigerinoides ruber from multiple sites in the Indo-Pacific Warm Pool (IPWP), show only ~0.5°C cooling from ~9 ka to the 20th century (16) (Fig. 1). M”
Nick, I don’t know what he was looking at, or what he means. I’m looking right at his Figure 1 and I see >2 degrees. He either fit some sort of line or eyeballed some trend, hard to say. The total variability in the last 2,000 years is well over 2 degrees. I do not have the SST data, but I emailed him to request it. The sentence you quote is not supported by the figure.
SST is not a very good climate indicator and Globigerinoides ruber is not a very good proxy anyway. Both are far too susceptible to local environmental problems and weather events. The deeper water proxies are better.
It’s his graph. That is what he sees. So do I.
So, we disagree, not unusual.
And as usual, I have Science on my side 🙂
Doubtful, see this display from Javier:
As I noted above, the foram proxies for SST are adapting to the weather, the salinity, etc. They work short-term, but not long-term, like tree rings. To get the long-term picture go to the deeper depths.
Don’t get me wrong. I cannot prove this, any more than the tree ring adaptation proposed by Briffa can be proven. But when organic proxies are too close to the weather and the surface, they often adapt to it and invalidate the proxy-to-temperature correlation.
All that said, the Makassar Strait reconstruction is NOT a global reconstruction, it is, at best, regional.
“All that said, the Makassar Strait reconstruction is NOT a global reconstruction, it is, at best, regional.”
But then you show a graph which associates it with all sorts of historic events around the world.
So mentioning that two events happened at the same time is now the equivalent of directly claiming a casual relationship?
What other point is there in associating those events with the temperature at 500 m depth in the Makassar Strait?
Nick, the point of comparing historical events to proxies, is the historical events are dated better and we know they happened. Proxies cannot be calibrated or checked before thermometers were invented. They are very iffy. One good check is history, the best historical events are glacier advances and retreats, but others are helpful. Don’t confuse proxy temperature models with data, they are models not data. Historical events are primary data. From the post:
That would be a first.
Here are anomalies from 500 m and 600-900 m. I’m not a fan of using SST for climate, so I haven’t messed with it in that area. SST is too variable and messy, but it certainly is not “stable.”
It’s a good thing you have your heat set so low 😉
Andy,
a simple question.
Do or do you not agree with the given, that the climatic periods, cycles and trends are wrongly portrayed by the paleoclimate data within the long term, going back at 400K years+?
The cooling trend of the current Interglacial, the latest ~7.5K years, does indeed invalidate the proposition of previous Interglacials as portrayed in paleoclimatology.
It does not agree at all with the previous rest.
The numbers don’t and can’t add at all, which ever way tried.
cheers
whiten, The farther back in time, the higher the uncertainty. But the Neoglacial cooling we are observing now is seen in previous interglacials. Javier Vinos has written a lot about this, see here. https://judithcurry.com/2018/08/14/nature-unbound-x-the-next-glaciation/
Andy,
This what paleoclimate data show;
up 5.5-7.5C >> down 1-1.2C, in accordance with:
an up trend of 7-7.5K years ~= 7-7.5K years of the down trend.
That is a plain error in paleoclimate understanding, an anomaly, as it invalidates the proposition of the current climatic understanding.
Regardless what terminology or persuasion you apply,
one thing can not be;
“that the deficit of the cooling in the long term cooling trend of this current Interglacial is observed in any other previous ones, as per paleoclimate data.”
It is not observed in previous ones, and it is huge.
It stands as ~5-6C.
It can not be explained way by any hypothesis or academic guesses… as it simply is an error of paleoclimate data process.
No matter what way approached, there can not be more than 1.2C in the long cooling trend of ~7K years of this Interglacial up to the point of the LIA start.
Please if you claim that there was more than 1.2C cooling from the very top of this Interglacial optimum to the beginning of LIA, as per paleoclimate data,
please quantify it.
cheers
whiten,
Already done. I refer you to this post and Javier Vinos’ essay. You can choose to believe what we wrote or not.
Andy.
You still refuse to quantify the amount of cooling there in the long cooling trend of this Interglacial, as per the very official paleoclimate data.
Man, you can pick and choose whatever pleases your view point, and I am sure there is a lot of it out there.
But which ever way turned the anomaly in the paleoclimate data is still there, huge, and will keep being there till the GHE fanatics or zealots got to consider it… regardless of the flavour of fanaticism.
Scientifically, there stand a strong clause of reassessment and readjustment of the paleoclimate data product.
Why do you hand wave it, and strongly oppose it?
It is clearly shown in the paleoclimate data product, as a clear sign of a mathematical impossibility.
Please, be clear, and tell me openly;
“That according to your knowledge, there actually could be more than 1.2C cooling in this interglacial cooling trend up to start of LIA,
as per the paleoclimate data, of whatever sort you rely upon.”
It will help if you quantify it.
You never know, you may just change my mind there.
Miracles may just in the end of the day happen.
cheers
Of course, I don’t know what it is, no one else does either. The point of these posts is that we can only find out proxy-by-proxy. This absurd attempt to quantify it for the entire globe is silly.
Once it has been done for a sufficient number of proxies and each are validated, we can consider trying to do it for the globe. These wild statistical attempts to do it with a button are absurd.
Andy,
as just pointing out to you, that request was as per the paleoclimate data merit there…
which…
In that regard I will suggest, that if you don’t know even that much,
you should consider to stop lecturing others about any data about climate at all… as simple as that.
if it is silly is silly… as silly as Holocene… so stay way from lecturing others about silliness… or else accept to get in the full dirt of it all.
so far you clearly fail in changing my mind.
cheers
This is an important contribution. How to make it widely available? Too bad Scientific American, Nat Geographic and their ilk are no more.
Educators, step up and turn on the lights.
These two posts are up on three sites now and I expect it to see wider distribution over the next few days. My posts tend to be re-blogged a lot, they will be translated into both Dutch and German soon. Will the posts have any effect? Probably not much.
Hi Andy:
You stated “ In 1979, satellites were launched that could give us a reasonably accurate and complete lower troposphere temperature record over nearly the entire globe.”
If I recall correctly, satellites were launched in 1973. Is there a reason those were not used in this presentation?
Brad, The MSU (microwave) data used to measure tropospheric temperatures were not available until late in 1978. Spencer and Christy’s original paper explains this pretty well: https://science.sciencemag.org/content/247/4950/1558.abstract
The uncertainty on global mean temperatures of the troposphere as calculated from satellite data is at least 2x as much as that calculated for the surface temperature from traditional sources. See Mears 2011 for details.
bdgwx,
I disagree, see this assessment of satellite error based on real data:
https://journals.ametsoc.org/view/journals/atot/17/9/1520-0426_2000_017_1153_mttdca_2_0_co_2.xml
Satellite error of monthly average estimate is between +-0.011 and +-0.05 degrees, probably closer to the lower end. But they do not measure surface temperature, so the comparison is with radiosonde data, which also has errors. Mears RSS data is a bit questionable since he uses some bad satellite data.
As for the ground datasets, which measure a different thing, so it cannot be compared directly to satellite data, the error is estimated to be +-0.055 degrees by the Hadley Centre. The average total monthly uncertainty (Upper-Lower uncertainty) from the Hadley Centre is 0.098 degrees from 1979 to March 2021.
Both errors pertain to the monthly global averages. The error in the Hadley Centre datasets is probably less than that estimate now. We have more buoy and ARGO data now; they improved the estimate a lot since most of the error was in the SST data.
Christy et al. say +/- 0.1C for annual values in that publication. This compares to Berkeley Earth of +/- 0.03C.
bdgwx,
I think you are confusing actual temperatures for trends, right. Berkeley and Hadley work in anomalies. Anomalies are meaningless numbers that can be shifted around at will, only the trend has meaning. The proper number to compare to Berkeley or Hadley are the trend values. The accuracy of the actual temperature from the satellite measurements has no meaning in the Berkeley or Hadley world.
You need to compare apples to apples.
Both values I cite above are for annual mean temperatures in units of C. Both UAH and Berkeley Earth publish their monthly/annual means as anomalies. This is an applies to applies comparison.
bdgwx,
I am on the Berkley Earth web site right now and I do not see a single measured temperature, they are all anomalies. Anomalies are not temperatures. The only information in an anomaly is a trend, the anomalies increase or decrease and establish a warming or cooling trend. You compared the accuracy of the actual temperature measurement in UAH to the recent accuracy of the anomaly in Berkeley Earth. And you got the number wrong, it is +-0.06 (1950-1959 to 2000-2009), not 0.03.
I was using 1979-2020, yearly, a roughly comparable number from Berkley, eyeballing the attached graph, is about 0.06 to 0.09 or so. And remember their uncertainty estimates are Monte Carlo estimates, they do not include systematic errors. The UAH estimates are based on real data, gathered independently.
But either way UAH is better, although it measures the temperature of a different volume of air.
https://www.scitechnol.com/2327-4581/2327-4581-1-103.pdf
Berkeley Earth publishes monthly and annual anomalies. Their baseline is 1951-1980. The temperature of this baseline is 14.107 +/- 0.020C.
UAH publishes monthly and annual anomalies. Their baseline is 1991-2020. UAH does not publish the temperature of this baseline.
The uncertainty on the Berkeley Earth annual anomalies is +/- 0.03 for all years 1979-present. This is published here and is consistent with the graph and document you linked to. Note that the graph above is the land-only annual anomaly uncertainty. The link I presented here contains the uncertainty for the global land+ocean annual anomaly time series. You can find the land-only annual anomaly uncertainty here.
The uncertainty on the UAH annual land+ocean annual anomalies is +/- 0.10. This is straight from the Christy et al. 2000 you linked to. You can find it in section 3, paragraph 1, sentence 1. It says and I quote, “How accurate are the annual anomalies and trends of version D? We will show below that the 95% confidence interval (CI) for annual anomalies T2·D and T2LT·D is about ±0.10 K and that the CI of the trend is ±0.06 K decade−1”.
bdgwx,
You are misinterpreting what Berkley Earth wrote.
This refers to the mean from 1951-1980, it is not a year-to-year uncertainty and it does not cover the whole Earth.
Anomalies are not temperatures. The average of each proxy over a specified period is subtracted from each temperature so temperatures at different elevations and conditions can be compared to one another. More pertinent to this discussion is the fact that anomaly uncertainty is less than temperature uncertainty because the actual temperature has been removed from the measurement, what is left is a trend.
Ask yourself, are the average temperatures quote above pertinent to Denver, Colorado? Of course not. They don’t say, but those averages are probably for mean sea level.
I should have cited this Berkeley Earth document as the source of the graph.
https://www.scitechnol.com/2327-4581/2327-4581-1-103.pdf
“You need to compare apples to apples.”
bd is comparing apples to apples. Both UAH and BEST produce anomalies, with good reason. Have you ever seen an absolute temperature from UAH? What would it mean?
You said
“Satellite error of monthly average estimate is between +-0.011 and +-0.05 degrees,”
That must be the error of an anomaly average, and as bd says, it is actually higher. Like any other result, an anomaly average has an uncertainty range.
bdgwx,
Here is a link to a discussion about the problems with Mears RSS data:
http://www.drroyspencer.com/2016/03/comments-on-new-rss-v4-pause-busting-global-temperature-dataset/
RSS has problems. So does UAH. But that doesn’t take away from the fact that satellites aren’t that precise. The wild spread between RSS and UAH is testament to the fact that satellite estimates, while useful, are not comparable to traditional or reanalysis datasets in terms error margins. Don’t get me wrong. They’re still useful. I look at that them all the time in fact.
That does not fit with my experience, but since the two datasets don’t overlap, we can’t test our ideas. The surface is a wild place, never in thermodynamic equilibrium and the surface temperatures only check a very thin shell. The satellites measure a very thick portion of the lower troposphere. I believe Christy’s analysis and think the satellites are more accurate, but it can’t be proven.
Great post Andy. The Climatariat is either clueless about the concept of resolution or willfully disregarding basic signal processing standards.
Thanks David
Andy, thanks for both posts, but especially this one. You lay out an ironclad case for natural variability, something Mann tried to eliminate in 1999 his hockey stick handle). Natural variability is fatal to all climate models because their unavoidable parameterization drags in the attribution question. See my post here some years ago, ‘The trouble with climate models’ for the technical details.
Thanks, Rud,
I found the post; it is a good compliment to what I wrote:
https://wattsupwiththat.com/2015/08/09/the-trouble-with-global-climate-models/
An excellent pair of articles, Andy!
Figure 1 from the Makassar Strait seems to indicate that temperatures in the tropics are near record lows for the past 10,000 years and have only barely started to recover from the Little Ice Age, and are nowhere near those of the Roman or Medieval Warm Periods.
Figure 2 from the extra-tropical Northern Hemisphere (where a lot of the world’s human population lives) shows a different pattern, with present-day temperatures near those of the Medieval Warm Period, but the rise in temperatures (at least of the smoothed averages) started around 1830, many decades before extensive use of fossil fuels.
The presence of some local warm periods during cooling trends, or local cold periods during warming trends, also shows that climate and weather are local, not global, and some areas can have unusual cold or floods at the same time that other areas have unusual heat or drought.
Even today, we have a report of near-record cold at the South Pole (-115 F), while the National Weather Service is predicting a record heat wave for Oregon and Washington State this coming weekend. Of course, the South Pole is in total darkness this time of year, while the Pacific Northwest is shortly after the summer solstice, with long days and high sun angles.
There are many forces driving our weather and climate that are much stronger than a measly 0.041% of CO2 in the air (El Nino / La Nina, the jet stream, the Atlantic oscillation, the polar vortices, volcanoes, etc.) and the strongest among them is that big bright yellow ball in the sky.
The local climate emphasis has always been missing from my previous reading on climate change. Good job putting it all together.
Thanks!
An excellent review of where we are today in climate. I hope that we can stave off the hysterical push for the NWO centrally planned Agenda for which real science will be sacrificed.
Every dire climate prediction for over 40yrs has failed miserably, despite egregious manipulation of global temperatures to try to make the CO2 “control knob” theory work. Shifting goal posts from 1950 to 1850 to add on 0.6°C to the global warming sum and making the threshold 1.5°C for 2100 (really just a doubling of that of the previous century) was the action taken when observations showed the theory to have overestimated warming by a whopping 300%.
Here is the ‘why’ for the present AGW hysteria and 10yr deadlines for action. By their actions, their chief concern now is that, with CO2 unchecked, nothing bad will happen by 2100. Possibly, doing nothing, we won’t even reach +1.5. They are desperately rushing to get ahead of the parade so that they can lay claim to having succeeded in keeping temperatures at or even below +1.5C with the new restrictive laws they are pushing for.
The problem associated with comparing today with a selected point in the past, is that there is no future in that comparison. What do I mean by that? Then isn’t now. Now wont be our tomorrow. Ultimate solutions are and have always been proven to be bad ideas. Simply, that we are comparing our current experience, however weighted towards alarmism, to a period in time which we had no input and imagining a future us by multiplying now by some other guesstimate.
Unless all this can be wrapped up in a day, we will have no input nor can we know the global circumstances even fifty years from now. Our guesses however much we may wish to tag as ‘science says’, are just projections of now. Now being this moment of crisis. Not a good start point for the truth.
There is no answer for what was, for us there is no answer for what will be fifty years from now. Yes, we can and should act pragmatically to the circumstances of the day.
What we can do is manage today by creating policy and regulation that answers to real situations, the environment being one, with out being financially crippling, socially crippling, or stifling growth and opportunities, green or otherwise. The example we set today, if we clean up our room, to paraphrase Dr. Peterson. Will be the example our children’s children’s children will use to continue answering global issues. Pragmatic actions relative to their time.
But please let’s stop this idea that we can adjust the global temperature, or even the local temperature. We have real problems to resolve. Not crisis level like the impending doom of CAGW, but real issues like managing our forests, clean water conservation, aging power grids, investments in clean energy practices for coal, nuclear, NG, and biofuels for examples..
CAGW is such a distraction and a fantastic money sinkhole that so much necessary and more relative structural needs in real time are left wanting. This obsession with GW has taken us off on a tangent that has set us back, globally, to where we could have been, before so much of our recourses were directed towards one of the greatest transfers of wealth, equal to the U.S. GDP, on keeping emerging nations out of the industrial sphere… excuse, CAGW. And yes I know they changed the name. They haven’t altered their intentions one iota.
Yep.
To the Marxist hammer wielders, every possible thing must be treated like a nail.
Bit of a stretch to link ocean temperatures 500m down in Indonesia with a drought in the Middle East, some might think.
“The reconstruction in Figure 1 illustrates the steady drop in surface temperatures since the Holocene Climatic Optimum, which ended about 6,000 years ago. ”
Does it though? This implies a coupling between surface temperatures and intermediate depth ocean temperatures. Something the paper explicitly denies…
“Although documented changes in global surface temperatures during the Holocene and Common era are relatively small, the concomitant changes in OHC are large.”
and
“The current response of surface temperatures to the ongoing radiative perturbation is substantially higher than the response of the ocean’s interior, due to the long whole-ocean equilibration time. However, on longer time scales the oceanic response is likely different, as seen in our records where past changes in IWT were much larger than variations in global surface temperatures.”
So in fact using the IWT changes as a proxy for surface temperatures would seem to be a non-starter – at least that is what this paper tells us.
That long equilibriation time also makes me wonder about the relevance of ocean temperatures at 500m now. The present radiative imbalance is currently warming the sea surface but will likely not equilibriate down to 500m for decades. Perhaps someone could provide an estimate. When it does show up, it is likely to be notable, as the paper observes :
“The modern rate of Pacific OHC change is, however, the highest in the past 10,000 years”
Columbia University released a press release and video on Rosenthal et al which included this section…
“A recent slowdown in global warming has led some skeptics to renew their claims that industrial carbon emissions are not causing a century-long rise in Earth’s surface temperatures. But rather than letting humans off the hook, a new study in the leading journal Science adds support to the idea that the oceans are taking up some of the excess heat, at least for the moment. In a reconstruction of Pacific Ocean temperatures in the last 10,000 years, researchers have found that its middle depths have warmed 15 times faster in the last 60 years than they did during apparent natural warming cycles in the previous 10,000.”
https://web.archive.org/web/20131108064244/http://www.ldeo.columbia.edu/news-events/global-heating-hiding-out-oceans
Michael Mann has some observations on the paper here. Apparently ocean sediments have their own ‘divergence problem’.
Unless you know something I don’t, the only source for the OHC is the Sun, via the surface. What we don’t know is the process of moving that thermal energy through the ocean, we just know it happens.
As for some magic disconnect between OHC and SST, forget it. They are connected, they have to be. The flaw is in us, in our understanding of the system.
Further, we do not have a reliable SST record longer than the past 20 years, I would prefer to limit it to the past 15 years. For Rosenthal to speculate that the SST record is disconnected from the OHC record, or that they contradict one another, is probably just poor writing. His data is good, his speculation not so much.
Our current SST reconstructions are inconsistent with our deeper water reconstructions, the proper conclusion is one or the other is wrong. My bet is that the SST reconstruction is wrong and the IWT is correct, but I don’t know either. I just know they don’t match very well and yet they have to, unless there is some other significant source of heat hidden in the ocean somewhere.
“ For Rosenthal to speculate that the SST record is disconnected from the OHC record, or that they contradict one another, is probably just poor writing. His data is good, his speculation not so much.”
As Nick Stokes pointed out the disconnect is in the data.
” My bet is that the SST reconstruction is wrong and the IWT is correct, but I don’t know either. I just know they don’t match very well and yet they have to, unless there is some other significant source of heat hidden in the ocean somewhere.”
And yet you plot IWT and then in the text assert the curve ‘ illustrates the steady drop in surface temperatures’, even when the paper you rely on is clear that the IWT and surface datasets do not correlate.
And then throw out accusations of bad writing. Very droll.
You misunderstand my point. The IWT reflects actual SST over the long-term in my opinion. Make no mistake, SST and IWT are connected, we can take that to the bank. They both reflect actual SST, but with different delays, differing levels of noise, and different attenuation. Nothing else makes it to the deep ocean, except trivial amounts of geothermal energy (~0.8 W/m^2/yr or so)
They disagree, is the SST reconstruction wrong? Yes, IMHO.
Does IWT reflect the actual SST (long term) better, with less noise? Yes.
SST (that is planktonic forams) are subject to all kinds of environmental and weather noise, they are very unreliable proxies, except for short time frames, just like tree rings, which work for a few hundred years and then go to crap.
IWT (benthic forams) are much more stable and reliable.
Just my opinion, I can’t prove any of this obviously. But you can’t prove the SST proxies are working either. It’s a judgement call, based on experience.
“You misunderstand my point. The IWT reflects actual SST over the long-term in my opinion.”
So to summarise: Rosenthal et al report IWT and SST do not correlate well, with the latter showing far less variability. Despite this you characterise IWT as representing the surface record, in direct contradiction to your source.
And your justification for this is no more than your unproven ‘opinion’ – it is a ‘judgement call’.
It would have been just awesome if you could have made it just a little clearer that your Fig 1. was not based on actual data – just a hunch.
😉
My figure 1 is based on proxies, just like all other reconstructions, no better, no worse. IWT and SST do not correlate well, both have the same energy source, the Sun. That is all we know, everything else is opinion.
(Sigh). It is a plot of intermediate temperatures, which do not correlate with the surface. So far, so good. But then you say it shows ‘ the steady drop in surface temperatures since the Holocene Climatic Optimum‘, and overlay some surface events from around the globe.
This is just magical thinking.
John, You confuse models of temperature from proxies with actual data, very common among alarmists:
“It is a plot of intermediate temperatures, which do not correlate with the surface” [proxies]
See the difference?
Again, look at Javiers plot. It is the same data that Rosenthal used, just a better display. Notice that the surface PROXIES, see the short term, but not the long term. Just like tree rings.
https://judithcurry.com/2017/07/11/nature-unbound-iv-the-2400-year-bray-cycle-part-a/
As interesting as it may be, the proxy record for 500m temperatures in Makassar Strait is far from a credible indicator of global surface temperature during the Holocene. The throughflow in the Strait is from the Sulawesi Sea to the Java Sea and doesn’t involve the waters of three oceans, as claimed. And within the Strait, surface temperatures are virtually incoherent with those near the surface. By ignoring the actual physics of the oceans, paleoclimatology continues to be an act of idolatry, not of science.
1sky1,
Sorry the sources of the water through the Strait are very well documented as the Pacific, Indian, and Southern Oceans. The flow goes both ways depending upon the depth. I know of no source that says otherwise. Do you have such a source? I would refer you to Rosenthal, et al. cited in the post. He cites numerous sources.
The Makassar Strait between Borneo and Sulawesi, the Lifamatola Passage east of Sulawesi on the northern side of the Indonesian archipelago, and the Ombai and Timor Passages to the south serve as major conduits for exchange of water between the Pacific and Indian Oceans;water flow through these passages is collectively referred to as the Indonesian Throughflow.
Rosenthal et al.
Exchange of water and heat from the Pacific Ocean into the Indian Ocean occurs through the Indonesian throughflow, which is the only natural connection between two tropical oceans on earth. The ITF is divided into western and eastern branches. The western pathway carries waters from the northern tropical Pacific Ocean via the Mindanao Current through the Sulawesi Sea, the Makassar Strait into the Flores Sea and then through the Lombok Strait or through the Banda Sea and Ombai Strait into the Indian Ocean.
The Makassar Strait throughflow and its jet
https://agupubs.onlinelibrary.wiley.com/doi/full/10.1029/2011JC007809
Can I suggest a small edit? How not to compare today to the past.
I don’t see your point, your quotes support what I said and wrote. You are either very confused or misreading what I said.
With regard to this:
I fully agree with you, as clearly stated in both posts, climate is local, not global, and should be viewed that way. The Rosenthal record is not to be interpreted as global, or even hemispheric. It is just representative of the region, luckily, it gives us a hint of SSTs in the Pacific and Indian Ocean tropics and the northern Southern Ocean.
Read the posts and Rosenthal (especially the SM) again.
John, Just read the Mayer and Damm article, it doesn’t say anything that isn’t in Rosenthal or in my posts. Looks like he developed a reasonable model of the Makassar Strait and came to the same conclusions. I guess I find it hard to see what it is you are complaining about. Looks to me like you agree with me, but are pretending not to??
Exactly correct.
“The tropical Pacific appears to have been in an anomalous La Niña-like state during the Medieval era. During such a state, which is the flip-side of El Niño, much of the tropical Pacific (the eastern and central tropical Pacific) is unusually cold. But the tropical western Pacific and IndoPacific are especially warm. That makes it perilous to draw inferences about global-scale warmth from this region“
Not to mention …
“A nested numerical model system has been set up to realistically simulate almost 40 years of the Indonesian throughflow (ITF). A global circulation model delivered the boundary values for sea surface height, temperature and salinity distribution to a fine resolution regional model of the ITF. The results of the regional model are in good agreement with measured data regarding velocity distribution, stratification as well as transported water masses, even though the division of the ITF volume transport into its western and eastern branches differs slightly from estimates from other model results or measurements. The results show a current system highly variable in space and time.“
https://web.archive.org/web/20131102034732/http://www.huffingtonpost.com/michael-e-mann/pacific-ocean-warming-at-_b_4179583.html
https://agupubs.onlinelibrary.wiley.com/doi/full/10.1029/2011JC007809
John, I agree with all of that. Especially:
“The results show a current system highly variable in space and time.“
I fail to see anything either Rosenthal or I have written that is different.
“and to the burning and persecution of witches and Jews in Europe,”
Why in a blog that questions dubious science do you promote dubious history? Jews and heretics were definitely persecuted in Spain when the Moors were defeated, but many Jews immigrated to Christian countries of Europe.
As for witches, there was not widespread persecution of witches in Catholic countries! Not even burning of heretics was wide spread. You will read 32 000 heretics were executed in Spanish Inquisition while elsewere 15 000 were persecuted and 3000 to 5000 executed. Estimates of those that died while under arrest and in conflicts get counted as executions.
On top of that, it was heresy to believe that someone was a witch. People were executed for pretending to be one but quickly stopped. Even confessions of the person were declared not to believed.
Protestant Christians did execute people for being witches. Actual documented case of trials and executions are in the hundreds. While that would be an underestimate, estimates of 30 000 comes from extrapolation of what unrecorded executions would have been. Some more rabid leftwing academics calculate 80 or 100 000. This gets reported as 3 million in leftwing magazines.
One interesting case of an actual documented trial was a man who was convicted of bewitching a maiden then seducing her, leading to her suiciding He was garroted and drowned.
And to top it off, leftwing version of history is that drug use for recreation was not frowned upon in medieval times.
This is a bit like climate change. Persecution of witches, Jews and heretics did occur. Some were even burned at the stake but real history gets warped into something exaggerated for political purposes.
My source on the burning of witches and Jews because they brought on the cold in the LIA, which most definitely occurred in catholic countries is Wolfgang Behringer’s book A Cultural History of Climate, pages 127-132. As the cold came, ~1400, Jews were blamed for it and massacred by the thousands in England, France, Spain, and Germany. Witches (older infertile women mostly) were associated with the infertile land and killed for bringing on the cold and drought. They were killed in England, present-day Germany, France, and in the United States. It is a good book, well worth reading.
Attached find a 1486 woodcut of a witch conjuring a hailstorm. It is from page 129 of the book.
Probably not worth reading. The killing of witches was widespread around the world, especially by pagan Romans. This continued after the Romans became Christian. Conversion to Christianity dramatically reduced persecution of people for being witches but it never was completely eliminated. The Protestants continued the attacks on people for being witches, not for bad weather though.
From Jenny Gibbons, a historian with an MA in history for a thesis on The Great Hunt. She calls her self a wiccan so not written with a Christian bias.
“Since the late 1970’s, a quiet revolution has taken place in the study of historical witchcraft and the Great European Witch Hunt. … many theories which reigned supreme thirty years ago have vanished, swept away by a flood of new data. the quantity and quality of available evidence has dramatically improved…Today, for the first time, we have a good idea of the dimensions of the Great Hunt: where the trials occurred, who was tried in them, who did the killing, and how many people lost their lives. Every aspect of the Great Hunt, from chronology to death toll, has changed. And if your knowledge of the “Burning Times” is based on popular or Pagan literature, nearly everything you know may be wrong.
For years, the responsibility for the Great Hunt has been dumped on the Catholic Church’s door-step. 19th century historians ascribed the persecution to religious hysteria. And when Margaret Murray proposed that witches were members of a Pagan sect, popular writers trumpeted that the Great Hunt was not a mere panic, but rather a deliberate attempt to exterminate Christianity’s rival religion. Today, we know that there is absolutely no evidence to support this theory.
When the Church was at the height of its power (11th-14th centuries) very few witches died. Persecutions did not reach epidemic levels until after the Reformation, when the Catholic Church had lost its position as Europe’s indisputable moral authority. Moreover most of the killing was done by secular courts. Church courts tried many witches but they usually imposed non-lethal penalties. A witch might be excommunicated, given penance, or imprisoned, but she was rarely killed. The Inquisition almost invariably pardoned any witch who confessed and repented.
… in York, England, as described by Keith Thomas (Religion and the Decline of Magic). At the height of the Great Hunt (1567-1640) one half of all witchcraft cases brought before church courts were dismissed for lack of evidence. No torture was used, and the accused could clear himself by providing four to eight “compurgators”, people who were willing to swear that he wasn’t a witch. Only 21% of the cases ended with convictions, and the Church did not impose any kind of corporal or capital punishment.
… Ironically, the worst courts were local courts. …”Community-based” courts were often virtual slaughterhouses, killing 90% of all accused witches… national courts tended to have professional, trained staff — men who were less likely to discard important legal safeguards in their haste to see “justice” done.
But what of the Inquisition? For many, the “Inquisition” and the “Burning Times” are virtually synonymous. The myth of the witch-hunting inquisition was built on several assumptions and mistakes, all of which have been overturned in the last twenty-five years.
…a common translation error … said that a witch was tried “by inquisition”..Later, when historians examined the records in greater detail, they found that the majority did not involve the Inquisition, merely an inquisition …older and more popular texts (such as Rossell Hope Robbins’ Encyclopedia of Witchcraft and Demonology) still have the Inquisition killing witches in times and places where it did not even exist.
…In the 1970’s, when feminist and Neo-Pagan authors turned their attention to the witch trials, the Malleus Maleficarum (Hammer of Witches) was the only manual readily available in translation. Authors naively assumed that the book painted an accurate picture of how the Inquisition tried witches. Heinrich Kramer, the text’s demented author, was held up as a typical inquisitor. His rather stunning sexual preoccupations were presented as the Church’s “official” position on witchcraft. Actually the Inquisition immediately rejected the legal procedures Kramer recommended and censured the inquisitor himself just a few years after the Malleus was published. Secular courts, not inquisitorial ones, resorted to the Malleus.
…Lamothe-Langon’s [who’s notoriously forged] trials were the last great piece of “evidence”, and when they fell, scholars re-examined the Inquisition’s role in the Burning Times. What they found was quite startling. In 1258 Pope Alexander IV explicitly refused to allow the Inquisition from investigating charges of witchcraft: “The Inquisitors, deputed to investigate heresy, must not intrude into investigations of divination or sorcery without knowledge of manifest heresy involved.” The gloss on this passage explained what “manifest heresy” meant: “praying at the altars of idols, to offer sacrifices, to consult demons, to elicit responses from them… or if [the witches] associate themselves publicly with heretics.” In other words, in the 13th century the Church did not consider witches heretics or members of a rival religion.
It wasn’t until 1326, almost 100 years later, that the Church reversed its position and allowed the Inquisition to investigate witchcraft. But the only significant contribution that was made was in the development of “demonology”, the theory of the diabolic origin of witchcraft. As John Tedeschi demonstrates in his essay “Inquisitorial Law and the Witch” (in Bengt Ankarloo and Gustav Henningsen’s Early Modern European Witchcraft) the Inquisition still played a very small role in the persecution. From 1326-1500, few deaths occurred. Richard Kieckhefer (European Witch Trials) found 702 definite executions in all of Europe from 1300-1500; of these, only 137 came from inquisitorial or church courts. By the time that trials were common (early 16th century) the Inquisition focused on the proto-Protestants. When the trials peaked in the 16th and 17th century, the Inquisition was only operating in two countries: Spain and Italy, and both had extremely low death tolls.
In fact, in Spain the Inquisition worked diligently to keep witch trials to a minimum. Around 1609, a French witch-craze triggered a panic in the Basque regions of Spain. Gustav Henningsen (The Witches’ Advocate) documented the Inquisition’s work in brilliant detail. Although several inquisitors believed the charges, one skeptic convinced La Suprema (the ruling body of the Spanish Inquisition) that this was groundless hysteria. La Suprema responded by issuing an “Edict of Silence” forbidding all discussion of witchcraft. For, as the skeptical inquisitor noted, “There were neither witches nor bewitched until they were talked and written about.”
For 200 years, leftwing academics have tried to portray persecution of witches as being a Christian invention when Christianity reduced an existing fear of witchcraft and persecution.
“My source on the burning of witches and Jews…”
From a promo for; Wolfgang Behringer’s book A Cultural History of Climate
“In this major new book Wolfgang Behringer introduces us to the latest historical research on the development of the earth’s climate. He focuses above all on the cultural reactions to climate change through the ages, showing how even minor changes in the climate sometimes resulted in major social, political and religious upheavals. By examining how our predecessors responded to climate changes, Behringer provides us with a fresh basis for thinking about how we might address the serious climatic challenges we face today.”
Just sayin’
The issues here are that Jews were persecuted, along with Arabs who had only superficially converted, in great numbers in the late 15th C. This is after the slow reconquest of the Iberian peninsula that was at its peak in the MWP, and 150 years after the great famine in the early 14th C. Many Jews immigrated to Christian countries in Europe. Were they still warm? There is no correlation let alone research to justify climate change as the cause.
As for witches, that period before and after the start of the the Spanish Inquisition was a period when belief in witches was not widespread but was discouraged by the Catholic Church. The Reformation, well after Europe adapted to colder summers, led to a revival in belief in witches. Still, less than 200 officially documented trials and executions, and evidence of only 700 more deaths. Needless to say, most likely an undercount, but not by tens of thousands let alone millions.
And while the accusations read like a bad Friday the 13th sequel, there is more than a hint that this was about drugs, not politics or climate let alone climate driven politics.
“There is no correlation let alone research to justify climate change as the cause.”
I can believe that, I just wanted Andy May to consider the possibility that his “source on the burning of witches and Jews” might not be the most reliable . . The politics of climate change (and “diversity”) being what they are . .
Witches were burned as a renewable and an alternative to fossil fuels.
Unfortunately the resources were mismanaged due to greed and the Witch population completely collapsed.
Modern scientists are attempting to recreate witches as part of the Liberal Arts with the long term objective of one day returning them into the wild to create stable populations.
Probably.
🙂
The through-current in the strait is from the Sulawesi Sea to the Java Sea and does not involve the waters of the three oceans as claimed. And in the interior of the strait, the surface temperature is almost inconsistent with the surface temperature. By ignoring the actual physics of the ocean, paleoclimatology remains imprecise.
But fortunately, many carmakers, such as Toyota, have been aware of their social responsibilities and been devoted to make their models more energy-efficient.
Kevin, Sorry, the literature is very clear about the source water for the Indonesian Throughflow. See the bibliography for the Rosenthal article, also download and read the SM. The SM has much more detail on the source water. Below is a quote from the SM explaining some of it. Remember, some of the core sites are in the Makassar Strait and some in Flores Sea, the source waters for the two are different. Not enough space here to explain it all, you will need to read Rosenthal and his references to understand the complex currents in that area. They vary by season and areally.
For a serious view of throughflow in Makassar Strait see: http://citeseerx.ist.psu.edu/viewdoc/download?doi=10.1.1.898.4697&rep=rep1&type=pdf
Thanks Andy. The new Rosenthal proxy dataset from Indonesia 🇮🇩 is very important. It looks very similar to the Greenland ice core records.
Both (Indonesia and Greenland) strictly local of course – but coincidentally the same.
Both show modern warming to be insignificant compared with early Holocene climate changes. Hard to hear for some.
It definitely makes more sense to break up the world into a few climate zones, research each one’s paleoclimate and plot them separately. I think we would see some regions more affected than others, with a phase differencial as well. This would reveal some interesting science. Creating a world average just homogenizes things too much.
PCman99,
I agree. Although I suspect it would take more than a few. Each zone needs a long history, historical data is important as a check on proxy correlation validity in the past. Each needs a long, high quality, calibrated instrumental temperature record for proxy calibration. And each needs decent proxies.
Three separate, fundamental questions, if I may, please.
Geoff,
Excellent and very tough questions. I’ll answer in 3 comments due to our restrictions on links in posts. #1, recovering from the ice age first.
This is not well understood by anyone, but we get hints from geology and historical data. The long Neoglacial decline to the Little Ice Age was probably due to decreasing orbital obliquity. Top chart attached. This is by Javier Vinos, link here:
https://judithcurry.com/2017/07/11/nature-unbound-iv-the-2400-year-bray-cycle-part-a/
The second chart is Rosenthal’s IWT, the same data I used in this post. The next is the SST in the Indo-Pacific, notice the difference, this has been a big topic in these comments. The IWT reflects climate, and the SST just meanders along. The dips are in the cooler places, but the long-term trend, while down, is not as expressive as the IWT trend. How to interpret this is unclear.
SST from planktonic forams might be moderated by weather and wind, also it is unclear that planktonic forams are a good proxy. Like tree rings, they may adapt, or maybe salinity changes, which occur rapidly in shallow water mess them up, it is hard to say, but while they show dips where they should, the longer-term obliquity-based trend is lost.
As for the Little Ice Age itself, it coincides with the ~980-year Eddy Cycle. Very tight clusters of solar minima occur every 2500 years or so (Bray Cycle) and one occurred in the LIA (Wolff/Sporer/Maunder) This is probably related to a matching solar cycle that coincides with clusters of solar minima. See Javier’s post for the details. We are now beginning a Bray upswing and should expect warming to continue, longer-term. The 1000-year Eddy solar/climate cycle is dominant though, so for the next two or three decades don’t expect a lot of warming until we get out of this low in the current Eddy cycle. Together the two cycles create a climate forcing of 9 to 17 W/m^2, more than the computed CO2 influence. See here for more: https://judithcurry.com/2017/12/02/nature-unbound-vi-centennial-to-millennial-solar-cycles/
#2m Antarctic Ice Cores. I don’t know of any ice core data that is not available to the public, maybe someone else knows? The Greenland Ice Core CO2 data is not all available, most people think it is no good, but Renee Hannon is not so sure:
https://andymaypetrophysicist.com/2020/01/06/greenland-ice-core-co2-concentrations-deserve-reconsideration/
The Antarctic CO2 data may not be very good.
#3: isotope temperature data.
Nearly all isotope proxies are iffy for several reasons. People ignore highly possible systematic errors in this data simply because they cannot quantitatively estimate them. The confidence intervals are computed with Monte Carlo methods that assume the errors are random and the average of the values are the true quantity. When I hear someone did a Monte Carlo simulation to estimate the confidence limits, I use a swear word and hold back the bile.
We only have decent quantitative data for 170 years. Luckily, some of this data is at proxy locations, so the proxies can be calibrated to records that long. In England a bit longer. But that is just one proxy at one location. Many proxies have crappy, short records that are a long distance away – useless.
Even if the proxy has 170 years of nearby data, that is still very short. If the proxy is used for 1,000 years, or longer, how do we know the recent relationship is still valid, we don’t. Unless we have historical data to confirm it or glacial advance/retreat data, it is blind faith. I think we should focus only on those areas where we have good historical and geologic data to confirm the proxies. Alone, before ~1600 or ~1500, without historical backup they are useless.
Thank you, Andy, for these responses. I have several more tough questions, but enough for now.
I followed Javier through his posts on Climate Etc as they appeared. They were interesting, Time for me now to go back and re-read. My comments about availability of ice core data go back some years when I tried to help Steve McIntyre obtain some Law Dome data. He was winding down Climate Audit by then and I never did find out if stuff is still waiting to go into the public domain.
Cheers Geoff S
Figure 1, the 8.2kyr event is warm.
Ulric,
Yes, interesting that. All the Greenland records show it at 6,200BC. The Southern Hemisphere reconstructions show it at 6400 BC for some reason. That was part of what I was trying to say in these posts, the events in the past that we talk about all the time are not synchronous around the world. They vary by latitude and “global is crap, local is good.”
“Southern Hemisphere reconstructions show it at 6400 BC”
Can we see that please?
Figure 1, my first post shows it there:
https://andymaypetrophysicist.com/2021/06/22/global-warming-is-happening-what-does-it-mean/
This reconstruction is based on the only three proxies that are good in the Southern Hemisphere.
Figure 1 (Rosenthal) in this post also shows it there, as you observed.
Remember though, we are only talking about 200 years, all these reconstructions are +-50 years at best, and far more likely to be +-100 years.
When you see multiproxy reconstructions, you don’t see all these differences. It is best to see the proxies individually.
Attached is the Vostok record for the period, it looks weirder.
At least Vostok is in the right direction at 8.2kyr, as with the ~4700-4400 BP period, which was also very cold in Greenland.
Sort of, 8200BP is right in between a cold period and a very warm period.
The 8.2kyr event was global. During the central period the trade winds were very strong, meaning a positive NAO/AO regime. Which explains the widespread expansion of human village settlements then, including in the Indus, Serbia, and southern England. Greenland of course cools with a positive NAO/AO regime.
It was a strong solar period, they occur at the same frequency as grand solar minima series, on average every 863 years. and every fourth one has seen stronger cooling in GISP2. At 6150 BC, 2700 BC, and 750 AD.
Unless and until we characterize the optimum climate for the biosphere we depend upon for life itself, we cannot know whether any climate changes move us towards or away from that level. It is foolish, wasteful and even dangerous to make uninformed guesses about what action we must take. We only have finite wealth to pay for any necessary changes in human society.
Spot on! We definitely need to look into that. It is lost on me that the average global temperature for the past 500 million years is 20C and the current average is 14C. 14C is low historically and unlikely to be optimum. But research is needed to be sure.
Andy,
Excellent post, and there’s almost as much pertinent data in the comments!
You must be right over the target, because the trolls seem to have brought in extra manpower to try and shoot you down! They’ve even sunk to hitting your clarification comments with down votes; a dark and dastardly thing to do!
Stay the course; you’re doing serious damage to their religious edifice!
A great post, and one of the best discussion threads in a long while. Thanks for this!