Clyde Spencer
2021
Introduction
The concept of accuracy and precision is important to the analysis of the Carbon Cycle. To address the background issue of precision and significant figures, let me provide an example.
Let’s assume that one wants to assess the value of their total assets. OK, that seems straightforward enough. For most middle-class people, their biggest asset is the home that they ‘own.’ However, what is the home worth? How much money could you obtain for it in case you need to raise ransom money for your trusty pet chipmunk, Alvin? Well, that depends on how anxious you are to sell, what the current lending rates are, and the time of the year, among other things. Homes usually sell quicker in the Summer. Therefore, it turns out that there isn’t just one number that represents the value of your home. One can assign a range of values that represent a worst-case scenario at one extreme, to the intervention of an angel that wants to buy your home at any reasonable price for some emotional reason. One can hope for the best, but probably the selling price will be somewhere near the middle of the range, which might be a large range. If similar homes in your area have been selling for about $300,000 under similar market conditions, then it might be reasonable to assign a value of $300,000 ±$30,000, which amounts to a range of about ±10%. That is, one can’t say precisely what the home is worth.
We could go through a similar exercise with your other assets, such as car(s), ski boat, coin collection, etc. However, the situation is the same, with, at best, you only being able to estimate a range of values that you could receive for your possessions.
You pull out your monthly bank statement and, as you had anticipated, the bank tells you exactly how much money you have (or had!) in your checking and savings as of the end of the last month. Considering that you may not be getting any interest on your checking balance, and you should know the amount you have written checks for, you do actually know with, high certainty, precisely how much money you have in your checking account! Let’s say it is $5,000.01; you actually got a little interest last month!
The situation is similar with your savings. Monthly changes are miniscule with current interest rates, so you can estimate, probably to the nearest penny, how much money is in your savings. Let’s say it is $500.49; Therefore, your liquid assets are $5,500.50.
However, the only thing of value that you know with any precision is what is in your bank account! And, it is a small fraction of your total assets, and much less than the range in value of your tangible possessions. This is important in considering how well we understand the Carbon Cycle because what is in your bank account is analogous to the anthropogenic CO2 emissions. Let me illustrate with a little more specificity.
You might want to read some things I have previously written on the topics of accuracy and precision.
Carbon Cycle

Fig. 1. Global Carbon Cycle
The above graphic (Fig. 1) was created to illustrate and quantify what is called the Carbon Cycle. It is the relationship between sources and sinks of carbon, principally carbon dioxide. It illustrates the pools, or fixed reservoirs of carbon, and the annual rate of exchange between sources and sinks, called fluxes.
This frequently displayed graphic of the Carbon Cycle leaves out many anthropogenic carbon sources, as I have detailed here. It appears to address fossil fuel sources only. Therefore, the anthropogenic contribution may be larger. However, I’m going to work with this illustration to make a point.
Now, let’s take a detailed look at the numbers in the graphic. The annual flux of carbon into the atmosphere is the sum of the following:
Burning Fossil Fuels 7.7 ±0.05 pg 7.7 ±0.05 pg
Soil Respiration 58. ±0.5 “
Plant Respiration 59. ±0.5 “
Volcanoes 0.1 ±0.05 “
Deforestation 1.1 ±0.05 “ <1.1 ±0.05 “
Ocean Loss 90. ±0.5 “
Total 216. ±2 pg Anthropogenic Total <8.8 ±0.1 pg
The basic unit is petagrams (pg) of carbon, or 1015 grams of carbon.
(Note that “Ocean Loss” isn’t shown explicitly as having 2 significant figures, but because the “Ocean Uptake” is, I will give them the benefit of the doubt and assume that they were just careless. The uncertainty estimates are implied by the significant figures displayed.)
What percentage of the annual contribution of carbon to the atmosphere is anthropogenic? It is, <8.8 (±0.1) / 216 (±2), or <4.1%. A commonly claimed value is about 3%. Therefore, this appears to be in the ballpark, with the greatest uncertainty being how much of the “Deforestation” category is actually anthropogenic. The point is that we know the total with at least an order of magnitude less precision than the anthropogenic component.

Fig. 2. Alternative Carbon Cycle flux estimates.
https://projects.noc.ac.uk/greenhouse_gas_science/
There is an old saw about how if a man only owns one watch, he always knows what time it is. However, if a man owns two watches, he is never sure of the time. That applies here as I show another example.
This graphic, (Fig. 2), is even more problematic. It shows, at the top, an annual increase of 240 ±10 pg. Another way of stating this is 240 pg ±4%. However, I can only account for 207 ±2 pg when I place the displayed values in a table! We are now confronted with an issue of accuracy (agreement between estimates) as well as precision (the number of significant figures).
Now, as I did for Fig. 1 above, the following is a table presenting the estimates from Fig. 2:
Fossil fuels and cement production 7.8 ±0.6 pg 7.8 ±0.6 pg
Soil and Plant respiration 118.7 ±0.05 “
Volcanoes 0.1 ±0.05 “
Land use change 1.1 ±0.8 “ 1.1 ±0.8 “
Water outgassing 79.4 ±0.05 “
Total 207. ±2 pg Anthropogenic Total 9. ±1 pg
Be-that-as-it-may, in this case, the anthropogenic fraction is, 9 (±1) / 207 (±2), or ≈4.%. Let’s assume that the stated flux of carbon (240 pg) and its associated uncertainty (±10 pg) are correct, and either I missed something, or the artist who prepared the illustration left something off the illustration. The uncertainty (±10) is equal to or larger than the estimated total anthropogenic contribution, 9 ±1 pg.
Now, an interesting thing is that the average anthropogenic flux is 9 ±1 pg/yr, while the estimate for the increase of carbon in the atmosphere is about 4 pg/y (No uncertainty provided, ±0.5 implied.). In other words, the increase of CO2 in the atmosphere is the equivalent of about 50% of the annual anthropogenic emissions. Are we sure that we understand the sinks and sources well enough to be certain that the atmospheric increases are one-half anthropogenic? How do the sinks tell anthropogenic carbon from other sources?
It appears then that an amount about half of the anthropogenic flux ends up in the ocean. Actually, some CO2 is used to create new wood and some supports phytoplankton growth and ends up being sequestered in the deep oceans.
If, as I have suggested, the correlation between anthropogenic CO2 and the rising concentration in the air is not proof of the origin, then some other indicator has to be sought. This is commonly the change in the ratio of 13C and 12C isotopes. This is because plants tend to use the lighter, more abundant, 12C isotope. Therefore, a relative increase in 12C is attributed commonly to its release from fossil fuels. There is nothing wrong with this on the face of it. However, other things can influence the ratio – notably, temperature-driven outgassing from water will favor the lighter 12C isotope because it takes less energy to release the lighter isotope. Also, bacteria decomposing leaf litter and other plant detritus will be working with 12C-rich material. Lastly, the upwelling of deep-ocean waters will bring 12C-rich water to the surface, where it will outgas.
I have previously demonstrated that the above accountings for anthropogenic CO2 emissions is probably an undercount. For the purposes of that discussion, I wrote, “I will define ‘anthropogenic’ as any production that is influenced by or created directly by humans from carbon sources that have been sequestered for short or long periods of time.”
The issue of carbon “recycling” is a matter of time scale. Ultimately, everything is recycled on Earth. Even coal beds will be exposed by erosion eventually and either burn or oxidize slowly, releasing carbon dioxide. In the absence of humans, all oxidation processes would continue, but at a slower rate than what humans cause. It is a matter of agency! My original definition included the caveat, “To the extent that biomass is burned to supply heating and cooking, at a rate greater than it is replenished, there is a net contribution of CO2 to the atmosphere that is tied to population. If deforestation of old trees is accomplished by burning to make way for expanding agriculture, then there is a net contribution of CO2 again tied to the expanding population.” The important point that distinguishes anthropogenic from ‘natural,’ is the changing flux created by human activity, probably best measured on an annual scale.
Summary
The statistical correlation between two monotonically increasing properties will be positive, even if they are unrelated. Therefore, the correlation may be spurious. The estimates for anthropogenic carbon emissions is less than the uncertainty in the total carbon flux into the atmosphere in one example, and the annual atmospheric increase is only about half the estimates. Assuming that the anthropogenic carbon dioxide flux estimates are actually valid, it still provides only about 4% of the total flux available for increasing the atmospheric pool, and can’t account therefore for 96% of the increase.
The increase in 12C in the atmosphere is, in my opinion, weak evidence that the annual increases are driven only by fossil fuel sources. The atmosphere can’t tell ‘anthropogenic’ carbon dioxide from natural carbon dioxide. It seems unlikely that a source that represents only about 4% of the total flux is going to drive the system. The oceans sequester the vast majority of the carbon. One would expect that warming oceans (from whatever forcing) would increase the rate of out-gassing in mid-latitudes, and decrease the rate of extraction at high-latitudes. It seems more reasonable to me that, in a world with warming oceans, there would be a shift in the relative amounts of carbon in the oceans and the atmosphere. That would be the case even in the absence of any anthropogenic carbon.
The science is definitely not settled!
I haven’t provided a rigorous analysis of uncertainty because, as is so often the case, actual uncertainties aren’t provided for all the components of the Carbon Cycle.
In a follow-up article, I’ll provide a detailed examination of the atmospheric concentration of CO2 over the last 30 years, and look for the impact of the COVID-19 pandemic on the growth. This should make it more evident why the uncertainties in the input carbon fluxes, and the relatively small size of the human contribution, is important to challenge the claim that fossil fuels are responsible for the growth in the CO2 concentrations. This is important because the common assumption is that cutting back on anthropogenic CO2 emissions will stop global warming. That probably is not true!
Mr. Spencer: Excellent article. Check out my website…especially paper # 3 “where does the co2 go”. My site: http://www.solarvariationdeterminesclimatechange.wordpress.com/
Bob Dillon, M.D. Atlanta
Thank you!. I will check out your website when I get a chance, probably this evening.
Into the soda pop, silly.
Those little cartridges they sell for pellet guns?
And, used with soda bottles to charge any liquid you want into a carbonated drink.
I first saw carbonation of water in the modern set up for the table about 15yrs ago. I was surprised that the dissolution was almost instantaneous. I patented an efficient production system for the high quality battery chemical, lithium carbonate by carbonation of the electrolytically produced lithium hydroxide (itself also a patent of mine.
In the labwork, I was also amazed at the efficiency of the converison of the hydroxide to carbonate using a ring at the base of a tall reaction vessel for introducing CO2. Even at low pressure, recovery of CO2 into the product was ~90%. CO2 and water are very good friends!
Good analysis and report, Clyde! The natural cycles are very underappreciated and, associated with CAGW assumptions, mean that the actual numbers are not known, which is shown by your lack of precision number is larger than total anthropogenic. As an exploration geologist, uranium fixed by charged fluids hitting bitumen, a powerful reductant, in the Neuquen Basin, we figured out that the airborne radiation survey needed to be used in this way: crude oil deposits, usually in porous sandstones or karst limestone, degas rapidly when they reach the surface (or undergo heating). We wanted to match radiation anomalies with black bitumen zones, but the bitumen undergoes the transformation C + O2 =CO2 and they lose they lose the black color rapidly. So I took my trusty assistant, Alexis, and he drove while I peered into canyon bottoms looking for black. Found it! Called the Black Zone, the outcropping uranium values are ore grade. The bitumen? Into the atmosphere! The uranium? Into a reactor for clean electric energy, someday?
Thank you, Ron. I thought that Alexis was feminine. 🙂
It’s a new age, Clyde.
Clyde, is 100% feminine in origin.
Almost more so the most names.
😛
Thank you for your typically valuable contribution.
Whiten is 100% racist in origin.
Almost more than most names.
Unless your first name is…wait for it…Les.
I got myself the new masculine version of Alexis. My wife complains it doesn’t seem to hear a thing she says.
OK, I should admit that my fingers put the ending s on Alexi. I’m only saying this in case he reads this.
Microsoft Spell Wreck routinely changes words, and usually after I have looked at it.
First thought was about CO2 residence time. With photozynthesis at 120 gigaton and loss to oceans at 90 gigaton and atmosphere with 750 gitaton, with these two -2- sinks alone, CO2 has a recidence time of ~3.5 years.
Regards ocean uptake being 92 gigaton (bigger) and release being 90 gigaton (smaller), that can hardly be possible when the ocean is warming (Henry, Dalton).
Oddgeir
There is a problem of dealing with averages of non-linear processes. Most of the absorption takes place in high latitudes, while most of the outgassing takes place in the tropics, and along mid-latitude continental western coasts.
However, I do agree that the the impact of warming water is under-appreciated by those who call themselves climatologists. I’ll have more to say about that in my next guest submission. I’ll note that SciTechDaily recently had an article about the long-term loss of oxygen from water bodies. If oxygen is declining, one would expect CO2 to do likewise, despite claims of decreasing pH.
DOI: 10.1038/s41586-021-03550-y
Clyde.
I think that real data,
the OCO2 satellite data does not support your above claim about CO2 outgassing.
And the other thing:
I do not find it mathematically or otherwise correct to add the uncertainty factors or the accuracy factors the way you have done it in the total.
As far as I know(and maybe I know wrong);
In engineering that will be considered something like an unjustified ‘blasphemy’.
Just saying.
So you know, still your article appreciated.
Thanks.
cheers
Learn how measurement uncertainties combine, read the GUM.
Thanks for your reply.
cheers
“I do not find it mathematically or otherwise correct to add the uncertainty factors or the accuracy factors the way you have done it in the total.”
Nor do statisticians…..
Do you have a citation to support that claim?
Only that when you add statistically independent, distributed parameters, their combined standard deviation is (s1^2+s2^2)^0.5.
What you NEVER do is simply add the standard deviations. A simple mnemonic:
“The variance of the sum is equal to the sum of the variance”.
Do you REALLY need a citation for that? Given – well – you – not rhetorical. Do you?
Did you see my reply to whiten?
I am assuming you meant to say not just distributed, but identically distributed, what the statistician would call IID. But as “Timo the other one” says below, there is also the iron clad rule of tolerance stackup in which we do not know if the uncertainties or tolerances are statistical and in which we most definitely do is “simply add the standard deviations” or tolerances.
For uncertainties, which are *not* standard deviations, whether you add the uncertainties directly or use the root-sum-square method is a matter of judgment, not statistical law.
“For uncertainties, which are *not* standard deviations, whether you add the uncertainties directly or use the root-sum-square method is a matter of judgment, not statistical law.”
Please provide a documented definition of the parameter you call “uncertainty”. Please show us which statistican tells us that we can use 2 completely different methods for evlauting them, depending on our “judgement”.
Variances ADD, when you adding distributed values for independent, symmetrical, distributions, which are what was inferred by Clyde’s lack of any correlation info, and his use of +/-. What else does, and show me the statistical back up.
Folks, increasing vaguity and hand waving to follow…..
Where do you get off on asking Tim for citations when you ignore my request? Can you say “hypocrite?”
Another who needs to read the GUM.
“Where do you get off on asking Tim for citations when you ignore my request?”
I fulfilled your “request”, unless you want me to provide the class notes for the first 5 classes of Engineering Statistics 101. I.e. those that we were exposed to before Thanksgiving of our 1st year at “Mines” school (available right way if you either took High School AP classes or passed USAFI courses in the Seabees).
U2 are working as a 2 Stooges Team. My request is to you as well, since Tim is out of his league and is merely valiantly trying to save you.
AGAIN, feel free to define this Big Foot “uncertainty”, since it must, by your “+/-” definition, have the same units as it’s expected value…
bob,
Glad to see you’re on board with calculating uncertainty by adding errors in quadrature. Maybe you can reach out to Pat Frank and let him know that you are now in agreement with his work on the uncertainty of climate models.
That wasn’t Frank’s major malfunction. Rather, he started with a bad parameter that didn’t even use the correct units.
Oh, that, and he failed to include natural boundary conditions that would have limited his silly error bounding. Interestingly, compared to actual, almost all of the model hindcasts end up at nearly the P50 point of his “error propagation”,
bob,
My bad – you still don’t get it.
Pray elucidate, Frank. Oh yeah, time to vague up.
But hope springs eternal. Pat Frank might yet earn even ONE relevant citation for his ground breaking error propagation discovery. You know, the one that no one above ground except him has realized..
bob,
I don’t do vague. You said earlier:
‘Interestingly, compared to actual, almost all of the model hindcasts end up at nearly the P50 point of his “error propagation”,’
Given that the modelers can all tune their models to the same (data tampered) “historical” record, why is there any spread at all?
Also, from Andy May’s excellent review from Steve Koonin’s book, you might want to mull over the implications of this:
“One stunning problem is that the spread of the [IPCC AR5] CMIP5 ensemble in the years after 1960 is larger than that of the models in CMIP3 – in other words, the later generation of models is actually more uncertain than the earlier one. So here is a real surprise: even as the models became more sophisticated – including finer grids, fancier subgrid parameterizations … the uncertainty increased” (Koonin, 2021, p. 87)
https://wattsupwiththat.com/2021/04/26/unsettled-steven-koonins-new-book/
Love the painting into a corner you all inflict on yourself with your baseless “fact family” of “data tampering”. It’s the all purpose, fact free, baseless diss that keeps you all talking to each other. It’s right up there with the weekly whine about the next layer of scientific or professional organization to admit that AGW is real and real bad.
More and more Branch Davidian every day…
Oh, BTW, whats the “problem” with “One stunning problem is that the spread of the [IPCC AR5] CMIP5 ensemble in the years after 1960 is larger than that of the models in CMIP3 – in other words, the later generation of models is actually more uncertain than the earlier one.”
Even if true, or meaningful, advancement of tech often leads to identification of additional uncertainties. It is a marker of the honesty of the process to admit and use it. But in our case, the “ensemble error” referenced is actually, mostly, for various runs of just one model. So, comparisons to earlier “ensembles” are meaningless.
Bigger pic, Andy May is deflecting from the actual bar we should be using. I.e., are the models fit for the purposes for which they are being used. For at least the last 20 years, hell yes.
Time to retreat back into your fact free, faux comfort zone of “Bbbbuuutttt, the DATA”…
bob,
“Even if true” – do you think Koonin made this up?
“(M)eaningful, advancement of tech often leads to identification of additional uncertainties.” – it’s not the processors, bob, it’s the algorithms
“It is a marker of the honesty of the process to admit and use it.” – What honesty? The modelers didn’t even offer a reason why they change parameterization between hindcasting and forecasting runs.
“But in our case, the “ensemble error” referenced is actually, mostly, for various runs of just one model.” – The term “ensemble” actually and mostly refers to the 30 or so models participating in the CMIP exercise. But if you’re saying the individual models don’t repeat, I’m ok with that.
“But if you’re saying the individual models don’t repeat, I’m ok with that.”
I’m saying that many of “ensemble” lines are from one model, run with differing inputs within the input ranges. Properly weighted, the runs close on reality quite well. So, I’m glad that you’re glad…
https://moyhu.blogspot.com/
bob,
Nice misdirect – you’re learning well from the Master of Same at moyhu. Please note that Koonin referenced CMIP5, not CMIP6, versus CMIP3.
You know why. The models are both inaccurate and imprecise. They are totally incapable of representing all the values of the complex, close to discontinuous, actual values either past or future no matter how much tuning is performed.
Perhaps it’s like a tolerance stack.
And it could be tolerated, I think, if the premise of the assessing estimates for the purpose of a better ‘grit’ in proposition of exploring some idea or assumption is clearly stated.
Which it means that it could also, be bound to acceptance that is not about real data or real measurements, in part or the whole.
Where the quantitative value of some entities there could in the end of the day be/endup as non realistic or even fictional.
cheers
What in the OCO-2 map disputes the CO2 outgassing? It looks to me like there is elevated CO2 across the globe in the tropics.
https://ocov2.jpl.nasa.gov/galleries/data-products/#images-47
From the book “An Introduction to Error Analysis,” Taylor (1982), p.45:
A more precise method is “adding in quadrature.” However, considering that most of the flux uncertainties were of low quality, and adding in quadrature is only justified if the addends are independent and random. I’m not sure that they are because of all the obvious feedbacks. Simple addition may be an upper-bound, but is probably justified in this case.
Sorry to say this,
but you denying reality of the data.
It is not the streangth of
outgassing in tropics.
It is strongly outgassing in polar regions, a strong clear one signal according to observations, a clear strong seasonal one,
which you clearly know but do not accept, because any explanation you will try to offer as a support to your claim, will be meaningless…
and non valid.
Yes it supposes to be as you claim, but it is not…
in reality.
cheers
During the Fall through Winter season, the ice impedes gas exchange in the Arctic. In the Antarctic, the bedrock is even more effective! During the Summer, when the ice recedes and the water is exposed, allowing exchange, there is NO net increase in Northern Hemisphere CO2.
Every description of the process of CO2 exchange I have read remarks that the cold water at high-latitudes is an effective sink for CO2, and the dense, cold, CO2-enriched water descends to the depths and then moves towards the tropics. We obviously inhabit different ‘realities.’
The OCO-2 map I provided a link for shows a strong CO2 signal off the SE corner of Greenland, approximately at the terminus of the Gulf Stream. It is not apparently characteristic of the Arctic as a whole.
Man, all due respect to your explanation,
but you must know, it does not hold any meaningful value if contradicted by the data,
and when in the same time not the only one standing or remaining there.
There is many other explanations, which may not be contradicted by the data,
which clearly take precedence before yours, regardless of how smart yours may seem or sound.
It is the way it is, friend.
Your explanation still stands as a contradiction to the reality, as for the given observations.
No matter how smart.
Has no meaning or priority unless the only one remaining there.
My guess, in this conversation of ours,
is more like in the line;
“that even when your approach in this conversation of ours may seem, by some pretence, like an
‘appeal to authority’…
it is more like in the lines of an ‘appeal to the echo chamber’.
cheers
In other words, if my data and explanation doesn’t agree with your view of the world, then I’m obviously wrong.
Have you even bothered to look at the OCO-2 map?
The reality, as far as the OCO2 data, concerned, disagrees with your taken position.
It isn’t me or my view point that disagrees with your claim.
It is the observations data that does.
And still I will be bound to accept explanations like yours, but only in premise of considered as within the scientific method.
cheers.
Clyde, don’t waste time on the well known empty vessel detractors that accumulate around good work like yours.
“In other words, when one adds or subtracts any number of quantities, the uncertainties in those quantities always add.”
Apparently he was trying to make the point that we don’t reduce the uncertainty parameter when we subtract expected values. Poorly. Which is probably why your quote did not appear in the next edition….
https://www.niser.ac.in/sps/sites/default/files/basic_page/John%20R.%20Taylor%20-%20An%20Introduction%20to%20Error%20Analysis_%20The%20Study%20of%20Uncertainties%20in%20Physical%20Measurements-University%20Science%20Books%20(1997).pdf
No, he explicitly provided an example showing addition of uncertainties. What I quoted was his summary, after the example.
No, the statement is still in the 2nd edition, in the middle of page 50. It is common for page numbers to change when a new edition is published!
The issue is that simple addition is a first-order approximation to the total uncertainty when the uncertainty data don’t meet the requirement of being independent and random, or one has no way of knowing.
Don’t you get tired of being wrong?
“No, the statement is still in the 2nd edition, in the middle of page 50.”
The rewritten sentence even more clearly is written ONLY to make the point that you don’t reduce uncertainty parameters when you you are subtracting their expected values. He is NOT approving of the instatisticate idea that you can ADD uncertainties with the same units as their expected values. Every point he makes before and after undermines your hysterical assertion that ANY uncertainty parameter with the same units as the expected value parameter can be additive.
“No, the statement is still in the 2nd edition, in the middle of page 50. “
As I said, that rewritten “statement” is even more indicative of the point Taylor was trying to make. I.e., you don’t reduce any “uncertainty” parameter, when you subtract expected values. But feel free to point out any examples of Taylor actually adding any such uncertainty parameters, with the same units as their expected values.
Important folks. it goes to the heart of Clyde’s statistical, Wild Places, unrooted, outlook..
“No, he explicitly provided an example showing addition of uncertainties. What I quoted was his summary, after the example.”
Continue to read, starting on p58. This is where he clarifies the actual methodology of adding “uncertainties”. In addition, he uses them as standard deviations or standard errors, because they are. In spite of your hand waving, that is what you are writing about….
Bigger pic, I think you know this, but are, intentionally or not, blocking out inconvenient facts. That’s why you start out quoting, but later only indirectly refer.
OK, for the sake of the argument, I’ll assume that ‘adding in quadrature’ is the only ‘correct’ methodology. How are uncertainties to be handled when the addends don’t meet the criteria of being random and independent, or one doesn’t know whether they do or not? Do you pretend to be a post-modern climatologist and ignore the uncertainties?
My epiphany came when I learned that 97.3% of “climate science” statistics are just made up out of thin air.
In the end, whatever number we come up with is either right or wrong, so it’s 50/50, anyhow.
And if we take the average of those possibilities, we are right in the sweet spot.
Climastrology has it’s own maff, and it is easy to learn.
Oddgeir,
A warming ocean surface releases about 16 ppmv/K (confirmed by over 3 million seawater samples). Increase since the LIA: about 13 ppmv by warming ocean surface.
Human emissions: over 200 ppmv since 1850
Increase in the atmosphere: over 100 ppmv since 1850
If the CO2 pressure in the atmosphere (410 ppmv *) is higher that the equilibrium CO2 pressure for the current ocean surface temperature (290 ppmv), then CO2 is pushed into the oceans, not reverse…
(*) ppmv is volume in parts per million in dry air. Is appr. the same for its partial pressure in μatm, but that is in real, wet air.
“A warming ocean surface releases about 16 ppmv/K (confirmed by over 3 million seawater samples)”
Link to a half decent 3 million seawater samples study?
Else, below according to oldschool Henry and Dalton:
https://www.engineeringtoolbox.com/oxygen-solubility-water-d_841.html
4th chart. Note it doesn’t state which form of water, so let’s limit the postulate to say the chart shows actual seawater (as opposed to artificial seawater aka “a brine” or freshwater):
For the temperature span in question (0-20 degrees C), there is a change in solubility of 3.3-1.7=1.6 gram per kilo seawater over 20 degrees or if you will, 0.08 gram per kilo and degree.
Weight of 1.335 billion cubic kilometers ocean at 1.025 sg is 1.368375E+e21 kg
Times 0.08 gram per kilo yields a weight of 109470 gigaton of solubility change per degree K
https://en.wikipedia.org/wiki/Ocean_storage_of_carbon_dioxide
“39,000 GtC (gigatonnes of carbon) currently reside in the oceans” (169,000 gigaton CO2)
http://www.seafriends.org.nz/oceano/seawater.htm#composition
28ppm=28 mg/ltr Carbon in 1.335 billion cubic kilometers yields 137060 gigaton CO2
Sillymathematics:
1 degree Kelvin temperature increase can release more CO2 from the ocean than there is CO2 in the ocean (or indeed any form of Carbon to feed a conversion to CO2)
The ocean temperature change required to shift solubility in our oceans to release 100ppm CO2 (783 gigaton) is 783/109470=0.00715 degrees K (C)
Conclusions:
-the numbers are wrong (rate of solubility change, hence Henry, Dalton are wrong)
–never the less, even an unmeasurable temperature change, shifts solubility with mind-numbing amounts
We are in a constantly changing CO2 flux which depends on pCO2 which in turn depends on temperature.
“If the CO2 pressure in the atmosphere (410 ppmv *) is higher that the equilibrium CO2 pressure for the current ocean surface temperature (290 ppmv), then CO2 is pushed into the oceans, not reverse…”
Back to Henry, Dalton:
When temperature increase in our oceans release CO2, the pCO2 changes both in the CO2 denser atmosphere as in the warmer ocean. There is no steady state, both CO2 and pCO2 change with temperature.
Oddgeir
I haven’t verified Englebeen’s claim because the solubility of CO2 in sea water is far too complex to rely on just Dalton and Henry. I haven’t been willing to invest the time to go through it thoroughly. Changing pH and temperature, which can occur with evaporation, can shift the solubility of bicarbonate, carbonic acid, and actual CO2. Englebeen generally seems to understand the details of the issue, but I’m not convinced that he as integrated all the details of a very complex relationship.
Oddgeir,
The solubility of CO2 in fresh water with temperature is known too:
https://www.engineeringtoolbox.com/gases-solubility-water-d_1148.html
fourth graph.
That is for 1 bar CO2 pressure in the atmosphere.
For Henry’s law, it doesn’t make a difference that it is fresh or seawater. But that is only for the pure, dissolved CO2/carbonic acid. Not for bicarbonates and carbonates. These are in chemical equilibrium with each other and the dissolved CO2. The result is that seawater can dissolve about ten times the amount of CO2 than in fresh water, that is the Revelle/buffer factor for CO2 in seawater. Inorganic carbon species in seawater (DIC) are about 1% pure CO2, 90% bicarbonates and 9% carbonates.
At the other side, a 100% change in the atmosphere is responded with only a 10% change of total DIC in seawater. There still is a 100% change in dissolved pure CO2/carbonic acid, but the other reactions also increase H+ and that pushes the equilibrium back to pure CO2.
Then your calculations… You forgot to take into account that the graphs are for 1 bar CO2 in the atmosphere, while the real partial CO2 pressure in the atmosphere is 0.0004 bar or 400 µatm. A small difference.
Next, only the “mixed layer” of the oceans is involved, lucky for us not the deep oceans, or CO2 levels remaining in the atmosphere with seawater at 5ºC would drop to glacial conditions…
The mixed layer contains about 1000 PgC, not much higher than in the current atmosphere at 800 PgC.
For the current about 15ºC average seawater temperature the equilibrium CO2 pressure of the seawater would be around 290 µatm. That means that if the pressure in the atmosphere is higher than 290 ppmv, CO2 will be pushed into the oceans and reverse. That doesn’t need much CO2 exchange:
The total amount of CO2 in the atmosphere changed with about 40% or 240 PgC over 170 years, to bring the ocean surface in equilibrium, it needed only 40 PgC over the same 170 years, or from 1000 PgC to 1040 PgC.
That brings us to your next error: a change in temperature of the oceans doesn’t bring massive quantities of CO2 in the atmosphere, only what is needed to bring the partial CO2 pressure (pCO2) in the atmosphere back into equilibrium with the pCO2 of the oceans.
Once the pCO2 of atmosphere and ocean surface are equal, the net exchange is zero, no matter how much is remaining in the oceans or atmosphere.
About the samples, about 1 million in 2001, see:
https://www.pmel.noaa.gov/pubs/outstand/feel2331/exchange.shtml
and following very interesting pages…
Meanwhile over 3 million samples were taken.
To compensate the pCO2 measurements of seawater on board of commercial and research vessels for the difference in temperature at the inlet “in situ” and at the measurement device (the equilibrator), they use the following formula:
(pCO2)sw @ Tin situ = (pCO2)sw @ Teq x EXP[0.0423 x (Tin-situ – Teq)]
If you try that for a difference between 15ºC and 16ºC , for 290 µatm you will find about 16 µatm change…
Don’t get me wrong as I’m the first to say that the climate “crisis” is a scam, but the atmosphere is no longer in equilibrium with the ocean. There’s no doubt that the atmosphere’s CO2 concentration has risen from ~280 ppm to 415 ppm in less than 150 years and there hasn’t been near enough time for that increase to mix into the deep layers of the ocean – that will take perhaps many, many hundreds of years. The surface of the ocean approaches equilibrium but doesn’t quite get there as surface water slowly mixes with the deep. So as the ocean’s total dissolved CO2 can only slowly come up to equilibrium, the (disequilibrium) concentration gradient can (and does) drive CO2 from the atmosphere into the ocean despite the ocean’s surface layers getting (slightly) warmer.
“but the atmosphere is no longer in equilibrium with the ocean”
Never has been, never will be. That would require not only lack of climate change, it would also require lack of weather.
As I can agree CO2 concentrations have risen from (cold, horrible LIA-dominated) 280ppm to (post-LIA) 400ppm, that temperature increase has shifted our ocean’s CO2 solubility.
If you calculate on that solubility change, there you have all your CO2 and more.
So you’re wrong: As ocean’s dissolved CO2 slowly decrease to equilibrium, temperature increase drive CO2 from the ocean to the atmosphere.
Eventually the partial pressures of CO2 in atmosphere must balance that of the ocean. You can NOT expect ocean’s CO2 partial pressure to decrease if you put more CO2 into it, but you can expect the opposit, a decrease in ocean’s partial CO2 pressure as oceans degass CO2 to increase the concentration in the atmosphere.
Oddgeir
Oddgeir,
From observations, it is easy to show that you are completely wrong.
There are a few stations where the carbon content (DIC) of the ocean surface is monitored over a few decades and all of them show that DIC is INcreasing, while the pH is DEcreasing.
That means that the CO2 flux is from the atmosphere into the oceans, not reverse…
See the graphs in:
https://tos.org/oceanography/assets/docs/27-1_bates.pdf
It’s not our ignorance about the carbon cycle that makes CAGW impossible (though our ignorance is great). It is our knowledge of carbon cycle that makes human contributions irrelevant. Great article. Thanks
Thank you.
Yes, … but if it saves just one coral life.
Anything is justified if it saves just one polyp’s life!
I recall Chaamjamal who posts here regularly has a Monte Carlo analysis showing the problem with carbon cycle.
Yes sir, I do. I posted the link here and hopefully it will be approved soon.
Well-done, Clyde.
There are old coal mines all over the western U.S. that are on fire, with no way to extinguish them. A lot of them just smolder at vents, burning slowly underground in oxygen-starved states. Do these count as “anthropogenic”? Or natural?
…and then there’s the New Jersey underground peat fires that have been going for decades.
I grew up in MD, a feral arborous childhood (when not is school). I’ve been back for 25 years. I can tell you for a fact that the fields, borders, and understory are twice as thick/verdant as they were when I was a child. We use to be able to move largely unobstructed in a woods of 40 year old oak, poplar, gum, and of course beach, seeing out >100 yards. Now, the holly and other understory trees are coming up in the oldest, darkest summer forests. My kids have little interest in wandering through this jungle. I’m so sad that no one was collecting, organizing, this change in a quantitative way. But I can assure you in the eastern deciduous forests, there is far more carbon being captured that in the late 1960’s.
As an interesting aside, I spent a number of years as a child living in northern Illinois. Our house was sited on a hillside that was a glacial esker. Across the road was a swamp about the size of a football field. Talking with the descendants of the farmer that used to own all the land, apparently the swamp used to the farmer’s haying field. A lightening strike ignited the lignite below the surface. It supposedly burned for several days before intersecting a spring or the water table. I can confirm the presence of the lignite because I had dug holes between the edge of the water and the road. The haying field had apparently been a small glacial lake that filled up with eutrophication.
Thirty years later I returned to visit my childhood home. To my surprise, despite federal laws protecting wetlands, the swamp had been filled in, probably in the hopes of building homes there. “What goes around, comes around?”
Yes, in west central Colorado, exposed coal seams are ignited by lightening, and go on to burn underground, and often cannot be extinguished. Anthropogenic, NOT!
“exposed coal seams are ignited by lightening“
Not
You seem to be pushing a rock uphill. Do you have any evidence to support your claim?
http://wattsupwiththat.com/2015/05/05/anthropogenic-global-warming-and-its-causes/
I believe that he is pointing out your misspelling of the word lightning.
Yes, after being admonished by Stokes, I see that. Being cute and cryptic takes a toll on communication.
Thank you, Monte.
As I suggested, the classification as to anthro’ or natural should reflect agency. The coal fire burning in Australia for thousands of years was apparently started by a lightening strike. I’d call that natural. However, the fires in China, where Man created the access to the coal seams, I’d call anthro’.
If you go to the link I provided, where my very first Watts Up With That guest article discusses anthropogenic sources not usually considered, I talk about coal fires.
Ah, I missed this one, thnx.
“The coal fire burning in Australia”
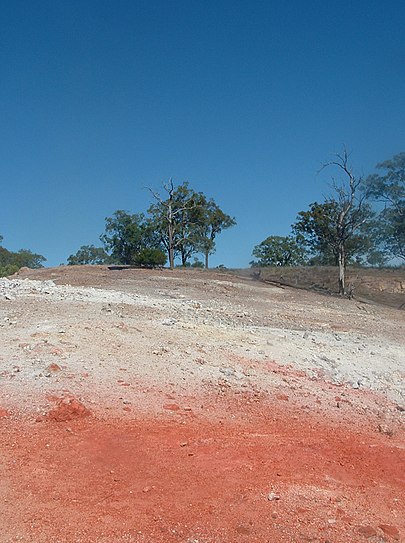
Nobody here tries to quantify these sources. They are tiny. Here is a picture of Mt Wingen in Australia. Note the size of the trees.
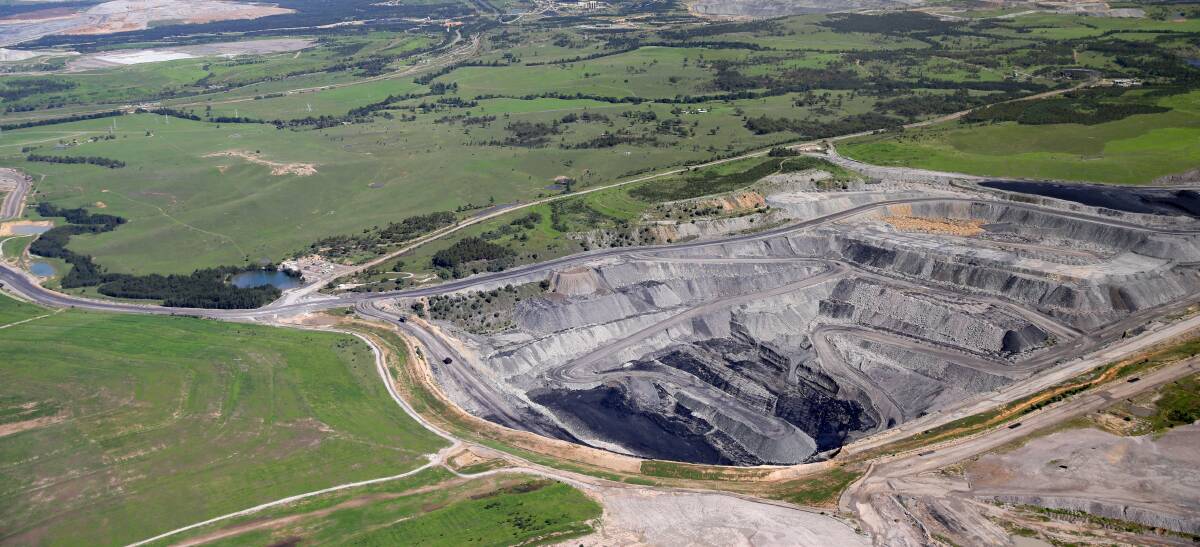
And here is a picture of the nearby Glendell coal mine. Note the size of the trees. All that coal was burnt in far less time than Wingen has been burning.
And you really ought to catch up on how to spell lightning.
OK, you got me there Stokes! I misspelled lightning. I’m not perfect. I’m glad you pointed out such an important thing.
It seemed that it was causing misunderstandings.
Another Nick Stokes NitPick(TM).
I see nobody is interested in the main point.
We learned that technique from reading your posts.
Hows your horse ranch, wooden wagon wheel and candle factory coming along these days? You’re going to need it when humans stop using fossil fuels.
Who cares is the real answer but given it’s you Nick let pick humans.
Why because we were going to burn any coal in a coal mine anyhow it just didn’t play the game and burnt before we wanted.
It’s like all the Kuwaiti oil fires the oil was going to burn anyhow just a bit later than it was.
Few more tonnes of CO2 in the air for you to obsess over is sort of a win/win. The sad part is you won’t be around when this all plays out.
The main point being that natural coal fires supposedly produce negligible CO2?
I used the Australian case to point out that coal fires do occur naturally and may burn for thousands of years. Any single one doesn’t contribute a lot. However, bituminous, lignite, and peat fires exist throughout the world. Probably of greater concern are coal fires in China that are the unintended consequences of mining, which don’t go into the emissions accounting, and are almost impossible to extinguish.
Did you read my first submission,
http://wattsupwiththat.com/2015/05/05/anthropogenic-global-warming-and-its-causes/ ?
NASA’s OCO-2 Mission to study CO2 fluxes via global satellite measuring was launched in 2014 with much fanfare. The climate scammers expected it to confirm great clarity the truth of humanities fossil fuel sins against the Climate.
A major set of papers from the OCO-2 science team were published in 2017, using 2 full years of data, a period of a strong ElNino ENSO event. The papers landed with a resounding thud of silence from the climate scam community.The OCO-2 data suggested major errors in the scam’s main carbon scriptures, scriptures based on a holy climate canon called the Berne model.
Is it Any wonder why we never hear anything more about OCO-2?
“Is it Any wonder why we never hear anything more about OCO-2?”
I think one thing we can be sure of is they don’t publicize this OCO-2 information because it doesn’t fit the CAGW narrative. If it confirmed the narrative, then they would be spreading it far and wide.
My version of the wayback machine…
This is from the OCO2 gallery as was.
Take screenshots whatever whatever to preserve it – NASA have completely disappeared it and the new version of the OCO Gallery is impossible to read/decipher garbage
Seemingly they cannot see the rainforests any more because of ‘clouds’
Looking through them, its fairly obvious that vast amounts of CO2 is coming from the big forests.
Crazy as it seems, I assert that that is simultaneously the cause of Global Greening and the rising CO2 and rising sea levels, where they are seen to be rising.
Because, all the stuff regarded as ‘pollution’ ## is in fact = ‘Fertiliser’
Fert for the plants on this Earth (makes them greener, bigger and more of) but especially the pollution fertilises the soil bacteria.
In response they create:
## Pollution = water soluble Nitrogen and Sulphur oxides, plus Potassium and Phosphorus from dust blown off farmland plus Soot = Biochar by any other name and = epic soil improver
Minor niggles I ain’t got my head around:
Thank you Peta – I posted this more than a decade ago:
https://wattsupwiththat.com/2009/02/24/bad-week-for-hardware-orbiting-carbon-observatory-satellite-burns-up/#comment-80606
To all who are interested in natural CO2 cycles (there are several):
Please examine the 15fps AIRS data animation of global CO2 at
http://svs.gsfc.nasa.gov/vis/a000000/a003500/a003562/carbonDioxideSequence2002_2008_at15fps.mp4
It is difficult to see the impact of humanity in this impressive display of nature’s power.
In the animation, does anyone see the impact of industrialization? USA? Europe? India? China? Anything related to humanity?
The animation does make it look like we Canadians and those pesky Russians (our favorite hockey victims) have lots of heavy industry emitting megatonnes of deadly CO2 in the far northern Arctic. NOT!!! It’s natural!
Still, as Ferdinand Engelbeen points out, annual CO2 concentration keeps increasing at ~1.5ppm/year – even as CO2 fluctuates by up to 16ppm/year in its natural seasonal sawtooth pattern. Ferdinand’s makes this “material balance argument” and I suspect it is deeply flawed. Richard Courtney explains its shortcomings better than I do.
Questions for discussion:
1. IF atmospheric CO2 declines in the coming years contemporaneous with global cooling (or soon thereafter), what does this demonstrate, if anything?
2. IF atmospheric CO2 continues to increase in the coming years contemporaneous with global cooling, what does this demonstrate, if anything?
3. If CO2 drives temperature as the IPCC alleges, how is it that the only signal apparent in the data is that CO2 lags temperature by ~9 months? See
icecap.us/images/uploads/CO2vsTMacRae.pdf
4. Is the aforementioned ~9 month lag in CO2 after temperature consistent with the ~600 year average lag in CO2 after temperature as observed in ice core data?
Best regards, Allan 🙂
Moderator – apologies – I tried to eliminate this duplicate post but failed..
Apparently one needs a wooden stake – mountain ash reportedly works best.
I always wondered why we never hear anything about the results from OCO2. All I remember were some colorful graphics. JPL presents a public lecture each month about upcoming missions and results from past and ongoing missions. Tgere was a talk on OCO2 before launch but nothing about results.
Interesting that OCO1 never made it to orbit due to a launch vehicle failure.
The real boo boo by NASA was recording the Great Greening ^тм, that flipped the “price of carbon” irretrievably negative. Benefits outstripped the phony costs beyond repair.
As with OCO-2, Climate Wroughters were struck speechless by the Great Greening. Decency and demand eventually brought out ‘the reasons’ why this was terrible for the planet – less nutricious food, gonna sequester a whole lot of CO2 that will then become bigger CO2 emission sources… yeah it was half-hearted baloney and soon silence resumed.
Yeah, Trenberths famous updated global heat budget says that there’s an imbalance
of 0.9 W/m² derived from all the incoming and outgoing radiation: Reflected by clouds, Reflected by aerosols, Reflected by atmospheric gases, Reflected by surface, Absorbed by the surface, Absorbed by the atmosphere, Thermals, Evaporation, Transpiration, Latent heat, Emitted by clouds, Emitted by atmosphere, Atmospheric Window, AND Back radiation!
Uh huh, precision to a tenth of a degree for the whole shebang.
Then there’s the opening statement from the IPCC’s AR4 Chapter 5 that says
The oceans are warming. Over the period 1961 to 2003, global ocean temperature has risen by 0.10°C from the surface to a depth of 700 m.
Really? Not 0.11 and not 0.09 but 0.10°C over a 42 year period.
Makes yer eyes roll it does.
“Over the period 1961 to 2003, global ocean temperature has risen by 0.10°C from the surface to a depth of 700 m.”
A measurement of 0.10°C is most likely the uncertainty of the measurement itself!
The uncertainty of the measurement is way more than one tenth.Even the Argo floats have a +/- 0.5C uncertainty. When you start averaging them the uncertainty grows by root-sum-square.
In college physics labs, we would get points deducted for expressing a measurand to greater precision than the measuring instrument’s capability. And a little nasty note along with it.
“But, but, but when I compute the average of all my measurements I get a long string of repeating decimals”
But then when I took physics lab I was reduced to the precision of my eyes reading a slide rule scale so …
My position is that CO2 Air/Ocean ratio’s out in the ocean based on oceanic temperature.
Per the graph above, and previous research 93% of the general terrestrial carbon is in the ocean and 2% (1.8%) in the atmosphere. This is a ratio of 50:1
Long term, this ratio should remain constant with minor changes due to ocean water temperature which might cause more sequestration or outgassing.
thus, only about 1 of 50 anthropogenic CO2 molecules actually will end up in the atmosphere.
The upper ocean is about equivalent to the atmosphere, and is where the fastest mixing/exchanging occurs which is where the approximate 50% of our emissions appear to be sequestered. But longer term, 93% will eventually be sequestered.
It is really a matter of determining how long that sequestration will take to get into the deeper ocean.
You are right, at the end most of all human emissions will reside in the deep oceans. The main problem is that the deep oceans are rather isolated from the atmosphere and only a limited amount of CO2 (40 Pg/year) is going into the deep oceans an back and you need an unbalance in sinks and sources to push some extra CO2 into the deep oceans…
The current sink rate is about 2%/year from the pCO2 (partial CO2 pressure) difference between what is in the atmosphere and the equilibrium pCO2, which for the current average ocean surface temperature is around 290 ppmv.
One Big Question in carbon cycle is the question of the residence time of radioactive C-14 from atmospheric testing of H-bombs and its relationship to how long does a “pulse” of CO2 added to the atmosphere stay there. They are not the same, but why?
If there is an excess of C-14 in the atmosphere, those CO2 molecules will diffuse into the ocean, and non-radioactive CO2 from other isotopes will diffuse into the atmosphere to replace those molecules, and the residence time (“e-folding time) will appear to be short — on the order of 7-10 years.
A bulk “pulse” of CO2 added to the atmosphere, however, will not be absorbed into the ocean at the same rate. This is because the oceans absorb much more CO2 than is dissolved in water by the linear Henry’s Law relationship. The ocean absorbs CO2 into chemical reactions producing “soluble carbonates”, a chain of reactions that on average follows a 10th power relationship instead of a linear 1st power relationship. The approximate effect for a small, bulk “pulse” is that for every 10 units of bulk increase in CO2 concentration in the atmosphere, there will be 1 unit of bulk increase in CO2 concentration in the “mixed layer” of the ocean.
This is not to say that the ocean “sink” is going to “fill up” and not accept any more CO2 anytime soon — the ocean is vast compared to the atmosphere, even account for “mixed” and “deep” ocean layers.
A second Big Question is the size and location of the reservoir from which “temperature stimulated emission of CO2” occurs. The Keeling Curve for the measured atmospheric CO2 appears to be inexorably trending upwards over the years and decades since when that measurement was first taken, again, with only half of the emitted CO2 appearing in the long-term trend that many people are so worried about.
Superimposed on the long-term trend are annual and multi-year changes that are large compared to both the long-term trend and to human-caused emissions.
Murry Salby claims that the correlation between “global temperature” and “net CO2 emissions from human and other sources”, that is, the instantaneous slope of the CO2 curve, that this correlation “occurs at all time scales.” Pieter Tans, the go-to Carbon Cycle scientist at NOAA, claims that the correlation is only over a 1-2 year time scale. Salby claims that the preponderance of the CO2 increase in the atmosphere is natural in the form of the thermally stimulated emission with rising global temperature over the entire 20th century. Tans claims that the preponderance of the CO2 increase in the atmosphere is human caused because the temperature-driven CO2 emissions are only short term, claiming that they mainly come from a shallow carbon reservoir in the leaf litter of tropical forests.
Salby gets the ocean sink wrong, not accounting for the difference between equalization in concentration of different isotopes driven by diffusion at the air-water interface and the absorption of a bulk CO2 increase through the chemical reaction chain characterized by Roger Revell — the 10-th power “Revell Constant.” Correcting for that, I come up with a carbon cycle model where only half of the long-term increase in atmospheric CO2 can be attributed to human, industrial and agricultural activity, with the remaining half the CO2 increase being the result of the long-term warming trend.
Furthermore, the “Berne Curve” claims that the bulk residence time of increases in atmospheric CO2 is at least 200 years. My calculation of the residence time based on a carbon-cycle model in the absence of a temperature-driven natural CO2 emission is about 50 years, which is a number that I think that Ferdinand Engelbeen agrees with. Taking into account a temperature-stimulated natural CO2 emission, not only is only half the increase in atmospheric CO2 human-caused, the residence time comes down to 25 years. The reason for that is that the temperature-stimulated emission, accounting for wide fluctuations from the long-term trend, has to be balanced by the “greening effect” where plants take up more CO2 with increased concentration, otherwise, the long-term CO2 increase would exceed what is observed.
My calculations are based on a much larger carbon reservoir from which the temperature-stimulated emissions are happening than Pieter Tans assumes. My hunch is that this reservoir is primarily in temperate-zone soils, which contain the required amount of carbon. The reason I am thinking soils rather than ocean water is that the long-term global temperature trend is larger in the atmosphere than in the oceans. One factor that could persuade me to consider an ocean source is variation in the strength of mixed-layer deep-ocean missing owing to changes in ocean currents.
Paul, two remarks:
The decay rate of an excess 14CO2 is much shorter than for an excess 12CO2 for a different reason than you think.
Take the atmosphere in 1960, at the peak of the 14C height after the atomic bomb tests:
What goes into the deep oceans is the composition of 1960 (minus the isotopic changes at the air-water border). What comes out of the deep is the isotopic composition of ~1000 years before. Net difference: only 45% of 14C returns the same year as was absorbed.
For an excess 12CO2 in 1960, about 97.5% returned the same year.
Which makes that the decay rate for an excess 12CO2 amount is much longer than for 14CO2… (decay rate being something different than residence time, the latter is a matter of exchange rates, the first a matter of mass change…)
There is no larger carbon reservoir involved: even soil carbon needs oxygen before it is turned into CO2 and the oxygen balance is near always positive, that means that more O2 is formed than used and thus more CO2 is absorbed than released by the total biosphere, including soil respiration…
http://www.bowdoin.edu/~mbattle/papers_posters_and_talks/BenderGBC2005.pdf
That is only approximately true because the bottom water is subject to a constant addition of ‘snow’ along the path from high latitudes to the equatorial region. I don’t know how long it takes detritus to fall through the water column from the surface to the abyssal plain, but it is probably only a few years at most. Thus, the 1,000-year old water is constantly being ‘diluted’ with more modern carbon-isotope ratios.
Indeed there is a loss of 14C during the long transfer between sinks and sources via the deep oceans and an addition of fresh 14C from organics and inorganics dropping out of the surface.
In the past there was an equilibrium between newly made 14C by cosmic rays (influenced by sun’s activity) and the loss in the oceans, that was both around 10% of pre-1940 levels.
The use of 14C-free fossil fuels needed correction tables for radiocarbon dating from about 1870 on, as the 14C levels dropped in the atmosphere and after 1960 again a new correction for the 14C doubling from the atomic bomb tests…
If that were true, one would not see the strong seasonality in the CO2 variations.
Clyde, the seasonality is mainly in the extra-tropical deciduous forests of the NH. The year by year (El Niño) variability is mainly in the tropical forests…
As measured at MLO.
I don’t remember mentioning El Niño.
Clyde, the influence of ENSO and large volcanic eruptions like the Pinatubo is visible in the year by year variability in CO2 increase rate.
Both seasonality and year by year variability are dominated by vegetation, but at different parts of the world…
Here the year by year variability:
Great post. Thanks.
My 2 cents on the responsiveness of atmospheric CO2 to fossil fuel emissions.
https://tambonthongchai.com/2020/11/21/the-case-against-fossil-fuels/
You’re welcome! Thanks for the link.
There is already a fatal flaw in your exposure with the following sentence:
This positive constant as a retained fraction implies that atmospheric composition is responsive to fossil fuel emissions.
Nobody says that, not even the IPCC. The retained fraction is the difference between human emissions and the sink rate. The latter is totally independent of human emissions of one year and in complete linear ratio with the pCO2 difference between the measured pCO2 in the atmosphere and the equilibrium pCO2 of the ocean surface for the current average ocean surface temperature (around 290 ppmv).
If human emissions halved over a year, the retained fraction would be zero. If there were no human emissions at all, then there was a net sink of CO2 in the atmosphere…
The fact that it was about half human emissions in the past 60 years is pure coincidence, as result of a quite linear increase in human emissions over the years.
Be sure not to miss my next submission.
Chaamjamal
I liked your article. Unless you have objections, I’ll link it in my next article.
I think this statement is problematic:
“it still provides only about 4% of the total flux available for increasing the atmospheric pool, and can’t account therefore for 96% of the increase.”
I agree with your quite rigorous analyzis, that anthropogenic CO2 might be about 4% of the influx into the atmosphere.
However, I think you should correct that statement for the outfluxes from the atmosphere as increase should be something like
Increase = influx (natural + anthropogenic) – outflux (natural + 0)
and the anthropogenic account then should be something like .
influx (anthropogenic)/ Increase , right?
But of course given the uncertainties it might make sense to calculate this ratio for best and worst case numbers
Actually, that is not quite true. Concrete absorbs CO2 over decades. Extracted CO2 is sequestered in the pressurization of declining oil fields. Purposeful sequestration, although negligible currently, is still not zero. The creation of large hydroelectric projects creates sinks for CO2 that should be assigned to “anthropogenic.” Lastly, there are many industrial uses for CO2 and when the CO2 is either extracted directly from the air or flue gasses, it becomes part of the anthropogenic outflux.
P.S. IF anthropogenic CO2 is responsible for the 18%(?) increase in vegetation documented by NASA, then I think that the CO2 taken out by the new vegetation could be added to your zero in the outflux, as well as the things I mentioned initially.
Clyde, doesn’t make any difference in the balance: If one assumes that near the total increase is from human emissions, then the total increase in sinks is also caused by human emissions. The latter is only average 50% of human emissions and still all increase in the atmosphere is caused by human emissions…
“If one assumes that near the total increase is from human emissions”
I don´t think he assumes that here.. he rather insists that the uncertainties are too big to be certain about such things.
Thus his correction might or might not be relevant.
LoN, the problem with this article is that the uncertainties of the individual CO2 fluxes are of zero influence on the sum of all influences: that is known with relative high accuracy. Thus even if you propagate the uncertainties over 150 years, they are of zero influence on the fact that in average the relative accurate sum of all emissions is twice the relative accurate sum of all increase in the atmosphere…
you wrote:
Clyde wrote:
So it seems you two disagree on your first point. Maybe because you look longterm (which seems the right thing to do) and Clyde takes the annual values from that graph.
Do you agree for example that the atmosphere is in near equilibrium with the ocean surface in regards with CO2 and this surface is different as it was during the little ice age?
Do you also agree that the ocean are the biggest exchange partner with the atmosphere in regards CO2 and ocean cycles must have an influence on this parameter?
To me it seems that the earth is significantly greener now than 200years ago and that must influence the CO2 cycle.
I do agree that antropogenic CO2 is a rather new source and it´s rate is bigger than the increase in recent history.
How is that relevant at all?
There are more than one sources where “X is [about] twice the increase” is true.
LoN, makes little difference…
The sum of all influences is known: that is the measured increase in the atmosphere over one year and many years
The sum of human emissions is known, for one year and many years.
The uncertainty of the individual natural fluxes plays no role at all in the total influence of natural sources and sinks, as that is simply the difference between increase in the atmosphere and human emissions, thus exactly known (with a small tolerance).
Over the past 62 years in every year human emissions were larger than the increase in the atmosphere, in average twice the measured increase in the atmosphere.
The same for the past 170 years, less accurate, but still twice the increase.
Over the past 62 years natural variability (the variability in the sum of all natural fluxes in and out the atmosphere) was less than half of human emissions, which is remarkable small compared to the huge fluxes involved, but maybe caused by the fact that most seasonal fluxes are counter-current for each other…
Further:
Aww.. this thread is easily getting very long if you keep repeating yourself!
Is not correct, the CO2 concentration for ocean surface water is very close to an equilibrium, the imbalance is between surfac and Deep ocean water.
The plants react to the extra CO2 independently which the source might be.
Yes, we can follow the isotopic signature of that source. Does not prove anything (beside that we are indeed burning oil and coal)
One has nothing to do with the other, the last statement seems very wrong. If it is now warmer than during the Little Ice Age, the natural atmospheric CO2-level can be assumed to be higher (not much, but your statement is still wrong)
I beg to differ! I simply claim (without proof just like you!) that the carbon cycle compensates for all anthropogenic influx and only the extra natural influx of Deep Ocean CO2 stored during the warm medival period causes the raise of the atmospheric partial pressure!
(Actually, I really do not think it does, but still you have no proof for your statements.. this is not how science works!)
LoN,
BTW, the tolerance for human emissions is zero negative, due to the human nature to avoid taxes and by some countries (China) to underestimate their coal use…
You now making a similar mistake you claiming Clyde makes.
Surely not, pressures above 1atm do not exist on this planet
More importantly, we do not seem in a disagreement.
You call is an average lag of about 3-4years between Ocean Surface and Atmosphere and concede that there are sources and sinks in the ocean, I call it an almost equilibrium, you seem to split hairs here.
yes
yes
Repeating yourself and elaborating on trivialities does not help the length of this discussion either
Clyde wrote:
(using a different unit and apparently higher uncertainties than you)
Uncertainty in a system does not go away just because you know the total outcome precisely.
Your “back calculation” is simply unscientific or at least not a general solution to the problem.
It also reminds me of climate models trying to find trends with a higher precision than the underlying data.
You are doing a similar thing here. Forcing your model (“blame anthropogenic CO2”) results in unproven statements.
As I already said:
“I simply claim (without proof just like you!) that the carbon cycle compensates for all anthropogenic influx and only the extra natural influx of Deep Ocean CO2 stored during the warm medival period causes the raise of the atmospheric partial pressure!”
BTW,
This statement makes no sense to me whatsoever!
BTW my point is not if that this “medival upwelling” theory is more likely than your “blame anthropogenics”, but for the real data with uncertainty you cannot rule out one of them out without further assumptions, thus showing your model is not a general solution.
LoN,
Of course the difference between atmosphere and ocean surface is 7 μatm, forgot to copy the “micro”…
Even with that small difference, oceans absorb about 2 PgC/year in the period before 2001. That is a lot of CO2…
About the same amount is found as net uptake by the biosphere and about 3 PgC remained in the atmosphere of the 7 PgC/year human emissions.
These four amounts are based on observations, not theory or best guesses…
Simply said: there is one net source of CO2: humans and two main natural sinks: oceans and vegetation, which both remove a mass of the extra CO2 (whatever the source) equal to about a quarter of human CO2 emissions out of the atmosphere. The remainder of about half the emissions stays (temporarily) in the atmosphere (again as mass, not the original molecules).
The difference between Clyde and me is that he uses the tolerance of all natural fluxes, which indeed is larger than the human contribution, but that has nothing to do with the real tolerance, which is known from human emissions and observed CO2 increase.
240 PgC +/-10% is a lot larger in tolerance than 9 PgC -0/+10% or 4.5 PgC +/-10%…
You know that the CO2 emissions are based on sales of the different fossil fuels, thus taxes? Even years ago, in the UK the calculations were in the department of finance, not statistics.
That means that there is little chance that one overestimated the CO2 emissions and a higher chance that these are underestimated…
How can you be certain that biogenic decomposition of organic detritus is not contributing to an increase as the planet warms? Generally speaking, one would expect that biological activity should increase in the Winter if temperatures are increasing.
Clyde, it is a matter of balance. In general, in colder seasons, the decay of organics still goes on, even when freezing if there is an isolating snowdeck, while there is much less photosynthesis in the extra tropical vegetation. That makes that CO2 levels go up in fall-winter-spring, until new leaves start to grow and then there is a rapid uptake of CO2 in spring-summer-fall.
That is over the seasons.
For long term changes, the fertile land area and growing season increases with temperature (in the NH) and more CO2 also helps…
>> Simply said: there is one net source of CO2:
The opinion that there would not be a natural source of CO2 is only one thing: Simply wrong!
And rather unique if I may add! There is plenty of literature showing otherwise.. I see all your hand waving as an attempt NOT to address uncertainties.
“the tolerance of all natural fluxes… has nothing to do with the real tolerance,”
That must be a thing like RealClimate, right?
In the RealWorld uncertainteis matter and you cannot choose to ignore them and yet claim to make a scientific statement.
Please stop trying to simply rephrase things you already said.
As I already said:
“I simply claim (without proof just like you!) that the carbon cycle compensates for all anthropogenic influx and only the extra natural influx of Deep Ocean CO2 stored during the warm medival period causes the raise of the atmospheric partial pressure!”
Please react to this if you choose to bring the discussion forward.
LoN, I was talking of a NET source or sink. Of course there are huge natural sources, but the huge natural sinks are larger than the huge natural sources, that is a proven fact by the mass balance…
I have the tolerance of human emissions:
9 -0/+1 PgC/year
I have the tolerance of the CO2 increase in the atmosphere:
4.5 +/-0.5 PgC/year
I subtract these two with worst case tolerances:
4.5 – 9 -0.5/+1.5 PgC/year.
Thus I have the tolerance of the difference.
That is all I need. Not one individual CO2 in or out flux is involved in that calculation, neither their direction or tolerance…
Tho close the mass balance 4.5 -0.5/+1.5 PgC/year must be absorbed somewhere in the natural carbon cycle…
It really is that simple in the real world…
Sounds like here you calculate (with a small *typo* at the uncertainties) the amount of anthropogenic CO2 not staying in the atmosphere for a certain year based on the unsustained assumption that all other sources and sinks show no variation.
In a real world there are more terms with uncertainties contributing to the carbon cycle (look at one of Clyde´s diagramsin the article) and neglecting those is misleading.
Like I said before, your model “blame anthrpogenic” gets in the way of describing reality and you are neglecting uncerrtianties.
You seem to keep repeating yourself, so I do the same:
As I already said:
“I simply claim (without proof just like you!) that the carbon cycle compensates for all anthropogenic influx and only the extra natural influx of Deep Ocean CO2 stored during the warm medival period causes the raise of the atmospheric partial pressure!”
Please react to this if you choose to bring the discussion forward.
LoN, if you neglect the mass balance, then of course my calculation is not better than yours…
Reality is that human emissions are larger than the increase in the atmosphere.
No matter how you twist the natural fluxes, that proves that human emissions are fully responsible for the increase and that all natural CO2 fluxes together are a sink for CO2, if you like it or not.
About your proposal:
Further:
If nature was a net source, the increase in the atmosphere would be larger than human emissions and both human and natural emissions cause the increase in the atmosphere.
If nature was a small sink, the increase gets smaller than human emissions and only human emissions are to blame.
If nature was a huge sink, larger than human emissions, the levels in the atmosphere would drop, until back into equilibrium (if ever).
(*) A common mistake is that one expects that the sinks react on the emissions in a certain year. That is not the case. Sinks react on the extra CO2 partial pressure in the atmosphere above the equilibrium pressure, which is dictated by the ocean surface temperature, with a small response: about 2%/year of the difference.
For 100 ppmv excess pressure, that is about 2 ppmv/year that is removed.
Yes, the oceans may have a higher 13C/12C ratio than the atmosphere, but what happens at the interface when CO2 passes into the atmosphere? Is the lighter 12C isotope not favored because it takes less energy to be removed? Might that not contribute to why the oceans have a higher 13C/12C ratio?
There are example calculations (with uncertainties of course) showing that the isotopes are consistent with the fact that we are indeed burn oil and coal and these molecules partially end up in the carbon sinks. There is little else to be learned from the isotopes:
There is an anthropogenic source of CO2.
(other than that this isotope discussion is a straw man, but of course any CO2 cycle model must include this anthropogenic source)
Clyde, the ocean surface is between +1 and +5 per mil δ13C, depending on biological activity. The deep oceans are around zero per mil.
At the water-air border the shift is -10 per mil.
At the air-water border the shift is -2 per mil.
With the air-water exchange in balance, that gives -8 per mil shift between atmosphere and ocean surface.
The ice cores give an average -6.4 +/- 0.2 per mil δ13C pre-industrial over the Holocene in the atmosphere and also only a few tenths of a per mil change between glacial and interglacial conditions.
For the past 600 years, there is a unique, high resolution (2-4 years) proxy for the δ13C evolution in seawater found in the carbonate of coralline sponges, here at the Bermuda’s. The full reference is gone, but the above transfer isotope changes were from that article (if I remember well!). That shows that CO2 in the surface simply follows the isotopic changes in the atmosphere with less than a year half life time of the difference.
Well.. you rightfully point out that my assumptions might be too simple (yet your corrections seem small to me), but..
you seem to miss the main point of my critique:
You need to separate flux and increase in your statement and calculate the anthropogenic contribution for the later one correctly!
(Feel free to use a different equation or different numbers so . .as long as you document.. I have no doubt that you know more about these fluxes than me..)
An excellent article!
One source of atmospheric CO2 that seems to have been overlooked is animal respiration, since all animals on land use oxygen and exhale CO2 into the atmosphere. Respiration by marine animals may be included in “ocean loss”, but CO2 exhaled by land animals (including both wildlife and livestock) would go directly into the atmosphere. Since “plant respiration” accounts for 59 pg/yr of carbon (over six times anthropogenic emissions) according to Figure 1, emissions by animal respiration would probably be a substantial fraction of those by plant respiration.
The removal rate by photosynthesis (120 pg/yr) is particularly interesting, although about half of this is returned to the atmosphere by “plant respiration” (plants oxidizing the sugars they have produced by photosynthesis for energy). The net removal rate by plants would be (according to Figure 1) 120 – 59 = 61 pg/yr, or nearly 7 times anthropogenic emissions.
It has been demonstrated by experiments that plant growth rates increase with increasing CO2 concentrations in the air, and an increased growth rate would likely increase both the removal rate by photosynthesis and the emission rate by plant respiration proportionally. Figure 1 shows that the atmospheric carbon cycle is out of balance by about 4 pg/yr for anthropogenic emissions of 9 pg/yr.
If photosynthesis was a first-order reaction (CO2 removal rate proportional to CO2 concentration in the air), and all other sources and sinks remained constant, the additional 4 pg/yr could be removed if the net removal rate by plants increased from 61 to 65 pg/yr, or an increase of about 6.6%. For a first-order reaction, this would result from a 6.6% increase in CO2 concentration from the present 410 ppm, or about 437 ppm. If the net removal rate was equal to the net emission rate, CO2 levels in the atmosphere would stabilize, possibly around 440 ppm (given the round-off errors in all these estimates), if anthropogenic emissions remained constant.
This would mean that all of the IPCC’s worries about the “temperature sensitivity” or what would theoretically happen if CO2 concentrations in the atmosphere doubled is “much ado about nothing”, since CO2 concentrations would never double from their present values unless something happened in the NATURAL world (for example, some change in emission or absorption rates of the oceans).
A stabilization at (for example) 450 ppm would represent only a 61% increase from the supposed “pre-industrial” level of 280 ppm, or about 0.68 “doublings” on a logarithmic scale since the Industrial Revolution. Assuming a “sensitivity” of 1.8 C per doubling would result in a 1.23 C increase since 1800, most of which has already occurred.
Figure 1 also estimates at least 5,000 pg of carbon in fossil-fuel reserves, which we are consuming at about 7.7 pg/yr, meaning that we have at least a 650-year supply at current consumption rates.
We don’t really need to reduce fossil-fuel consumption, at least for the next few centuries. Carbon dioxide doesn’t either help or hurt people or animals, but it is excellent plant food. Let the plants take care of it, as they have throughout history!
If you take a look at my linked article, I do address animal respiration.
Clyde Spencer, you did use complete obsolete arguments…
The main mistake you make is that you don’t take into account that about all natural CO2 fluxes are bidirectional, while the human input is unidirectional, only addition.
Take a fountain where there is a 1000 +/- 100 l/min water flow over the fountain driven by a pump. A worker opens a valve adding 10 l/min of fresh water and forget to close the valve. After some time what will happen with the level in the fountain? No matter the large in/out water flow and its tolerance with an addition of only 1% of the main flow?
So let us look at the mass balance, no matter what is cycling as natural carbon:
increase in the atmosphere = human emissions + natural input – natural uptake
For past years (pre-Corona):
4.5 Pg = 9 Pg + X – Y
X – Y = -4.5 Pg
No matter what X and Y are, no matter how individual CO2 fluxes changed over the years, even if some net CO2 sources turned into CO2 sinks or reverse: that has not the slightest interest for the increase. All what counts is the net result of all natural ins and outs.
If in the above example:
X = 100, Y = 104.5
X = 240, Y = 244.5
X = 1000, Y = 1004,5
The height of the natural fluxes are of not the slightest interest in the mass balance, only the net difference is of interest, and that was negative for the past 62 years, every year again. Nature is a net sink for CO2, not a source and 96% of all CO2 increase is from human emissions.
The 12C argument is one of the many arguments that show that humans are responsible for the increase, but every single observation supports that claim and none disproves it:
http://www.ferdinand-engelbeen.be/klimaat/co2_origin.html
Is it unidirectional? Thinking of fertilisers and eutrophic effects of sewerage.
Probably is but not certainly.
Oh yes, there also are some new tree plantations in some countries, but that are peanuts in CO2 sinks compared to what humans emit by using fossil fuel and biomass…
I will speak to that claim in my next submission. However, feel free to support your claim in the meantime.
“dust…to dust” Gen. 3:19
“… there is nothing new under the sun.” Ecc. 1:9
Sounds like someone knew about the “Carbon Cycle” long ago.
Nice post Clyde. You are correct that only about 3-4% of the annual flux is anthropogenic, that the atmospheric residence time is relatively brief and that δ13C is not an anthropogenic “fingerprint.” If all of the anthropogenic CO2 was still in the atmosphere, the 13C depletion would be much larger.
However, I think this needs to be treated as a material (or mass) balance equation. Unfortunately, we would need to have a much more accurate handle on how much of the anthropogenic CO2 has been consumed by photosynthesis and on the natural sources and sinks. The only numbers that are relatively accurately known are the cumulative emissions and the rise in atmospheric CO2.
Thank you, David,
You said,
And, that is the point of the essay. The fallacious ‘logic’ goes something along the lines of “We don’t know of anything else that could be contributing to the CO2 increase, so it must be humans.”
What if the CO2 from dormant volcanoes (such as has been documented at Long Valley Caldera (Calif.) is seriously underestimated? What if the outgassing from upwelling along the coasts is a significant underestimate? What if there are sources we aren’t even aware of, such as underwater volcanoes? Are the warming oceans providing more CO2 that is inappropriately assigned to the fraction of anthropogenic emissions that is retained? What if our estimates of CO2 from a warming tundra are low?
Consider this article to be an introduction to my next submission, which will be more quantitative.
Clyde, all these natural inflows don’t matter at all.
As long as the increase in the atmosphere is smaller than human emissions, nature is a net sink, whatever the height of individual inflows and outflows, no matter how they changed over time.
It is about the net balance of all natural fluxes and that is accurately known (the difference between human emissions and increase in the atmosphere)…
BTW, warming oceans give you not more than 16 ppmv/K warming. By far not enough to explain the 100+ ppmv increase in the atmosphere since 1850 with 200+ ppmv human emissions…
However, that is not a one-time addition at the end of the 150-year warming period. The CO2 is cumulative, so one needs to integrate and obtain the area under the curve of the CO2 increase.
Clyde, that doesn’t make any difference in this case: both cumulative and year by year (at least for the past 62 years), human emissions are about twice the increase in the atmosphere. Thus even cumulative over the past 150 years, nature was a net sink for CO2, not a source.
When the oceans warm, the equilibrium with the atmosphere changes with about 16 ppmv/K. Thus the oceans degas just enough to reach an extra 16 ppmv in the atmosphere. At that moment the sum of inputs and outputs from the oceans are again equal and no further accumulation exists…
Here for the influence of a sudden 1 K increase in sea surface temperature on the 40 PgC/year exchange between deep oceans and atmosphere:
A similar argument is used to justify the anthropogenic carbon emissions causing climate change:
“Climate models that include solar irradiance changes can’t reproduce the observed temperature trend over the past century or more without including a rise in greenhouse gases.”
https://climate.nasa.gov/causes/
During a centennial solar minimum, El Nino conditions normally increase, which makes tropical forests drier and emit CO2. And the AMO is normally warmer during centennial solar minima, which means reduced CO2 uptake in the North Atlantic.
https://digital.csic.es/bitstream/10261/67041/3/Atlantic_Ocean_CO2_uptake.pdf
Mr Spencer, what you have investigated has trouble me for a long time as well. Please continue this good work and try find others to help and advise you, while also looking for existing published papers that try to “resolve” this. I also recommend you contact Pascal Richet, whose work was posted on WUWT a week ago. See link here:
https://wattsupwiththat.com/2021/05/27/the-temperature-co2-climate-connection-an-epistemological-reappraisal-of-ice-core-messages/
Though yours is a very different investigative focus, combining these efforts makes each more credible, since both serve to undermine the notion that CO2 is the main and/or lever a significant driver of earth’s average temperature increases (and decreases), even if it is slightly affecting the daily minimums temperatures — as the junior partner to water vapor — and some small effects on its own in the dry polar regions.
It is important that both efforts continue to acknowledge that CO2 is a “greenhouse gas” (since that basic physics is correct). But while doing so it is also important — if the facts lead there, as I suspect they will — to undermine the widely held and unfounded assumption among most “climatologists” that there is a consistently strong positive feedback via water vapor and/or clouds, which amplifies the admittedly small total effects of CO2 and all other greenhouse gases (except water vapor).
Also these efforts should explicitly comment on the equally possible, if not yet provable, conclusion that the combined impact of any added water vapor + cloud feedbacks, as may result from increases in CO2 and other greenhouse gases — and possibly even other spurious heat sources — could be positive but very small (when added to mostly dry, cold air) or could even be NEGATIVE and just small enough to cancel-out or even cool the average temperature in some regions, where ever additional cloud formation dominates — and prior to that additional convection and latent heat transfer to the upper atmosphere — in response to those weaker greenhouse gases (as Willis says).
That allows CO2, CH4, etc to be greenhouses gases, but not consequential among the many things that influence atmospheric temperatures, but most importantly ocean temperatures, since oceans drive the global temperature averages, by holding 90+% of earth’s surface energy.
Also note that oceans absorb & retain very little of the energy from the long-wave (infrared) radiation “reflected” from all greenhouse gases (including water vapor), because it is mostly absorbed in the first few millimeters of the ocean surface (and re-radiated to the sky or via enhanced evaporation, creating more convection & clouds), vs. what is absorbed & retained, in the longterm, from the shorter wave visible and ultra violet light which penetrate deeply into water (making it blue to our eyes), and that radiation comes mostly from the sun directly, with the rest from the scattered blue and ultraviolet light in our skies which also goes deep.
Ultraviolet is absorbed strongly at the surface, and contributes to the heating also. One of the mysteries of our world is why are both the atmosphere and hydrosphere so transparent to the peak of emissions from our sun!
Since 2020 we can say it is certainly not true. We cut flights, reduced industry, transport and leisure. Dropped global GDP by about 8%. That’s a bigger cutting back than we will ever do again.
And the effect was zero. No stop to global warming (that hadn’t stopped anyway).
No drop in atmospheric CO2 as measured at Mauna Loa. Yet CO2 is well-mixed and responds seasonally.
The argument that the drip, drip, drip effect of anthropogenic emissions overwhelms the changes in the natural reservoirs is just not tenable anymore. Big changes in anthropogenic emissions do not make any changes in the atmosphere.
M Courtney, the drop in human emissions was about 10%. Normal increase was about 2.5 ppmv/year or 0.2 ppmv/month. That is the detection limit of the CO2 measurements. To detect a difference you need at least 10 months of 10% reduction to be measurable, if there were no other variables. But there are: a +/- 8 ppmv seasonal amplitude and a +/- 1.5 ppmv natural variability caused by temperature variability.
Thus you need at least several years of a sustained drop in emissions, before it is detectable in the natural noise. For the trend: human emissions already 62 years overwhelm the changes in natural reservoirs, every year again…
I will be addressing that issue directly in my, soon to be submitted, article analyzing atmospheric CO2 growth.
Like so many of these analyses, it neglects the constraints of mass balance. Yes, there is a large annual flux of 90 pg/yr from the ocean. And, as that graphic shows, there is an annual influx of 92 pg/yr into the ocean. The similarity of these numbers is not coincidence. It represents a seasonal flow. Each year in summer the sea warms and solubility drops, but in the winter it falls by the same amount, and the same amount of CO2 returns. It is just the same CO2 moving back and forth. The small discrepancy is the part absorption of the anthropogenic flux.
Likewise the photosynthesis uptake of 120 pg/yr is necessarily matched by the flux from plant respiration and soil respiration. The respiration can only oxidise C that has already been reduced in photosynthesis. And conversely, C that has been reduced cannot last long in an oxidising environment. So the two fluxes must match.
It is just the same carbon shifting around, and so, without a one-off intervention, the system goes nowhere. And you can see the result in the amount of carbon in the air over the last thousand years: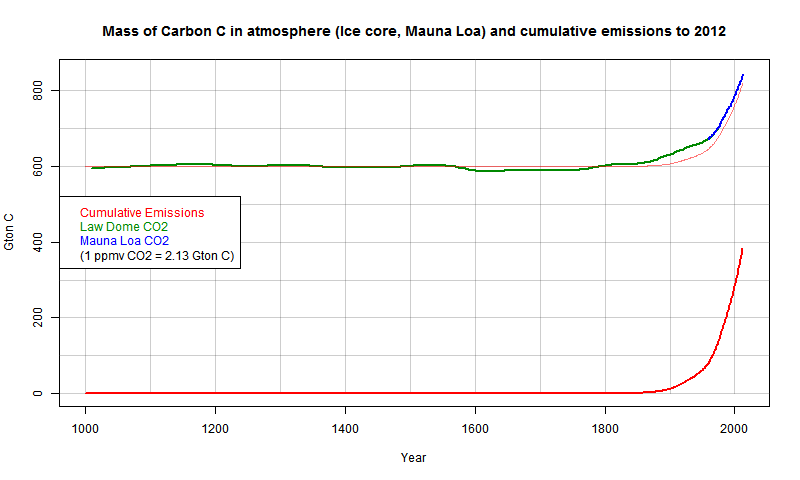
It did not budge for centuries, despite the big flows in and out of ocean, plants and soil. They balanced, as they had to. It was only when we started mining and burning (and to a lesser extent, land clearing) that CO2 in the air started moving up. The net additions are the lower curve, and it shows that the increase closely followed about half the anthro additions (being the fraction that went into the air).
Yet temperatures did not remain stable during this long period of time.
Where is the climate emergency?
Carlo,
at some point I got to consider that this guy may just be intelligible…
somehow.
But not so sure anymore.
cheers
His usual tack is to find some minor little point inside an article and nitpick it, while ignoring the bulk of what is written.
Isn’t that what you just did?
Go back and look at the graphs he posted, silly person.
AKA what he just did.
However, interestingly, as the solubility drops in the Summer, so does the CO2 in the atmosphere. And, in the Winter, when that 2 pg goes back into the oceans, the atmospheric CO2 increases! Stay tuned!
Think globally, not locally. In the Winter (NH) it is summer in the SH. And there is a lot more ocean there.
And a lot more vegetation in the NH, that soaks CO2 out of the atmosphere in the NH spring when new leaves start to grow…
Based on the opposite CO2 and δ13C changes, it is vegetation in the NH which is dominant, not the oceans. As there is less vegetation in the SH, the seasonal changes are much smaller in the SH.
The hockey stick lives.
YES!
https://twitter.com/AlexEpstein/status/1401897228680130562
” The point is that we know the total with at least an order of magnitude less precision than the anthropogenic component.”
How many times does it need to be explained that we don’t need to know the natural fluxes accurately to know that the natural environment is a net carbon sink and has been increasingly OPPOSING the rise? At least once more, apparently.
If you accept that the atmosphere observes conservation of carbon (i.e. carbon doesn’t spontaneously appear or dissapear, if it leaves the atmosphere it must go somewhere, if it enters it must have come some where), we can write this mathematically as:
dC = Ea + En – Un
where dC is the rise in CO2 over some period of time, Ea is anthropogenic emissions over that period and En and Un are natural emissions and uptake respectively of carbon over that same period.
A bit of algebra give us:
dC – Ea = En – Un
Now we have accurate measurements of dC from a global network of measuring sites (and now satellites). We also have pretty good records of Ea because most of it is the result of commerce of some kind, so records are kept.
If we look at the data, we see that dC – Ea has been consistently negative for the last fifty years at least, and has been growing steadily more negative over time.
Because of the equals sign, this means that En – Un is negative, i.e. uptake by natural sinks exceeds emissions from natural sources. So we know the natural environment is OPPOSING the rise in CO2, not causing it.
Now here is the important bit. Yes, the uncertainty on En and Un are large. However the uncertainty on En – Un depends on the uncertainty on dC and Ea, which are both much lower, because conservation of mass gives us a way of estimating En – Un without knowledge of the values of En or Un. Now on average dC is roughly twice Ea, so our estimates of Ea would have to be out by a factor of 2 before we even get to En = Un. The real uncertainty is likely to be less than 10% IIRC (from the Global Carbon Budget paper?).
… uptake by natural sinks exceeds emissions from natural sources.
I’m afraid my next submission will seriously challenge that statement.
Please identify the specific error in my analysis.
If you can’t it is your next submission that is challenged by the mass balance analysis, not the other way round.
I think it is reasonable to assume that Clyde cannot find a specific error in my analysis.
I had already debunked Dikran’s reasoning in ATTIP blog more than a year ago…but after that the webmaster kicked me out deleting my post. So here is a good chance to re-state my old comment :
Dear Dikran
on surface, your equation seems all right. But at a closer look I think it hides a logic flaw where your basic assumption is in reality what you would like to demonstrate. Circular reasoning, demonstration invalid. Let me see if I am able to explain it.
Let’s consider a period of time, in the planet earth history, when there was no human contribution to atmospheric CO2. Then I suppose you would agree that the variation of CO2 in the atmosphere would be governed by the simple equation :
DC = En – Un
DC may be positive or negative, as we have seen a few times in the earth history.
Then let’s move to the recent period, when humans started to emit in the atmosphere : to account for this, what you are doing to the equation is to throw-in the FULL anthropogenic amount Ea in the right end side (= “the atmosphere”). But this is clearly not true, because, by definition, what is left in the atmosphere in such period is just the fraction f*Ea (f is the airborne fraction, i.e. the “portion of human CO2 emission that remains in the atmosphere”). In other words you have already decided “a priori” to increase the natural balance in the atmosphere (En -Un) by the FULL anthropogenic amount relevant to that period. So your equation should rather be modified as follows :
DC – f*Ea = En – Un.
From this equation, let’s assume for instance some reasonable values, such as DC = 18 and Ea = 37. If we assume f = 0.45, then both sides of the equations are 0 or slightly positive. If – by a chance – f is rather = 0.15, then this equation shows that nature can be a strong net emitter.
In short : your version of the equation is – in my modest opinion – flawed, since it is formulated in a way that implies that all the Ea amount will remain in the atmosphere. Not correct because against the objective evidence.
“Circular reasoning,”
No. There is no circular reasoning.
Conservation of mass gives us
dC = Ea + En – Un
algebra gives us that
dC – Ea = En – Un
Observations tell us that dC < Ea
algebra tells us that means that En < Un
That is a linear set of steps with no circularity whatsoever.
“But this is clearly not true, because, by definition, what is left in the atmosphere in such period is just the fraction f*Ea (f is the airborne fraction, i.e. the “portion of human CO2 emission that remains in the atmosphere”)”
No, that is not correct. The reason that only a fraction of anthropogenic emissions remain in the atmosphere is because En is less than Un. It is in the equation already and you are just trying to double count it.
Sorry – but your equation is written in such a way that it includes the EMBEDDED assumption that the entire variation of atmospheric carbon is necessarily human. Therefore it is obvious that it will demonstrate…just that !
I suggest that you read the debate between Ed Berry and Dave Andrews on this topic.
https://edberry.com/blog/climate/climate-physics/preprint3/#comment-97313
There seem to be some cognitive issue that does not enable the alarmists to comprehend that they are demonstrating a thing starting from the hypothesis that such thing is true…a classical circular reasoning.
“Sorry – but your equation is written in such a way that it includes the EMBEDDED assumption that the entire variation of atmospheric carbon is necessarily human.”
No, it doesn’t. If the natural environment were a net source of CO2 then the equation would demonstrate that as then dC – Ea would be positive instead of negative. It is the observations, combined with conservation of mass that allows us to conclude the that the rise is anthropogenic, but it is clearly not embedded into the equation.
Max Polo, I have had several debates with Dr. Ed on previous concepts, where he was completely wrong on one fundamental point: he reversed the formula of the residence time to demonstrate what he wanted to demonstrate.
That you may do if and ONLY IF all fluxes are unidirectional from inputs to sinks, but you NEVER EVER may do that if the main fluxes switch seasonally from input to output and reverse.
That makes that his reasoning was completely wrong from begin to end.
I haven’t read his newest work yet, but the tone seems quite strident to say the least…
Just like to say that that David Andrews in the link is NOT ME
I have tried discussing these issues with Ed Berry, and the same thing happened that happens here, which is that you refute someones argument (as I have done twice here) and instead of addressing the refutation, or even acknowledging it, they just move on to the next incorrect argument (by proxy in this case by offloading it on to Ed Berry).
Berry’s paper did make me laugh though, when he wrote “Cawley [5] is a key paper for the IPCC theory.” This is hilarious as my fictional alter-ego’s paper is just setting out some carbon cycle 101 stuff, and I very much doubt that anybody at the IPCC has ever heard of it. It might be a key paper for skeptics to stop making themselves look silly by holding on to one of the least tenable of their canards. Even notable climate skeptics like Fred Singer advise against arguing this one!
https://www.independent.org/news/article.asp?id=3263
n.b. Fred Singer’s choice of label, not mine.
Max Polo, human emissions are 100% into the atmosphere, if that remains there or not, is not of the slightest interest.
If there was no reaction of nature to an increase in CO2, the remaining fraction would be 100%, if there was an extreme fast reaction, the remaining fraction could be zero within a year.
The point is that DC depends of human emissions Ea and the net sink rate En-Un. The latter is NOT a function of Ea, but a function of the total extra CO2 in the atmosphere above the temperature driven equilibrium between ocean surface and atmosphere…
Thus your f*Ea has no bearing in any physical process and f may vary between 0 and 1.
If e.g. human emissions halved in a certain year:
f would be 1
and
Ea = En – Un
and
DC = 0
Thanks Clyde! Between the fungus paper the other day, and my multiply attempted readIng of the Wu, et al, (2019) paper, I had a load of questions building up that you’ve gone a great way to answer. Yours and Willis’ of today together provide a lot of good info — you two should collaborate more often. Looking forward to your follow-up.
For Clyde – I may not be correct about this, but I hate being wrong, and if I were wrong I would have written something different, and that would have been correct.
Regards, Allan (add smiley-face)
The following is the cutting edge of the science:
The huge decline in fossil fuel consumption during the year-plus Covid-19 lockdown had NO impact on atmospheric CO2 increase – more evidence that Ed Berry’s latest book and paper are correct – see below.
My friend Ed says the increase in atmospheric CO2 is primarily natural, not man-made. The smartest people on the planet think he is correct.
More evidence supporting Berry:
Atmospheric CO2 changes lag temperature changes at all measured time scales. (MacRae, 2008). Humlum et al (2013) confirmed this conclusion.
Kuo et al (1990) and Keeling (1995) made similar observations in the journal Nature, but have been studiously ignored.
IF CO2 is a significant driver of global temperature, CO2 changes would lead temperature changes but they do NOT – CO2 changes lag temperature changes.
Think about that: Kuo was correct in 1990, and for 31 years climate science has ignored that conclusion and has been going backwards!
Climate Sensitivity (CS) to CO2 is a fiction – so small, if it even exists, it is practically irrelevant.
“The future cannot cause the past.” Here is the proof, from my 2008 paper:
https://www.woodfortrees.org/plot/esrl-co2/from:1979/mean:12/derivative/plot/uah6/from:1979/scale:0.18/offset:0.17
In the modern data record, the lag of atmospheric CO2 changes after atmospheric temperature changes is ~9 months. This is an absolute disproof of the CAGW hypothesis, which states that increasing CO2 drives temperature. “The future cannot cause the past.”
In my 2019 paper below, I explained why the lag is ~9 months – it is basic calculus, the 90 degree (1/4 cycle) lag of the derivative and its integral, which is the ~3 year ENSO period.
My 2008 paper remains very important. My 2008 conclusion was confirmed and expanded by Humlum et al in 2013, for which I am grateful.
My 2008 paper has been cited by Ed Berry in his 2020-21 book and related paper, which is at the cutting edge of climate science.
“CLIMATE MIRACLE: THERE IS NO CLIMATE CRISIS – NATURE CONTROLS CLIMATE”
amazon.ca/Climate-Miracle-climate-crisis-controls-ebook/dp/B08LCD1YC3/
“CARBON CYCLE MODEL SHOWS NATURE CONTROLS CO2 LEVEL”
edberry.com/blog/climate/climate-physics/preprint3/
All warmists and most skeptics argue about the magnitude of climate sensitivity to increasing CO2, and whether the resulting CO2-driven global warming will be hot and dangerous or warm and beneficial. Both groups are probably wrong.
There is a high probability that the mainstream climate debate about the magnitude of CS is wrong – a waste of decades of vital time, tens of trillions of dollars of green energy nonsense and millions of lives. Vital energy systems have been compromised, damaged with intermittent, unreliable wind and solar generation – a debacle.
It is important to note that Global Cooling is happening now, even as CO2 concentration increases – another disproof of the global warming fraud.
Cheap abundant reliable energy is the lifeblood of humanity – it IS that simple. The green sabotage of our vital energy systems, whether innocent or deliberate, has cost lives and could cost very many more.
Alan
I’m basically in agreement with what you have stated. Although, my next submission will raise some questions about the lag time that you and Willis mention. I think that I will make a strong case that the atmospheric CO2 concentration is highly responsive to natural emissions. IF CO2 is responsible for increasing temperatures, there may well be considerable lag time. Personally, I think that the increasing temperatures are driving the CO2 emissions, and I’ll present evidence for that.
“Personally, I think that the increasing temperatures are driving the CO2 emissions, and I’ll present evidence for that.”
I see CO2 emission yearly rate increase in every El-Nino phase, then drops when significant La-Nina come along.
Moana Loa data shows it.
Sunsettommy:
Might it be that precipitation also contributes to carbon capture (whatever that is)? It seems like it must in glaciers, else we’d not be offered so much information about past climate and CO2 levels from analyzing gasses in ice cores.
Rain has a pH of about 5.5 instead of 7.0. That is caused by the water absorbing CO2 present in the air. From there, if it lands somewhere that is unreactive, it will end up in the ocean. However, if it lands on limestone, the CO2 will be released.
Thanks, Clyde. Makes sense, considering study of carbonic acid was Ahrennius’ original focus, and what was beaten into my head about acid rain panic in the 80’s and 90’s.
Looking forward to your next post.
Clyde – most of my stuff is here including references to my earlier papers:
CO2, GLOBAL WARMING, CLIMATE AND ENERGY
by Allan M.R. MacRae, B.A.Sc., M.Eng., June 15, 2019
https://wattsupwiththat.com/2019/06/15/co2-global-warming-climate-and-energy-2/
Excel: https://wattsupwiththat.com/wp-content/uploads/2019/07/Rev_CO2-Global-Warming-Climate-and-Energy-June2019-FINAL.xlsx
Very pertinent. Digesting the first link in the context of Clyde and Willis’ of today. Afraid that I will need a lot of time to drink it all in. Thanks, Alan.
I’d wait until Clyde has set aside his erroneous pet theory and come to terms with the mass balance issue he seems willingly blind to.
Nothing to do with Allan’s post. And to the depth he’s gone here, it isn’t Clyde’s pet or erroneous, nor even his entire theory. Blindness seems to be on your side, like most of the fools who don’t read the article before spouting off with cut-and-paste heckling.
Clyde, temperature is driving the rate of change of CO2 emissions, not the CO2 emissions…
The variability of extreme changes in temperature (1991 Pinatubo, 1998 El Niño) is not more than +/- 1.5 ppmv around the trend, leveling off in a few years which itself is 100 ppmv since 1958…
The influence of temperature is around 16 ppmv/K, by far not enough to explain the 100 ppmv increase, but enough to explain the year by year variability.
Allan,
CO2 follows temperature changes at all time scales, from seasons to multi-millennia, except for the past 250 years, where CO2 increases far beyond what is expected from the temperature change.
If that has a huge influence on temperature can be debated, but it is simply impossible that the 100+ increase in CO2 is caused by temperature…
Hi Ferdinand – We have agreed to disagree.
Best personal regards, Allan
I presume that you are talking about outgassing and ignoring biogenic sources.
Clyde, what biogenic sources?
The balance for all biological sources and sinks is more uptake than release.
That is clear from the oxygen balance.
The uptake of CO2 by plants releases O2.
The decay of plants, soil respiration, molds, insects, feed and food, uses O2.
The O2 balance, after subtracting the O2 use from fossil fuel burning shows that the biosphere as a whole is a source of O2, thus a sink for CO2…
http://www.bowdoin.edu/~mbattle/papers_posters_and_talks/BenderGBC2005.pdf
See the last page, Figure 7.
“The basic unit is petagrams (pg) of carbon, ”
NO, that’s a picogram. I apply general rule of stopping reading anything where someone is aiming to give me a 101 in some subject where he does not even understand the units.
You may read pg as Pg and it’s ok 😀
One could wish, Greg, that you could stop writing, as well, when you approach something with standards so high that you can’t meet them yourself. e.g., the standards for defining for an author’s readers the abbreviation used on the author’s own table in the author’s own article. It must be difficult to stop reading in order to declare one’s own pedanticism.
To be honest, I didn’t pay a lot of attention to it, I just copied it, and didn’t capitalize the “P.” Thanks for bringing it to my attention.
It is not an issue of understanding the units, it was just carelessness. That doesn’t nullify the entire article, and it is your loss if your compulsiveness lead you to stop reading when you ran across a typographical error. Might your focus be misplaced?
Thanks for the reply Clyde. However, the claim that it was a “typo” is rather weak when you make the same error consistently literally dozens of times throughout the entire article and do not get it right once.
To me it stood out the first time I saw it because I’m familiar with science and scientific units.
There is nothing compulsive about not reading scientific articles by people who do not understand scientific units. It is a basic indicator of whether the person has the knowledge of the subject to be worth the time reading and whether I’m going to learn anything useful.
Thanks for the effort of submitting an article but I’ll pass on the offer this time. Best wishes.
Yes, it shows up throughout the article; I was consistent. You are assuming that I’m unfamiliar with abbreviations of units. You would be wrong! I’m quite aware that the usual practice is capitalizing multipliers of the basic unit, and using lower-case for divisors. I was more focused on the big picture rather than details such as seems to be your only concern. So, I’m human and missed a detail; I don’t have an editor to review my submissions. I can promise you and Stokes that I will also make errors in the future. I can only ask that you and others politely point out such human failings, and move onto the important things.
FWIW I don’t think getting the units wrong is a big deal. We ought to have common sense and can work out what was meant without making a big fuss about it.
I aspire to providing text that is free of errors. I think that is a desirable goal. However, I’m human and subject to making mistakes. But, in the bigger picture, I think that an incorrect abbreviation is of much less consequence than the facts and logic offered.
How many times do you see the (non-SI) unit of energy, kilowatt-hours, abbreviated KWH? Do you stop reading here?
There are lots of instances where the capitalization rules are relaxed or ignored.
The standard SI unit for mass is a bit odd in that it is the kilogram, kg, which is really a gram with the multiplier for 1000. When you have lots of kgs, do you use Gkg or Tkg? No.
How many grams are in a metric ton?
I saw the ‘pa’ usage and figured out what was meant without hardly thinking about it.
Big deal.
Clyde,
Your statement “This graphic, (Fig. 2), is even more problematic. It shows, at the top, an annual increase of 240 ±10 pg.” appears to be completely wrong since you are confusing
fluxes with stocks. The second line on the top of figure 2 says quite clearly “average atmospheric increase 4 Pg C/yr”. What the first line says is that the total amount of carbon in the atmosphere is (589+240) Pg. It is also not clear why you would worry about an unsourced diagram of a popular science website when there are plenty of detailed discussions of the carbon cycle in the scientific literature. See for example
https://bg.copernicus.org/articles/16/831/2019/
Walton,
The “240” value is the annual flux of sources, of which only 2Pg is retained. So, you are correct that the increase is small. However, that doesn’t change my claim that of the estimated 240 Pg annual flux, the anthropogenic fraction is smaller than the uncertainty. Nor does it contradict my statement that there is disagreement between the two illustrations.
The diagrams are not unsourced. They were some of the more detailed graphics I found when doing an online search, such as might be done by a layman, or a teacher looking for material to pass on to their students. It also speaks to the fact that those who consider themselves sufficiently expert to create such visual aids, aren’t in agreement on the numbers.
Thank you for the link. It is a more detailed source. However, the authors admit that it isn’t complete. The unanswered question is whether it is more trustworthy than other similar estimates. I’m reminded of the old saw about “If you have many standards, you don’t really have a standard.”
My closing remark was “The science is definitely not settled.” I’ll stand by that.
P.S.
Walton
The link you provided concludes with:
That might serve as a good summary of my article!
Clyde,
The “240” value is not the annual flux. The best evidence of that is to look at the caption on the webpage you reference. It states quite clearly “natural (black) anthropogenic (red)”. Now the top line states “atmosphere 589 (in black) +240 (in red)”. Therefore the correct way to read that is that there is 829 Pg of carbon in the atmosphere of which 240 Pg is caused by humans. And that 829 Pg agrees well with atmospheric CO2 content of about 400 ppm. There is no way that the 240 number in red can be a flux since that mean that humans were emitting 240 Pg of carbon every year as opposed to the numbers in the diagram of about 10 Pg.
Izaak is obviously right. The total in the atmosphere is partitioned into 589 Pg (black) and 240 Pg (red). 240 is not a rate.
Here is the original, with caption
Dikran and the rest of you selflessly and heroically manning the antiaircraft batteries:
Thank you for supplying the complete original caption. It clearly states,
Do bother reading the things you post?
How about some serious flak, instead of puffballs that are blown away easily?
Does the 240 figure have an arrow next to it? No.
It also says “Red numbers in the reservoirs denote cumulative changes of anthropogenic carbon over the industrial period”
You made an error, but can’t admit to it.
“Do bother reading the things you post?”
Lol, clearly you don’t!
“Red arrows, AND numbers …”
The uncontested fluxes outside the atmosphere reservoir box sum to the same order of magnitude as the “240” in the box.
I double checked, that is not what the caption says, you have inserted a comma between “arrows” and “and” that is not there in the caption. What it actually says (cut and pasted from the report) is:
“Red arrows and numbers indicate annual ‘anthropogenic’ fluxes averaged over the 2000–2009 time period.”
So it evidently means the conjunction of a red number and an arrow.
As it also says “red numbers in reservoirs…” in the caption and this is a red number in a reservoir, that is obviously the correct description.
The problem with hubis and snark is that you then can’t back down when shown to be wrong without looking an utter fool for the hubris and snark, so people double down repeatedly instead. Sadly that isn’t any better to an objective observer.
OK, I acknowledge that I inadvertently inserted a comma between “arrows” and “and.” However, I don’t agree that it clearly makes the distinction that the red numbers only refer to fluxes if there is an arrow present. If you look, you will see that there are red numbers in the sub-surface reservoirs without any associated red arrows. Whereas, the atmosphere has red arrows associated with differentiated fluxes that approach in sum the red numbers in the atmosphere box.
I’d say that the meaning in ambiguous. If two reasonably intelligent people can’t agree on the meaning, then I’d say that reinforces my claim that there are issues of accuracy and precision in the Carbon Cycle.
“if you look, you will see that there are red numbers in the sub-surface reservoirs without any associated red arrows”
Yes, they are “The red numbers in reservoirs [that] denote cumulative changes in anthropogenic carbon over the industrial period”. How many times does that need to be pointed out to you?
“Whereas, the atmosphere has red arrows associated with differentiated fluxes”
Yes, arrows indicate fluxes, numbers in reservoirs represent cumulative changes in the reservoir” It’s hardly rocket science and clearly explained in the caption.
“that approach in sum the red numbers in the atmosphere box.”
Yes, *approach*, but not equal to. Common sense suggests that the IPCC report isn’t going to have a numeric error in a key diagram, so perhaps that isn’t what it means. You could look in the caption to see if there is anything that explains what the red numbers in reservoirs mean.
“I’d say that the meaning in ambiguous. If two reasonably intelligent people can’t agree on the meaning, then I’d say that reinforces my claim that there are issues of accuracy and precision in the Carbon Cycle.”
No, the meaning is disambiguated by the existence of a sentence in the caption that says “The red numbers in reservoirs denote cumulative changes in anthropogenic carbon over the industrial period” which says *exactly* what the red numbers in the reservoirs mean. But you don’t seem to want to acknowledge the existence of that sentence. It is there though, if you look.
“The uncontested fluxes outside the atmosphere reservoir box sum to the same order of magnitude as the “240” in the box.”
so you noticed that the numbers don’t actually add up, and conclude that it is more likely that the IPCC authors can’t add up (despite countless hours writing and checking the document through multiple formal stages, including input from externals) than that you misread/misunderstood the caption, on the grounds that they are of the same order of magnitude.
Monumental hubris. Skepticism ought to start with self-skepticism.
There is an old saying that when you point a finger at someone, there are three fingers pointing back at yourself. You might want to take your own advice to heart.
“There is an old saying that when you point a finger at someone, there are three fingers pointing back at yourself. You might want to take your own advice to heart.”
It was you that started the pointing when you wrote:
“Thank you for supplying the complete original caption. It clearly states,
Do bother reading the things you post?”
and then ironically (i) added a comma that wasn’t there (changing the meaning of the sentence in doing so) and (ii) failed to notice that there was another sentence in the caption that explains *exactly* what the red numbers in the boxes mean.
The hubris is all yours.
BTW you *STILL* haven’t identified a specific flaw in the mass balance analysis I provided that shows that this article is incorrect.
“instead of puffballs that are blown away easily?”
I should remind you that you still haven’t identified a specific flaw in the mass balance analysis that demonstrates this article is incorrect.
LOL, -1 for identifying the origin of a diagram – hilarious!
Got an explanation for the negative votes yet?
Re: claim of unsourced data
Globe.gov is a public resource for government data and information, and is sponsored and informed by several agencies of the U.S. government, primarily NASA, but also NOAA and NSF.
https://www.globe.gov/about
and the graphic in question comes from a recently updated Globe page, indeed a popular article, but written from NASA and NOAA perspective and data.
“They were some of the more detailed graphics I found when doing an online search, such as might be done by a layman, or a teacher looking for material to pass on to their students.”
No, a teacher would have been able to find the original source – the IPCC report. That is basic scholarship.
No, the Globe’s NASA-NOAA approved information is for teachers, scientists, citizens and anyone who has interest. Basic scholarship doesn’t require closed mindedness and obsessive repetition of baseless criticism.
It is actually figure 6.1 from the IPCC 5AR WG1 report (page 471). It is somewhat ironic that someone wants to overturn carbon cycle research but doesn’t recognize the key diagram from the relevant chapter of the IPCC report.
The caption is fairly lengthy, but the red figures refer to changes since the pre-industrial era. The arrows represent fluxes (where not indicated by the units) and the numbers not next to an arrow represent stocks. So this is basically saying that the atmopsheric mass of carbon has risen by 240 ±10 Pg since pre-industrial times. It is clearly not an annual flux.
Thank you for pointing out the importance and legitimacy of the graphic. It makes the comparisons all the more valid.
See my quote above!
Clyde,
Belaboring the point well after the referee’s review, trophies awarded (and the cheerleaders have all gone home, more’s the pity), I wonder if either of this pair(?) noticed how many NOAA and NASA scientists, current and alumni, contributed to Chapter 6 of the IPCC report in question. And since NASA is responsible for Globe.gov content and data management, I wonder if either thought to find if the IPCC report was archived by NASA, so that NASA could source it without reference in their own Globe “popular science” article.
I was long ago taught that the first principle of scholarship was literacy, and that coupled closely with an open mind. Was that the first thing that the school systems forgot?
AR5 link
FYI Chap 6 images link
Chap 6 link
Simplistic view: 1ppm out of 400ppm is small, but add 100 years of 1ppm/yr adds 100ppm on top of that 400ppm.
Likewise, the effect of this on temperatures in 1 year is small but they calculate a running sum of energy increasing over time to get wild increases.
Natural processes can amplify but more likely to work against the imbalances (negative feedback) so the models are hard to get right. It would take something like the top500 supercomputers to model the climate in realtime (24hrs to compute 1 day of climate). Current models are toys with lots of shortcuts, assumptions & limits trying to stay in the ballpark. The science of climate models is not settled & not reliable.
Isotope analysis says carbon is cycled more quickly. Carbon cycle mathematics assume only natural carbon is cycled back into nature from the atmosphere.
The isotope analysis & carbon cycle mathematics don’t agree because nature doesn’t care where the Carbon came from.
Imagine 3 buckets: atmosphere, nature, fossil. Start with 50 black balls in the fossil bucket. 200 grey balls in nature & 100 grey in the atmosphere. One person takes 5 balls from nature to place into the atmosphere per 5seconds. Another person takes 2 from fossil to place into the atmosphere per 5secs. A 3rd person takes 6 balls from the atmosphere bucket to place back into nature every 5secs, every 10 minutes adds 1 extra back into the fossil bucket.
You can bias which colour balls are moved from the atmosphere which change the colour ratios but the grey+black would be the same each time. Each person mixing the colours they move will mix the colours in the nature and the atmosphere buckets like we see in reality.
The number of balls in the atmosphere is still increasing over time.
A ball may only stay in the atmosphere a short time but it’s effect on the total number lasts longer. The effect of adding fossil carbon looks diminished when looking at the atmosphere but looking at the total system you notice a larger change. Grey & black are taken from the atmosphere but grey & black are both added back to the atmosphere.
The only difference between grey & black was the ratio of Carbon-14 to Carbon 12 & 13. You can’t tell where individual carbon atoms came from but you can measure the overall trends.
“Carbon cycle mathematics assume only natural carbon is cycled back into nature from the atmosphere.”
No, it doesn’t. Read my paper on the topic
https://pubs.acs.org/doi/abs/10.1021/ef200914u
publicly available pre-print here:
http://theoval.cmp.uea.ac.uk/publications/pdf/ef2011a.pdf
Particularly section on “Fraction of Carbon Dioxide of Anthropogenic Origin in the Atmosphere”, which explain why it is that even though anthropogenic emissions are causing the rise in CO2 levels, only about 3% of the CO2 in the atmopshere is directly of anthropogenic emissions. The reason is that it gets exchanged with “natural” CO2 withing only a couple of years, but this is a straight swap and does not affect atmospheric CO2 levels.
That wdirectly contradicts the assertion that “Carbon cycle mathematics assume only natural carbon is cycled back into nature from the atmosphere.”
Fossil fuels have not been active in the carbon cycle for a very long time. By combusting those fossil fuels a corresponding amount of CO₂ will add up to the present carbon cycle, primarily in the atmosphere but as time goes by as well to other sinks (land & ocean) because of the steadily increasing atmospheric CO₂ concentration.
From the atmospheric CO₂ analysis (Mauna Loa and others) and the globally reported amount of fossil fuels combusted, we calculate that there have to be a net CO₂ transfer from the atmosphere to the other sinks. Mauna Loa are at +-0.2 ppmv and the reported amount of combusted fossil fuels is also rather accurate, assume +-10 %, then the net transfer is for sure from atmos to land and ocean.
If we assume some other sources in parallel also add up CO₂ to the atmosphere, then the Mauna Loa data will show up with figures higher than the corresponding fossil fuels equivalent but Mauna Loa shows lower figures.
Even if the nature’s flow of CO₂ into the atmosphere is very big and not fully known, the nature’s flow out from the atmosphere, into the nature is bigger and accurately calculated from the atmospheric CO₂ mass balance.
Those very big natural CO₂ flows are the main reason for the fluctuating atmospheric CO₂ concentrations seen to follow very close to ocean surface temperature.
Today, as there is a higher CO₂ partial pressure in the atmosphere than prior to the industrial era, there is a lower potential for CO₂ to be released from, and a higher potential for CO₂ to be absorbed into the oceans ==> the yearly net CO₂ flow is from the atmos into the oceans as the system is heading to fullfill the Henry’s law and increased biological activity (bio pump). Also the oceans concentration of dissolved inorganic carbon is going up and pH value is going down as reported from the 1950’s and the land is greening, nice.
Kind regards
Anders Rasmusson
Sorry, my fourth chapter above should be as with the capital letters in :
“Even if the nature’s flow of CO₂ into the atmosphere is very big and not fully known, the nature’s flow out from the atmosphere, into the nature is bigger and THE NET FLOW IS accurately calculated from the atmospheric CO₂ mass balance.”
/ Anders Rasmusson
The carbon cycle graphics are fantasy estimates by confirmation biased people advocating their prejudices.
Recently, diamonds have been proven to have fossil carbon inclusions.
Which provides proof that carbonates and fossilized life have been subducted up to sixty miles deep.
Given that even the youngest diamond pipes are millions of years old. It highlights that carbon compounds are well distributed deep into our Earth.
Plant growth above ground is matched by plant growth underground. Yet those graphic carbon estimates are curiously lacking regarding underground plant growth.
Starting with the fact biased people estimate human CO₂ emissions then fill in the blanks with fantasy estimates for many CO₂ and carbon exchanges for which they have zero to minimal knowledge.
Fantasy natural carbon cycle estimates allows advocates to cause human emissions appear larger than it is.
Fantasy models, including static carbon cycles and their inaccurate results are throughout the entire alarmist enterprise.
A fact that the OCO-2 satellite kept proving as natural carbon cycles overwhelmed human.
Whiten doesn’t believe that! 🙂
The man with one watch that doesn’t run knows precisely what time it is. Each time he checks he gets exactly the same value with zero deviation. The accuracy of thet time may be in doubt. Not much different than a climate model.
Often missed is that the “plus/minus” deviation is a measurement range, a deviation in measured values and isn’t necessarily the range in which the actual value can be found.
Yes, standard deviations are commonly used for sampled data, and depending on the individual and their discipline, one or two sigma may be used. However, 2-sigma is only about 95% of the range.