Guest Post by Willis Eschenbach
I read a new study that claims that El Ninos are triggered by a “transition” in the sun. Sunspots have a cycle of about 11 years. The paper says that the transitions from one sunspot cycle to the next trigger El Nino events.
The study, entitled “Termination of Solar Cycles and Correlated Tropospheric Variability”, Leamon et al., hereinafter L2021, is available here. So are they right?
Well … turns out I couldn’t tell. The first problem I ran into was that they end up with highly improbable dates for their transitions.
They locate the transition using something they call a “band-o-gram”, which they define as:
We introduced the concept of the data‐driven SOHO/SDO band‐o‐gram in our 2014 paper (McIntosh et al., 2014, hereafter M2014), specifically Section 3 and Figure 8 of that paper. There are only three parameters that define each cycle: the time of max of the preceding cycle, that is, the time at which new‐cycle flux appears at 55° in each hemisphere; and the termination point. … M2014 deduced that the temporal overlap and interaction between the oppositely polarized bands of the band‐o‐gram inside a hemisphere, and across the equator, was the critical factor in moderating sunspot production and establishes the butterfly diagram as a byproduct. The terminator is given as the time that the oppositely polarized equatorial bands cancel or annihilate and establish growth on the remaining midlatitude bands. This gross modification of the Sun’s global magnetic field has an impulsive growth on radiative proxies and a corresponding, inverse, relationship on the CRF as shown in Figure 1.
Here’s the first problem. These are the dates that they get for the transitions.

Figure 1. Observed terminator dates from L2021.
The problem?. From this it appears that the dates are assigned to either the start or the middle of the month … why? They’re using satellite data, their “band-o-gram” is supposedly very accurate … why the half-month rounding?
Second problem. It appears that the “band-o-gram” sometimes doesn’t work, so they apply “temporal shifts” to the dates … such “ad-hoc” procedures always make me nervous.

Figure 2. Observed terminator dates and “temporal shifts” from L2021.
Third problem. Two of the “temporal shifts” are exactly 100 days, and all three of them are even multiples of ten … odds on that?
So that makes our “temporally shifted terminator dates” as follows:
- TERMINATOR DATES
- June 1, 1966
- January 1, 1978
- February 22, 1988
- August 31, 1997
- March 25, 2010
This leads to the fourth problem. They refer in their note above to “See Figures 4 and 5”. Here’s their Figure 4.

Figure 3. This is the L2021 Figure 4. Original Caption: “Comparing more than five decades of solar evolution and activity proxies. From top to bottom: (a) the total (black) and hemispheric sunspot numbers (north—red, and blue—south); (b) the latitude‐time variation of sunspot locations; (c) the Oulu cosmic‐ray flux; (d) the Penticton F10.7 cm radio flux; (e) a data‐motivated schematic depiction of the Sun’s 22 years magnetic activity cycle; and (f) the variability of the Oceanic Niño Index (ONI) over the same epoch. The black dashed lines mark the cycle terminators.”
The fifth problem is that in their Table 1A above, the fourth termination is August 1, 1997, and plus the 30-day temporal shift it’s August 31, 1997. But if you look at the vertical dashed lines marking the terminators in Figure 3 just above, it’s not in August of 1997. It’s in the early part of 1998. And the one that’s supposed to be on March 25, 2010 is actually on January 1, 2010.
The sixth problem is visible in the second panel from the bottom. The first four transitions are at the termination of each cycle, where the faint dotted lines cross … but the fifth one is not. And the sixth transition, listed in their Table above, isn’t shown at all.
The seventh problem? It has to do with how they’ve defined an El Nino/La Nina event. The paper says:
First, we observe from Figure 4 that there are 13 major El Niño to La Niña transitions (defined as a change of the NOAA ONI index of −1 in less than 12 months) over the duration of the data set; the mean gap between them is 57.4 ± 25.5 months.
It’s not entirely clear what this means. Do they take every 11-month period (including overlaps) in the record and see if there was a 1-index-unit drop at any point in that 11 months? Because if you do that, you find that of the 844 11-month periods (including overlaps) in the record, there are no less than 246 of them with a 1-unit drop.
And what if the one-unit drop is from high up in the red (warmer) part of the graph to a point that is lower but still in the red part of the graph? Count it or not?
And if you’re not using overlapping 11-month periods, where do the non-overlapping periods start in each year?
But that’s just the technical difficulties with their definition
The first real problem with their definition is that it totally ignores the actual nature of the Nino/Nina transitions. It is called the “El Nino” for a reason—because it happens around Christmas. It starts in November ± two months. And the second problem is, the Nino/Nina transition ends with a “La Nina” approximately one year later, once again around Christmas, once again in November ±2 months.
Here is the Oceanic Nino Index, their chosen Nino Index, with those ~ Christmas peaks and troughs identified.

Figure 4. Oceanic Nino Index (ONI) along with the peaks and valley that occur in November ± two months (circles)
Given that pattern, how should we define a Nino-Nina transition? Let me suggest that a Nino/Nina transition starts at one of the circles in the red (warmer) area, ends a year later at the succeeding circle in the blue (cooler) area, and drops more than a certain amount.
What should the “certain amount” be? Well, here’s what it looks like if we set the threshold at a minimum drop of 3 index units. The “El Nino Events” are shown by the ~ one-year-wide red vertical areas with dotted edges.

Figure 5. Oceanic Nino Index (ONI) along with the peaks and valley that occur in November ± two months (circles). Vertical red sections with dotted edges show the six largest El Nino/La Nina transitions, those with a drop of at least 3 Index Units.
This shows the six largest El Nino events since 1950.
And finally, here are the locations of their “solar transitions”.
Figure 5. Oceanic Nino Index (ONI) along with the peaks and valley that occur in November ± two months (circles). Vertical red sections with dotted edges show the six largest El Nino/La Nina transitions, those with a drop of at least 3 Index Units. The vertical yellow/black lines show the L2021 solar transitions.
To summarize:
• Figures 4 and 5 show the six largest Nino/Nina events. Three of them have no association with the L2021 solar transitions.
• They’ve shown six solar transitions. One of these occurs at the start of a large Nino/Nina event. Two of them occur in the middle of a large Nino/Nina event. Three of them are not associated with a large Nino/Nina event.
From this, we can see that solar transitions occur without associated large Nino/Nina events, and large Nino/Nina events occur without associated solar transitions. Hmmm …
In closing, I can’t really say if their results are significant or not, because of the seven problems I listed above. They may be, but the story is far from complete. I can’t reproduce their results, the sample size is very small (six solar transitions), their dates don’t match their graphs, and there is no clear (or agreed upon) definition of what makes an El Nino event, so I can’t conclude much of anything.
For one of my next investigations, I’ll see what I find when I extend their results further back in time. The Oceanic Nino Index is virtually identical to the NINO34 index, which goes much further back, all the way to 1870. We also have sunspot data going back that far. I’ll report back on that question whenever I get around to it.
Let me say in closing that I have a very different understanding of the El Nino/La Nina event. It functions as a huge Pacific-wide pump, moving an untold amount of warm water poleward where its heat more easily radiates to space. It also exposes a large area of cooler sub-surface Pacific water to the atmosphere. In both cases, it cools the surface. I’ve discussed this in a post called The La Nina Pump, and there are other posts of mine on the subject here.
In my understanding, the La Nina pump is an emergent phenomenon that is more common in warming times. I’ll investigate this as well.
And on our lovely coastal hillside, I’ve gotten about an acre of our sloping yard mowed, and I’ve gotten the new gatepost concreted in and the gate re-hung. However, I fear I’ve been thrown into Facebook jail again, for seven days this time … I’ve listed my sins of commission on my website here.
Best of the world to all,
w.
“In my understanding, the La Nina pump is an emergent phenomenon that is more common in warming times”
That isn’t necessarily inconsistent with their findings after one considers variable oceanic inertia whilst irregularities progress through all the ocean basins.
My conclusion is that, over a couple of solar cycles or more, solar induced cloudiness changes alter the amount of energy getting into the oceans so that the balance between El Nino and La Nina events changes.
When the sun is less active that tends to favour La Ninas because less solar energy is getting into the oceans and El Ninos weaken.
However it is nevertheless true that when the sun is active then El Ninos get stronger and La Ninas perk up as well to increase energy transport around the system and try to offset the El Nino warming effects in the atmosphere.
In the end though it is simply a matter of how much solar energy gets past clouds and into the oceans.
Less clouds cause warming and more clouds cause cooling.
And it is not the Svensmark effect but rather jet stream variability because increased meridionality creates longer lines of air mass mixing and thus more clouds.
Stephen, 10 out of 10
Clouds are the shutters that control how much sunlight the oceans can absorb. Over the long term the Ocean temperature changes enough to materially affect the cloud cover of the planet. Warmer = more cloud cover…..More Cloud cover eventually results in ocean cooling….Time constant of the bulk cyclic ocean warming and cooling is hundreds of years. Punctuated by 25,000 year Milankovitch cycles.
Effect of CO2….slight altitude change of cloud tops….
Willis,
Likely this “Sin” comes from the lack of following CC Tenet and utilizing cement to affix your Gateposts. How can you easily move the Gateposts if they’re cemented in?
Thanks, Stephen. I’ve looked over and over for any evidence of “solar induced cloudiness” without success. If you have a link to such evidence, now’s the time …
Nor have I found any correlation between ocean temperatures and solar activity. Same request …
Next, you claim without evidence that “it is nevertheless true that when the sun is active then El Ninos get stronger” … same request.
Regarding “jet stream variability”, what are the units used to measure that?
w.
Willis
lts the effects that changes in the jet stream have on the weather that’s a key thing to understand. Currently thanks to how widely extended the jet stream is over the mid Atlantic it is limiting the formation of the Azores high.
Because of this then high pressure is forced to form to the south or well up to north of this area. As low pressure tends to form on the north side of the jet. Which forces the highs to form in the northern Atlantic and so shifts the air mass that is flowing over europe. The more that changes within in the jet stream increase the chance of northern Atlantic blocking. then the more risk there is of europe’s climate cooling.
Taxed, again I ask: what are the units used to measure “changes in the get stream”? Because without measurements there is no science.
w.
Well only way a can see you will be able to measure the effect above. Would be to measure the speed and flow of the jet stream over the Azores and then see if that is linked to the formation of blocking over the northern Atlantic and a decline in the Azores high.
Willis, that’s the problem w/these pet-theories — no data/evidence like you present. Just cheap talk.
The meridional jetstream favours El Niño because it disrupts the easterly wind along the equator.
La Niña kicks in when the solar wind increases, as it does now, at the beginning of the solar cycle. Depending on the increase in solar activity, we may have a stronger, or weaker La Niña and similarly an El Niño. A weak cycle will result in a weak La Niña and a long weak El Niño.
ren
Not only that but the way the jet stream is currently behaving over the Atlantic. lts going to increase the amount of blocking over the northern Atlantic, which will have the effect of cooling europe’s climate due to the increase of the air mass flowing down from the Arctic.
The dependence of the stratospheric polar vortex and associated jet streams during the winter-spring season is all too apparent. As many years of low solar activity are forecast, the winter anomalies will force scientists to address the effects of solar activity on the stratospheric polar vortex.
The current state of the jet stream has been a real eye opener for. For it explains the how and why the weather patterns allowed for the extended cold winter weather to hit europe during the LIA.
Lock for Michael Lockwood and his papers.
It’s linked to the low UV radiation and a cooled shrinking thermosphere.
ren, again I ask: what are the units used to measure jet stream variability? Because without measurements there is no science.
I see people doing immense amounts of handwaving about how “jet stream waviness” does this and “jet stream variability” does that, but how is it measured?
I don’t know how it’s measured, but it’s observed. You can determine the periods when the jet current is blocked.
Atmospheric blocking is commonly referred to as the situation when the normal zonal flow is interrupted by strong and persistent meridional flow. The normal eastward progression of synoptic disturbances is obstructed leading to episodes of prolonged extreme weather conditions. On intraseasonal time scales the persistent weather extremes can last from several days up to a few weeks, often accompanied by significant temperature and precipitation anomalies. Examples of the 500 hPa height and anomaly fields associated with mature blocking episodes over the northeastern Atlantic and the North Pacific. These two regions are preferred areas for atmospheric blocking during the northern hemisphere cold season.
A common finding among scientific studies is that these long-lived weather extremes are associated with recurrent atmospheric flow anomalies. Numerous studies have found that the poor forecast skill beyond a few days results principally from the inability of numerical weather prediction models to simulate the onset and evolution of blocking flows.
https://www.cpc.ncep.noaa.gov/products/precip/CWlink/MJO/block.shtml
The effects of the solar minimum have been looked at for a many years.
Crop yield studys have shown a direct effect.—>
https://naldc.nal.usda.gov/download/CAT76674961/PDF
https://www.newscientist.com/article/dn6680-sunspot-activity-impacts-on-crop-success/
Jet stream variability might be measured by bushels per acre.
The former Chairman/CEO of CARGIL was a keynote speaker
at a Farm Bureau annual meeting locally a few years ago. He
had stepped down as the head executive but was still on the board
as the head of the risk management unit. He gave an interesting
view of what one of the largest food production companys in the world
largest risk was. He said that the merdional jet stream was the largest
risk. His view was that arctic warming was causing the wavy jet.. but
their weather unit was not sure. It seems that the slowness of fronts
moving has an effect on crop production. both hot weather and cold
weather…Look at the production a couple years ago in the upper
Mississippi Valley during the end of SC24 for an example.
Dan Edens April 8, 2021 8:57 am
Dan, I just looked at both of those links. They neither mention nor consider the Bonferroni correction or the effect of autocorrelation or the nature of statistics of repeated phenomena like sunspots. Not impressed. Here’s a more rational look at the question.
w.
I see your point as being strictly academic. I see things
from the view point of an ag producer. That’s my interest
for reading this blog. The first paper noted that their finding
didn’t change when production methods increased the crop
yields, except in wheat in NB
That is significant, to me. The AG sector
has been riding production technology for the past
century but the dips on the double cycle are clearly evident and
noted by the author…
Dan, statistics are as far from “strictly academic” as it is possible to get. They were invented inter alia by gamblers, to keep them from believing in things that simply didn’t stand up to close examination … you know, like the idea that sunspots affect crop yields.
Now, you’re free to wave your hands and proudly proclaim that despite well-known and well-understood statistics saying otherwise, you believe in all kinds of improbable and statistically unlikely things.
Me … not so much …
Read the link I sent you in my last comment to you, and point out the errors for us … here’s another one for your criticism.
w.
During La Niña easterly winds pump warm water into the western Pacific to great depths.
http://www.bom.gov.au/cgi-bin/oceanography/wrap_ocean_analysis.pl?id=IDYOC005&year=2021&month=04
During El Niño, the ocean releases heat into the atmosphere.
Hallo Stephen
Is it how much solar energy makes it through the clouds or is it how much UV gets through the ozone layer?
Remember that light in the visible and IR range does not heat water all that much – i.e. to make those clouds in the first place.
Clouds are not caused by “heating water” (unless you are talking about water heating at the earth’s surface, that starts the evaporation process that puts water vapor into the air in the first place).
Clouds are an emergent phenomenon resulting from water vapor being carried to great height by thermal updrafts, and adiabatic cooling causing the now less-energetic water molecules to want to cling to tiny particles in a chain reaction that eventually leads to ice crystal growth and then aggregating into little ice pellets that eventually get heavy enough to fall out of the cloud and then melt into rain drops if the lower troposphere is warm enough.
Water vapor in the air does absorb IR but this has nothing directly to do with clouds but does have something to do with the “greenhouse warming”, which may or may not have some indirect influences on the cloud formation processes. This is the controversial “water vapor feedback” factor in the GCMs.
Water at the surface warms via both absorption of the sun’s photons (radiative heating, mostly from the visible photons), absorption of IR photons from the atmosphere (i.e. the “greenhouse effect” radiation) and heat transfer from the atmosphere (conductive heating). The warming of the ocean surface is tempered by cooling from the resultant evaporation of water (via the latent heat of vaporization). This tempering effect is likely the driving factor in the ~29C ocean temperature limit that Willis always talks about.
Excellent, thanks
On the graph I can see some 14 or 15 warm-cold transition and 5 dashed lines presumably denoting warm to cold transitions, so it is expected that some will fall within a year or so from SC minima.
Thanks, Willis. I don’t have the scientific chops to do this kind of analysis, but I appreciate your doing so.
The decrease in solar wind activity in March and April 2021 caused a strong deceleration of the ENSO cycle.
http://www.bom.gov.au/archive/oceanography/ocean_anals/IDYOC007/IDYOC007.202104.gif
I have no clue what a “deceleration of the ENSO cycle” means or how it might be measured.
w.
The best way to look at the SOI index.
https://www.longpaddock.qld.gov.au/soi/
Ren, when your best friend doesn’t understand your explanations do you call him a “fat bloated idiot”
Everyone is entitled to their opinion.
Pressure drop at Tahiti is a good sign along with everything else. Lines up with my own El Nino forecast for 2021 that I made almost a year ago. Solar activity has taken a step back. Late 2020 solar surge was not unexpected as well. Even gave out a timeline before hand about the upcoming uptick. (10/27-11/7) El Nino forecast below. ENSO seems to favor a later season development the past several years. ONI wise. Just a coincidence? Maybe IDK.
https://twitter.com/JimWindweather/status/1263263982154113024
Seriously, just 63 days data – and you are prepared to claim that it indicates something ?
Maybe if you had 63 years data, and explained your theory of how whatever it is you are measuring is related to whatever you are claiming, (and did not expect every reader of WUWT to be intimately familiar with every arcane aspect of meteorology or other natural science), then maybe we would be less dismissive of your contribution.
Pro tip – when you put a date on a graph or a picture – like those GIFs you reference – it’s considered good practice to include the year not just day and month. Real professionals include a heading, as well.
“the “band-o-gram” sometimes doesn’t work”
Should it be called “the band of hope”
https://en.wikipedia.org/wiki/Hope_UK
Those doing this research cannot state that there might be a link or there might not be when they want to keep their source of funding flowing. It is hard raising funds for pure research without being able to claim that this will have real benefits for people.
I believe that careful observation and recording of patterns is a good exercise and may prove helpful for anticipating certain weather conditions and climate changes.
Also anticipating transitions in the Sun 🙂
Willis, thanks for this… by just reading the press summary (via, research news) I had the impression that the relationship was quite solid… but now it is unclear.
The other thing your post reminded me of is my filing cabinet full of “reviewer comments” that I received via the peer review process over many years (in a more fundamental branch of science). It would have chagrin me greatly to have any of those hashed out publicly, verses the normal interactions between author, reviewer and editor. So, it is pity (and I say this sincerely) that they did not have a reviewer like yourself before they went to print, because all that we have now is a flattering press release and a boat load of doubts. (sigh)
El Niño Forecast Revisited
On 11 January 1999, my paper “Solar Activity Controls El Niño and La Niña” was published on this web site. It included a forecast of the next El Niño around 2002.9 (End of November 2002). As this date is approaching, it seems to be in order to give a short delineation of the background of this forecast for those readers who are interested in an explanation of the general concept, but shun technical details. This all the more so as there are first indications that an El Niño is in the making.
My forecast is exclusively based on cycles of solar activity. This does not conform to the dominating trend in official science. The Third Assessment Report, published by the Intergovernmental Panel on Climate Change (IPCC), continues to underestimate the Sun’s role in climate change: “Solar forcing is considerably smaller than the anthropogenic radiative forcings”, and its “level of scientific understanding” is “very low”, whereas forcing by well-mixed greenhouse gases “continues to enjoy the highest confidence level” as to its scientific understanding. The Third Report considers it “unlikely that natural forcing can explain the warming in the latter half of the 20th century.” There are also frequent assertions in the literature that there was only a negligible effect of solar activity on temperature in recent decades.
Always worth reading as the other paper linked above in the quote.
Since there was no El Nino event starting at November 2002, I’d say your forecast was a total failure … what am I missing here?
w.
What you are missing is the weaker El Niño late in 2002 😀
Abstract[1]
Long time series of high quality ocean surface topography, sea surface temperature, subsurface temperature and salinity information allow a thorough comparison between two distinct El Niño events. The 1997 El Niño showed a strong ocean‐atmosphere coupling which propagated from west to east. The weaker 2002 event developed later in the calendar year and showed strongest anomalies near the dateline. In this study, observational data of sea level and sea surface temperature from satellite, and subsurface temperature and salinity (from all available sources including Argo) are used along with data assimilation to improve the initial state estimation of the ocean.
Source
I’m sorry, Krishna, but an El Nino/La Nina event starts around Xmas in the red (Nino) region of the graph and ends around one year later in the blue (Nina) region. Here’s Figure 4 from above:

Around Xmas 2002, it started out just a bit above 1 unit into the red. It barely dipped into the blue, and then by Xmas 2003 it was back into the red.
That’s just normal fluctuation on my planet, not a “weak” El Nino event. And if you predicted an El Nino event … your prediction failed.
w.
Or please take that:
EVOLUTION OF THE 2002/03EL NIÑO
An El Niño of moderate intensity developed in the tropical Pacific in 2002/03. This event, though not as strong as the 1997/98 El Niño, had significant impacts on patterns of weather variability worldwide. The evolution of the 2002/03 El Niño is documented through comprehensive satellite and in situ observations from the El Niño-Southern Oscillation (ENSO) Observing System. These observations underscore the importance of both episodic atmospheric forcing and large-scale low-frequency ocean–atmosphere interactions in the development of the event.
I have no idea why you will tell me, late 2002 El Niño didn’t exist ?
If that’s an “El Nino Event”, then they happen four years out of five. Sorry, still not buying it.
w.
So there are 2 different views, you won’t accept, others declare it as a weak El Niño, but, as emphasised in my comment:
and showed strongest anomalies near the dateline. In this study,
Among the impacts of the 2002/03 El Nino were drier-than-average conditions over much of Indonesia, northern and eastern Aus-tralia, and northeastern South America during the latter part of 2002 and early 2003. Likewise, Indian monsoon rainfalls were deficient in the summer of 2002. Wetter-than-average conditions prevailed over the central equatorial Pacific from mid-2002 to early 2003, the southeastern United States during boreal fall and winter 2002/03, and southeastern South America during September-December 2002. The Pacific Northwest and Alaska experienced an unusually warm 2002/03 winter season. Tropical Atlantic hurricane activity was reduced, as usually happens during El Nino (Pielke and Landsea 1999), with only four hurricanes forming in 2002 compared to eight in typi-cal years since 1995.
[…]
PEAK PHASE. El Nino anomalies peaked for most oceanic and atmospheric variables (e.g., equatorial SST, zonal wind, eastern Pacific thermocline depth) during October-December 2002 or slightly later (e.g., January 2003 for deep convection and rainfall near the date line). The Nino-3.4 SST anomalies (i.e., averages over 5°N-5°S, 120°-170°W) reached 1.8°C in November 2002, approximately equal to peak values during the moderate-strength 1986/87 and 1991/92 El Ninos (Fig. 1) and larger than expected from forecasts during the early stages of the event. Largest SST anomalies were concentrated in the central equatorial Pacific, with localized maxima over 2.5°C near 170°W (Figs. 2b and 5a). Conversely, SST anomalies were relatively weak and short-lived in the eastern Pacific and along the west coasts of the Americas (Fig. 5a). The spatial pattern of anomalies resembled that ob-served during the 1994/95 El Nino but contrasted that of the 1997/98 El Nino and most previous events (Rasmusson and Carpenter 1982; Harrison and Larkin 1998). Typically, largest SST anomalies are concentrated farther east along the equator and coastal warmings are more pronounced.
Better read the complete paper, it was linked above.
Willis, I am a little confused at the yearly time frame you stand by for declaring something an El Nino. The historical reference from South American records is noteworthy but events can grow differently. The ONI also shows much earlier developmental time frames than Nov-Dec. Am I missing something in regards to how you are measuring them being around ?
Jim, the circles I show for the peaks and troughs are all within 2 months either side of November … not sure which “earlier developmental time frames” you’re referring to.
In the period 1870-2020, the swings from peak to valley have been as short as 8 months and as long as 16 months, but the mean is 12 months ± 1.75 months.
w.
Yes the late fall through winter will always show the swings better depending upon how the data is looked at. I was just referring to the CPC’s trimonthly ONI reading alone as an indicator. June 2002 would have been the beginning of the 2002-03 event. This was my only point.
ENSO predictions based on solar activity
In 2000 Theodore Landscheidt published an article in the proceedings from a meeting presenting his hypothesis of a solar forcing of El Niño and La Niña. He was not the first to defend such hypothesis, as 10 years earlier Roger Anderson (1990) had published some evidence for a solar cycle modulation of ENSO as a possible source of climatic change. Landscheidt’s (2000) article contains two observations and two predictions. The first observation is that most extreme ENSO events correlate with the ascending or descending phase of the solar cycle. He predicted the following El Niño based on the sun’s orbital angular momentum for 2002.9 (± 0.4). It was a 2-year ahead accurate prediction, as the next El Niño started in 2002.67. The second observation was the alternating preponderance of El Niño and La Niña following the 22-year Hale magnetic solar cycle. The 1954-76 Hale cycle showed Niña preponderance, and was followed by the 1976-96 that presented Niño dominance. While this is based only on two complete Hale cycles for which there is instrumental ENSO data it is interesting to read Landscheidt other prediction:
“If the pattern holds a preponderance of La Niña is to be expected during the Hale cycle that began in 1996.”
The Hale cycle-ENSO association is unclear to me due to insufficient data but it is undeniable that both of Landscheidt predictions were correct. Anderson’s and Landscheidt’s articles were completely ignored by the scientific community and they are rarely cited even by authors studying the same subject.
Respect for your work. I think the 25th solar cycle will be so weak that many connections between solar activity and Earth’s climate will be revealed.
He Ho, not my work, it’s Landscheidts resp. the text is from Javier at Dr. Currys site.
Theodore was was brilliant but stubborn. Got offended when I told him I could help him out via emails. He never looked into certain specific things prior to his open discussion with Omar on John Daley’s site in early 1999. Yet I had specifically talked about the relationship of the June 1991 solar flaring, in an open chatroom discussion with Ants Leetma, former Director of the CPC, in 1997. He was to much into the Golden Section early on. Had legs but he was not looking at the bigger picture. Which Scott McIntosh and others are trying to do. They are close though.
I guess it depends on your definition of accuracy. Half a month out of an eleven or twenty-two year cycle is less than 1%.
One of the things about climate scientists that is intolerable is to do calculations on very messy data and claim to produce accuracies of 0.1%.
So, the important question is whether the temporal accuracy of their terminator events is sufficient to back up their hypothesis.
If I have understood the study correctly, it has enough data to generate a hypothesis. The rule is though that you must use different data to test the hypothesis.
Am I wrong in thinking that these folks have generated a hypothesis but have not tested it?
You miss the point, Bob. They have data down to the very day for the solar variables. So why the rounding?
As to the test of their hypothesis … I’m working on it.
w.
ENSO is an autooscillator. Has nothing to do with the Sun magnetic period.
I’m interested, could you elaborate?
I believe the Oceans influence the weather/climate everywhere, it’s what controls the Oceans that interests me and I’ve always believed there’s a link to magnetic fields.
Oscillators will phase lock with other oscillators when sufficient coupling exists. An example is pendulum clocks sync’ing with each other due to the slight coupling through the floor of wall.
What is influencing the rythm of he oscillation as there isn’t a fix one ?
Yeah but it’s a really crappy autooscillator whose frequency changes every time someone on the next planet over sneezes. There is an oscillator called a Theremin whose frequency changes if you wave your hand at it. It’s like that.
Willis,
Thanks for bringing your insights to the public! I was thinking of the LaNina as an emergent heat engine, but heat pump is definitely more accurate! It pumps warm water west to the Pacific Warm Pool and into the atmosphere for distribution to colder areas depending on the location and strength of the Walker Circulation and other atmospheric phenomena.
Could inertia from the size and heat capacity of the Pacific be a confounding factor that masks the underlying cycles, or are there more cycles and factors involved then it appears at first glance? I was also wondering if there could be some type of feedback mechanism in the PDO that causes it to oscillate between El Niño and La Nina conditions until dampened!?
I see you’re looking for some round tuits; I used to buy them in bulk and I may have one or two sitting around in a toolbox somewhere I can send you if needed! Let me know!
Hmmm… Are our fossil fuel crimes on earth causing the sun god to react badly, too? I thought only our dear Gaia was hurt by our inconsiderate actions.
How many more signs do we need to see from the gods before we repent of our sins!?
“Band-o-gram”
More than just a singing telegram
I must say, I find it hard to dismiss correlations between solar cycle transition and strong La Niña. Data talk for itself. The question is about the mechanism?
BTW. I’m building a deep Artificial Neural Network model where I use aa index, tidal forcing and QBO as input for the model. I use out of the box idea for my model. I coming days I hope to find out if this approach is working or not after working on it for years..
This is what actual, honest peer review looks like.
At this point in the discussion, I hope Leif Svalgaard shows up to give some input on the solar ideas in this research by Leamon et al.
Sometimes papers are so bad they are not even worth an expert bothering to read it much less chime in.
And Willis pretty much demolished it already.
I’ll have to say if you adjust the chart’s vertical lines for the correct adjusted dates they do line up pretty well with + to – zero crossings in the ONI. But perhaps their choice of the seemingly arbitrary “temporal shifts” were helping to create an illusion of an unlikely coincidence.
But even if you accept that, it is not really much a predictor of significance, as Willis demonstrates. This is just horrible and useless (I was tempted to add the word science, but decided not to dignify it).
I get the impression that they noticed that the transition fron El Nino to La Nina was often close to the bottom of the sunspot cycle, and were then a little too enthusiastic about finding something that coincided and made it more exact than it really was. The really really difficult thing about it is that the Earth-based El Nino comes before the sun-based terminator so cannot be caused by it but cannot be causing it.
They may have found an interesting correlation, and to their credit they do say that’s all it is so far, so there’s work ahead for those that want to work out if there is a causing mechanism somewhere.
Seems they kept fudging things until they found what they were looking for. Not unlike detectives framing an innocent man.
Hated typo: “From this it appears that the dates are assigned to either the start of the middle of the month”. Should be “…either the start or the middle…”.
Thanks, William. Yes, I do hate typos.
w.
Willis,
The sun causes the cyclic warming and cooling by changing ‘something’ which changes the earth’s geomagnetic field.
I ‘know’ that because the past abrupt changes to climate have been found to correlate with recently discovered abrupt geomagnetic excursions which are not explained as to cause.
And interestingly the earth’s magnetic field started to abruptly change in 1995 correlating with a sudden unexplained increase in mid-ocean earthquakes which occur at the 1000 mile long ridge where the ocean plates are pushed apart.
And the changes in mid-ocean ocean ridge earthquakes lead by two year the El Nino events.
 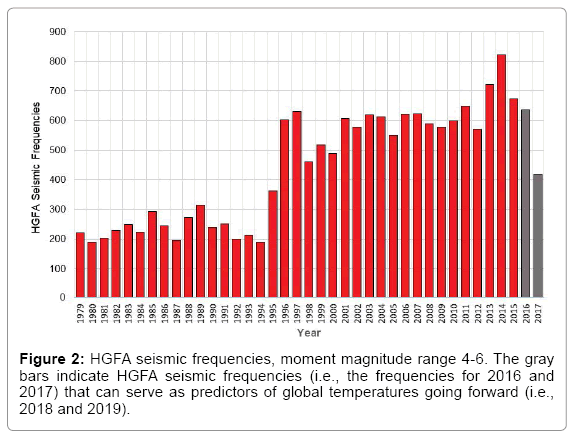
All over the planet starting in 1995, there was suddenly a 300% increase in the frequency of mid-ocean ridge earthquakes of magnitude 4 to 6 all over the earth, at the mid ocean ridges, where the sea floor is being pushed apart.
And at the same time that there was a sudden increase in mid-ocean earthquakes, the magnetic field of the earth started to unexplainably abrupt change. (See quote from surprised scientists)
Deep in the ocean, all over the planet the ocean floor plate is being pushed apart in two directions. At a ridge. The pushing a part of the ocean plate cause magma to rise up from deeper in the earth to form new ocean plate.
The heat from the 1000 of miles of magma that is coming up at the ridge heats the water and causes surface changes which in turn cause cloud changes. This explains how a relatively small amount of heat deep in the ocean can cause the El Nino events.
This is a quote from the paper that discusses the unexplained sudden increase in mid-ocean ridge movement and the correlation of changes in the mid ocean ridge movement with planetary temperature changes.
“The resulting correlation between the HGFA frequencies and the lagged global temperatures is 0.777, a statistically significant outcome that explains 60.3% of the variance in global temperatures. By contrast, an unlagged pairing of CO2 concentrations (ppm) with global temperatures yields a (lower) correlation of 0.735 (Figure 4) [12]. More importantly, multiple regression analysis reveals that mid-ocean seismicity is a significant predictor of global temperatures (p0.05) (Table 1)”
https://www.omicsonline.org/open-access/have-global-temperatures-reached-a-tipping-point-2573-458X-1000149.pdf
As you can see the Greenland Ice Sheet warms and cools cyclically. Driven by something. i.e. Something in the past cause the warming and cooling,
Could what we are experiencing now ‘the short 30 year warm period’ be a Dansgaard-Oeschger warming event that is going to be followed by a Heinrich event?
100% of the scientific imagination is being CO2 causing the recent warming.
What physically caused the geomagnetic field to abruptly just change?
And at exactly the same time cause the increase in mid-ocean earthquakes all over the planet?
http://www.climate4you.com/images/GISP2%20TemperatureSince10700%20BP%20with%20CO2%20from%20EPICA%20DomeC.gif
Comment:
There rapid cyclic changes in temperature where not captured in the Antarctic Ice cores.
About 10 years ago the geomagnetic proxy specialists found that earth’s magnetic field has abruptly changed in the last 1000 years and these abrupt changes in the geomagnetic field correlate with the cyclic planetary temperature changes.
http://news.yahoo.com/earths-magnetic-field-weakening-10-times-faster-now-121247349.html
“Earth’s Magnetic Field Is Weakening 10 Times Faster Now
…Previously, researchers estimated the field was weakening about 5 percent per century, but the new data revealed the field is actually weakening at 5 percent per decade, or 10 times faster than thought. As such, rather than the full flip occurring in about 2,000 years, as was predicted, the new data suggest it could happen sooner.
Oddly enough, in 1995 the magnetic field of the earth abruptly started to change.
“…Previously, researchers estimated the field was weakening about 5 percent per century, but the new data revealed the field is actually weakening at 5 percent per decade, or 10 times faster than thought.
Suddenly…. I kid you not the earth’s magnetic field intensity started to drop ten times faster.”
http://geosci.uchicago.edu/~rtp1/BardPapers/responseCourtillotEPSL07.pdf
Response to Comment on “Are there connections between Earth’s magnetic field and climate?, Earth Planet. Sci. Lett., 253, 328–339, 2007” by Bard, E., and Delaygue, M., Earth Planet. Sci. Lett., in press, 2007
Also, we wish to recall that evidence of a correlation between archeomagnetic jerks and cooling events (in a region extending from the eastern North Atlantic to the Middle East) now covers a period of 5 millenia and involves 10 events (see f.i. Figure 1 of Gallet and Genevey, 2007). The climatic record uses a combination of results from Bond et al (2001), history of Swiss glaciers (Holzhauser et al, 2005) and historical accounts reviewed by Le Roy Ladurie (2004). Recent high-resolution paleomagnetic records (e.g. Snowball and Sandgren, 2004; St-Onge et al., 2003) and global geomagnetic field modeling (Korte and Constable, 2006) support the idea that part of the centennial-scale fluctuations in 14C production may have been influenced by previously unmodeled rapid dipole field variations.
“The ComCat earthquake catalog contains an increasing number of earthquakes in recent years–not because there are more earthquakes, but because there are more seismic instruments and they are able to record more earthquakes.”
w.
Willis,
Your comment is not correct. I am curious why you made it.
There is specific monitoring equipment (at the mid ocean ridges) that was installed to measure mid-ocean earthquakes, as noted in the two papers that were written to analysis the results.
This unexplained rise in mid ocean ridge earthquake frequency means the ocean plates are moving apart faster.
This is a link to the first paper.
https://principia-scientific.com/the-correlation-of-seismic-activity-and-recent-global-warming-2/
The Correlation of Seismic Activity and Recent Global Warming
However, the majority of earth’s geothermal heat is released along the mid-ocean spreading zones [4,6], a 67,000 km tectonic complex for which we have very little data (Figure 1). The problem in accurately assessing heat flow from these high geothermal flux areas (HGFA) is that they are poorly sampled. Located in the middle of ocean basins at great depths, they are far removed from the predominantly land-based seismic network.
According to Langmuir and Forsythe [7], we are still in the “very early stages of understanding” these extensive, complex tectonic systems. Compounding the problem is the fact that most of the activity from these zones is below the threshold of the global seismic network.
Microseismic studies with dense field arrays show that the bulk of that activity in these areas is in the 1- to 3-magnitude range [8], while magnitude 6 events appear to be the upper limit [9]. In addition to the mid-ocean spreading zones, a second tectonic feature that merits consideration is the globe’s back-arc basins
The rationale for the design is well understood and amply documented in the literature: seismicity is strongly associated with geothermal flow [19-21] and it is easily deduced that increasing seismicity will indicate increasing geothermal flux. Furthermore, most of that flux should be realized at the globe’s HGFA [4]. Therefore, earthquake data from the IRIS Wilber 3 global dataset (available online at http://ds.iris.edu/wilber3/find_ event, accessed 1/15/2016) for events with magnitudes between 4.0 and 6.0 (MAG4/6) were compiled for a number of the earth’s HGFA (Table 1).
William, the jump in the number of quakes detected from ~ 1994 to 1996 was due to the retirement during that period of the outdated analog-based World-Wide Standardized Seismograph Network (WWSSN), and its replacement by the much more sensitive digital-based Global Seismograph Network (GSN).
As you might imagine, this led to many more earthquakes, especially smaller or distant underseas earthquakes, being detected by the GSN. I’m sorry, but the jump in quakes you are seeing along the underseas spreading centers is an artifact due to the new network having both more, and much more sensitive, seismometers.
Best regards,
w.
Willis,
I assume you did not read the papers. Your comment is not correct.
The old equipment can measure magnitude 4 and greater earthquakes. The change in earthquake frequency at deep ocean ridges that are spreading did not increase all over the planet by a factor of three because of change in earthquake detecting equipment 1994 to 1995.
What a odd comment. Why did you make it? Any data? Someone told you that?
The author thoughtful ensure that changes in equipment sensitivity did not change the number of greater than 4 magnitude earthquakes detected.
“Although it would be ideal to capture the full spectrum of seismic activity in these areas, the low-magnitude events are excluded from the analysis since only earthquakes with magnitudes greater than 3.9 are detected at sufficiently high levels (approximately 90%) by the global network [22,23]. “It is odd you make you comment as if you are sure it is correct with zero data.
As if you had knowledge about what is causing the strange pattern of warming and cooling.
And there are other papers that validate that changes in the spreading rate of the mid-ocean ridges causes a change in surface temperature.
“Despite the fact that the total amount of heat from geothermal sources is thought to be relatively small, numerous studies have shown their impact to be significant. Carmack et al. [11] show that underwater geothermal heat can trigger thermobaric convection (TC), a ventilating mechanism that raises the thermocline, amplifying the transfer of heat from the ocean to the overlying atmosphere [12].
In Polar Regions, this can destroy the cold, mixed layer, exposing warm, saltier water underneath within a short period of time. Geothermal heating of bottom water also increases the strength of oceanic overturning [13], and is responsible for increasing Pacific basin temperatures by 0.5°C three km below the surface [14].”
Why Willis, are changes in mid-ocean earthquakes leading again and again changes in planetary temperature by two year?
Willis each time there is an El Nino two years before there is a rise in mid-ocean earthquakes.
i.e. The change in the frequency of 4 to 6 magnitude earthquakes leads by two year strange temperature changes on the earth.
A two-year lag adjustment (Figure 7) puts the temperature and seismic curves in phase, producing a statistically significant correlation of 0.785 (r 2 =0.617; df =34; F=53.1; P=2.32E-08).
Despite the fact that the total amount of heat from geothermal sources is thought to be relatively small, numerous studies have shown their impact to be significant. Carmack et al. [11] show that underwater geothermal heat can trigger thermobaric convection (TC), a ventilating mechanism that raises the thermocline, amplifying the transfer of heat from the ocean to the overlying atmosphere [12]. In Polar Regions, this can destroy the cold, mixed layer, exposing warm, saltier water
underneath within a short period of time. Geothermal heating of bottom water also increases the strength of oceanic overturning [13], and is responsible for increasing Pacific basin temperatures by 0.5°C three km below the surface [14].
By comparison, the correlation between CO2 and global temperatures (unlagged) for the study period is 0.739, a somewhat lower result. Furthermore, multiple regression indicates that CO 2 does not explain a significant percentage of the total variance (P > 0.1) when paired with HGFA MAG4/6 activity (P < 0.05). As a result, HGFA MAG4/6 is retained as a significant predictor while CO 2 is removed from the analysis (Table 2).
“A preliminary analysis of MAG4/6 seismic frequencies for the sampled HGFA was performed to see if these areas showed any changes before or during EN97/98. As Figure 4 illustrates, the HGFA experienced a 219% rise in MAG4/6 activity from 1994 to 1996. This surge in frequencies is statistically significant (P < 0.001) and mirrors the jump in global temperatures which commenced with EN97/98, but
Magnitude 4 to 6 earthquakes occur at the deep ocean ridges. So more sensitive equipment is not going to measure more 4 to 6 magnitude earthquakes.
New equipment will be able to measure smaller earthquakes, i.e. Earthquakes less than 4.
https://pubs.usgs.gov/fs/2011/3021/pdf/fs2011-3021.pdf
And Willis… why are do not comment about the geomagnetic field of the planet suddenly changing in 1994?
William, you are free to believe that for totally unknown reasons, in 1994-1996 there were suddenly three times the number of RECORDED earthquakes, and that purely by coincidence, the previous network (WWSSN) of RECORDING instruments was phased out and replaced by a new and more sensitive set of RECORDING instruments (GSN).
(Curiously, the reason for the change in instrumentation was only partially to do with earthquake detection. It was also driven by a desire to be able to detect small nuclear test explosions from a great distance, which is why the GSN was designed to be much more sensitive than the WWSSN … go figure)
In any case, me, I shave with Occam’s razor … so I’ll continue to think that the reason for the unprecedented jump in RECORDED quakes is the change in the RECORDING instrument network.
w.
Willis,
It does not matter what use to shave your face with.
I would sort of like an apology. Look at the data and the papers before making a comment.
Some people like to argue. That not science. Those people have an answer before they read the papers which they never will read because….
They have decide independent of observations what is or is not true.
You had an argument answer ready to go which what to dismiss the earthquake data..
With the silly comment about new earthquake equipment being installed which it was however that did not change the measurement because the author only used the magnitude 3.9 to 6 magnitude earthquakes….
Which occur at the ocean ridges where the ocean plate is being pushed apart and where there is magma bubbling up to make new ocean plate.
Because it has shown that the old equipment captured more than 90% of the greater than 3.9 magnitude earthquakes.
So instead you start another thread and analysis stuff that does not have anything to do with climate change.
This data on the other closely correlates with the warming and the cooling in the last 30 years.
Sarcastic comments are silly. For kids. You did not even look at the data, read the two papers I quoted, or think about how temperatures have changed in the last 11,000 years.
The problem is your brain has not learned the discipline/techniques to solve physical scientific problems.
Prejudice in science is weird.
Humans can become like Zombie robots who cannot even look at observations outside of their ‘comfort’ zone.
For example this graph which is taken from Richard Alley’s paper that explains how temperature has changed in the last 11,000 years on the Greenland Ice Sheet, what has found by analyzing the second core from the Greenland Ice sheet core.
Climate scientists do not know what caused the past warming and cooling which correlates with the rise and fall of civilizations.
The general public have never seen this graph because it does not support the AGW paradigm.
The past warming and cooling was not caused by CO2 changes.
http://www.climate4you.com/images/GISP2%20TemperatureSince10700%20BP%20with%20CO2%20from%20EPICA%20DomeC.gif
The earthquakes of magnitude 4 to 6 occur are only at the ridges which are all over the planet.
You comment made is sound that as if the author of the paper I quoted would not check the data.
He did and in his paper commented that his analysis (is only for earthquakes at ridges that are spreading and there is magma coming up to change the ocean temperature) does not look at the smaller 1 to 3 magnitude earthquakes because they were not measured prior to around 1994.
it is a fact (look at the graph) the mid-ocean ridges rate of spreading increases and decreases.
That in itself is not explained.
For example in 2014 there were 800 4 to 6 magnitude earthquakes, at the locations on the planet where the ocean plate is being pushed apart and there is magma coming up from the deep earth at those locations.
In 2017, the were 50% reduction in mid-ocean ridge earthquakes, 400 4 to 6 magnitude earthquakes
Observations can be studied to solve problems. You did not read what I wrote and you did not read the papers I quoted. You did not even look at the graph.
William Astley
April 7, 2021 11:00 am
Yes, and I would sort of like to be a 30-year-old billionaire relaxing in a hot tub with the Swedish Bikini Team … odds on either one are small.
I’ve made my position clear. In the 1994-1996 period, one seismographic network (WWSSN) was replaced by another newer and much more sensitive seismographic network (GSN). At the same time, the number of REPORTED earthquakes increased. To me, that’s expected.
If you want to believe that just by coincidence, suddenly and for unknown reasons global earthquakes increased fourfold during that time, I can’t stop you.
And I’m also not going to apologize for my recitation of FACTS about the seismographic networks.
w.
Willis,
You incorrect dismissal of physical phenomena is ….
Must be do to ignorance. Due you know anything about 67,000 km of mid-ocean spreading zones?
Where did you get your info to support a claim that the sudden increase in magnitude 4 to 6 earthquakes at mid-ocean ridges that are known to be spreading…. increased in 1994 to 1995 due a change in seismic measuring equipment?
Did you make that up?
Do you know that this is the location where the ocean plate is being pushed apart by some unknown force?
And as the frequency of mid-ocean earthquakes is directly proportional to the rate of spreading of the ocean plates when there are more earthquakes in these regions the mid-ocean plate is begin pushed more. This releases more magma from the deep earth.
“However, the majority of earth’s geothermal heat is released along the mid-ocean spreading zones [4,6], a 67,000 km tectonic complex for which we have very little data (Figure 1). The problem in accurately assessing heat flow from these high geothermal flux areas (HGFA) is that they are poorly sampled. Located in the middle of ocean basins at great depths, they are far removed from the predominantly land-based seismic network. According to Langmuir and Forsythe [7], we are still in the “very early stages of understanding” these extensive, complex tectonic systems.”
The author of the paper I quoted… Noted that only the frequency of magnitude 4 or large earthquakes at mid ocean ridges (this is the location where the ocean plates are being pushed apart. Magma comes up when the rate of spreading is high enough.
As the equipment that was used for the entire period has a 90% chance of detecting magnitude 3.9 or larger.
Obviously it is a physical fact that mid-ocean ridge rate of spreading is changing in real time. The frequency of earthquakes at the mid-ocean ridges correlates to spreading rate of the ocean plate that is being pushed apart.
“However, the majority of earth’s geothermal heat is released along the mid-ocean spreading zones [4,6], a 67,000 km tectonic complex for which we have very little data (Figure 1). The problem in accurately assessing heat flow from these high geothermal flux areas (HGFA) is that they are poorly sampled. Located in the middle of ocean basins at great depths, they are far removed from the predominantly land-based seismic network. According to Langmuir and Forsythe [7], we are still in the “very early stages of understanding” these extensive, complex tectonic systems.”

Complete nonsense.
Can’t we stop this eleven year cycle of the sun? Spray powdered chalk on it or something?
Total nonsense. There has been 19-20 La Ninas after 1960 and this model could predict about 5 of them. What is the point? Researchers have calculated significance that is very high. It is also produced by manipulating the data.
The last two sunspot minimums appear to have been associated with La Nina but nothing in climate science has to have the precision of say physics there are no laws in climate science. The sixties seemed to be Enso normal apart from one large El Nino but the seventies had many La Nina and El Nino events.
https://origin.cpc.ncep.noaa.gov/products/analysis_monitoring/ensostuff/ONI_v5.php
You can see the strong decrease in solar wind speed at low density since late March. Until the solar wind speed increases the current zonal circulation blockage (jet stream blockage) will continue.
Zonal circulation blocking forecast over the US for April 11, 2021 at 250 hPa.
Confirmed temperature anomalies for 07.04.2020 in Europe.
Sorry. 07.04.2021.
Looks like a great time for Europeans to take a vacation to southern Spain, unless they’re into skiing.
It needs to stay like that for a long time to knock some sense in the place.
Maybe the EU can come up with a tariff on imported cold temps.
In my understanding, the La Nina pump is an emergent phenomenon that is more common in warming times.
I believe you are right, however you will catch a lot of flak from the solar brigade for suggesting that the climate possesses active internal dynamics.
For the solar brigade, the climate needs to be entirely passive, with every change, oscillation and pattern forced externally from solar and astrophysical phenomena.
In the same way the CO2 brigade make exactly the same mistake in assuming that the climate is entirely passive, with every change, oscillation and pattern forced externally by CO2 and occasionally by a volcano or two.
Both are wrong. Climate has a powerful internal dynamic with emergent pattern over many time and spatial scales.
As Galileo would have put it: “Eppur si muove”. “Still – it does move!” By itself.
The Humboldt Current is a surface current and originates in the ice of the South Pacific. It is therefore dependent on the amount of solar energy in the south and the strength of the wind.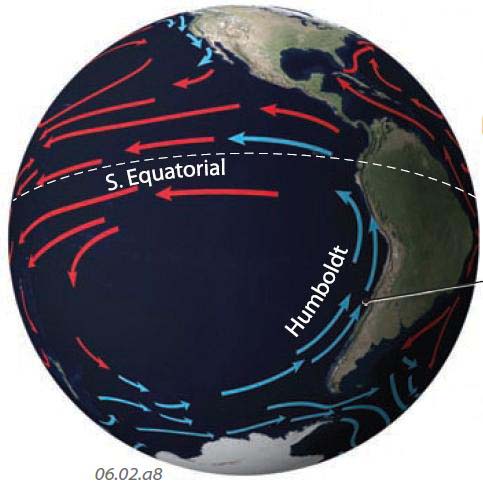
“The cold waters of a current (the West Wind Drift) flowing east from Australia turn north along the west coast of South America. During this long track across the southern Pacific, the waters turn cold and form a very pronounced cold current, called the Humboldt Current (also locally known as the Peru or Chile Current). As the Humboldt Current approaches the equator, it turns back to the west, toward Australia, to complete the circuit of this huge gyre. The west-flowing segment is the South Equatorial Current.”
https://geography.name/what-is-the-global-pattern-of-surface-currents/
ren
The Humboldt current’s importance is under-appreciated. It is the ultimate source of the Peruvian upwelling linked to ENSO. I suspect that variability in the Humboldt current is a factor in ENSO variability.
And BTW the Humboldt current is the coldest now that it has been over the whole Holocene:
https://agupubs.onlinelibrary.wiley.com/doi/full/10.1029/2018GL080634
Good explanation.
Thanks, Willis, was hoping you’d do some basic anaylses on this (I think you already did it earlier).
Willis: Although unrelated to Nino/Nina, the solar cycle is clearly aligned with climatic regime shifts and these line up with the vertical dotted lines in your Figure 3 above (Figure 4 from L2021). In 2009 Basil Copeland and Anthony Watts did an analysis involving a Hodrick-Prescott filter on the monthly HadCRUT anomaly data. Their data showed temperature regime shifts whenever the filtered data exceeded +/- 0.0025 and these shifts always lined up with the onset of the new solar cycle (the vertical dotted lines). I used the NOAA regime shift algorithm developed by Sergei Rodionov to identify the climate temperature shifts. They line up well with solar phenomena as documented here: http://appinsys.com/globalwarming/ClimateRegimeShift.htm
Sorry, but I couldn’t make the Excel VBA code work in Excel. Not sure why.
I did take a look at the break detection algorithm that I use (r package “strucchange”) and the HadCRUT 4 global data. What I found is that it’s sensitive to the minimum length of the allowable breaks. If that is at or just below the 11-year sunspot cycle, the breaks tend to line up with troughs in sunspot data. However, if the minimum is shorter than that or longer than that, the breaks are more randomly distributed WRT the sunspots.
I also note that in the algorithm you use, the minimum length is ten years … so I suspect you’re looking at an artifact based on the method.
w.
Perhaps it is an artifact of the regime analysis, but it is curious how it aligns with the Copeland/Watts analysis, as well as the Kp geomagnetic storms. http://appinsys.com/globalwarming/ClimateRegimeShift_files/image013.jpg
Willis,
I was curious if you found any positive observations or learnings from the study.
You say “For one of my next investigations, I’ll see what I find when I extend their results further back in time. … Oceanic Nino Index is virtually identical to the NINO34 index, which goes much further back, all the way to 1870.”
Don’t bother. Data coverage of the NINO34 index region was pretty low until at least 1950. I can’t recall which end is particularly low on data but I *think* it’s the western end, and that means inevitable uncertainty about what the average would be across the entire region.
Maybe, just maybe, the Troup SOI would be more accurate, although in Tahiti from about 1915 to 1935 the air pressure was recorded at a hospital rather than by official weather office instruments.