Guest “A funny thing happened on the way to the Anthropocene” by David Middleton
I’ve been studying a recent Holocene climate reconstruction (Kaufman, D., McKay, N., Routson, C. et al., 2020)… and I noticed a funny pattern…

- I chose the “composite plus scale” version because it was the funniest.
- I included a 100-yr average of HadCRUT4 and atmospheric CO2 from two Antarctic ice cores.
- The resolution of the reconstruction is ~100-140 years.
- The Law Dome ice core is high resolution, compatible with instrumental data.
- They claim that the EPICA Dome C ice core is high resolution, but it isn’t.
- I included the official Holocene subdivisions to show how the Anthropocene fits in.
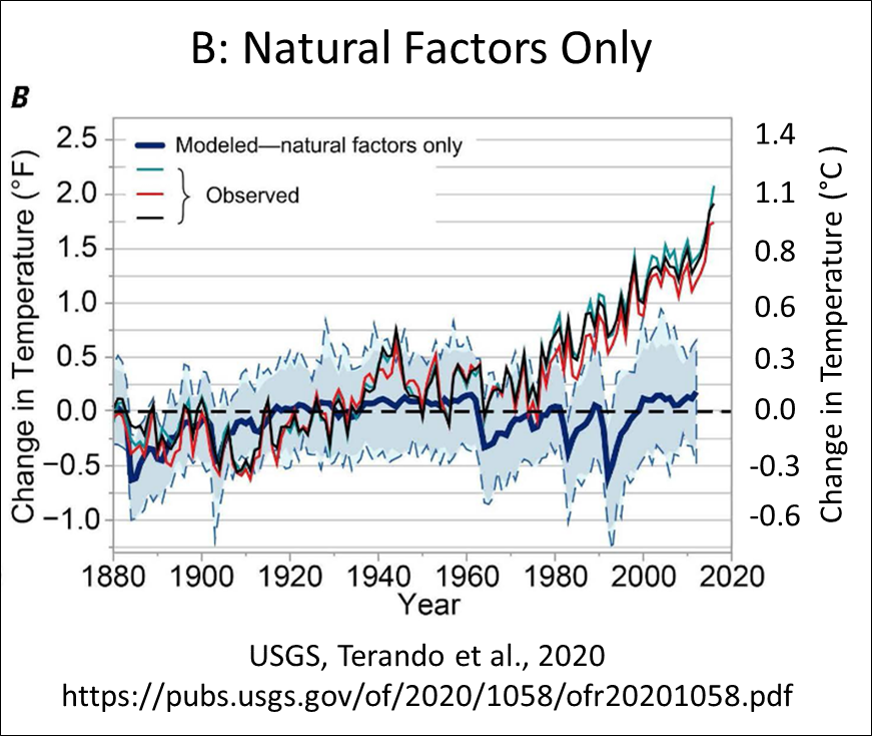
Another funny thing happened on the way to the Anthropocene… All of this was likely to have been natural:

Why do I say this was likely to have been all natural?
I thought about writing a long post about the paper and the concept of resolution… and maybe I will later.
The full text and data of Kaufman, D., McKay, N., Routson, C. et al., 2020 are available online. It’s actually very well done.
References
Kaufman, D., McKay, N., Routson, C. et al. Holocene global mean surface temperature, a multi-method reconstruction approach. Sci Data 7, 201 (2020). https://doi.org/10.1038/s41597-020-0530-7
MacFarling Meure, C., D. Etheridge, C. Trudinger, P. Steele, R. Langenfelds, T. van Ommen, A. Smith, and J. Elkins. 2006. “The Law Dome CO2, CH4 and N2O Ice Core Records Extended to 2000 years BP”. Geophysical Research Letters, Vol. 33, No. 14, L14810 10.1029/2006GL026152. LINK Data
Monnin, E., et al.. 2004. EPICA Dome C Ice Core High Resolution Holocene and Transition CO2 Data.
IGBP PAGES/World Data Center for Paleoclimatology. Data Contribution Series # 2004-055.
NOAA/NGDC Paleoclimatology Program, Boulder CO, USA.
Terando, A., Reidmiller, D., Hostetler, S.W., Littell, J.S., Beard, T.D., Jr., Weiskopf, S.R., Belnap, J., and Plumlee, G.S., 2020, Using information from global climate models to inform policymaking—The role of the U.S. Geological Survey: U.S. Geological Survey Open-File Report 2020–1058, 25 p.,
https://doi.org/10.3133/ofr20201058.
And the inspiration for the post’s title… (Warning: Apparently for mature audiences… which leaves me out)…
Good posting, David, and another Reality Check about Natural Variation. By the way, if the warning “for mature audiences only” was at the start of the video I would not have watched it. Sometimes I fear for your sanity.
Or your salinity
IMO, any study which uncritically echoes Pages 2K’s erasure of the historical MWP and RWP is not worth the electrons to email it. If they repeat that Mann/Jones/Marcott/Pages revisionist pap, without even mentioning that it is disputed, there’s no reason to trust anything else they say.
This is a portion of Kauffman’s”Fig. 3″:
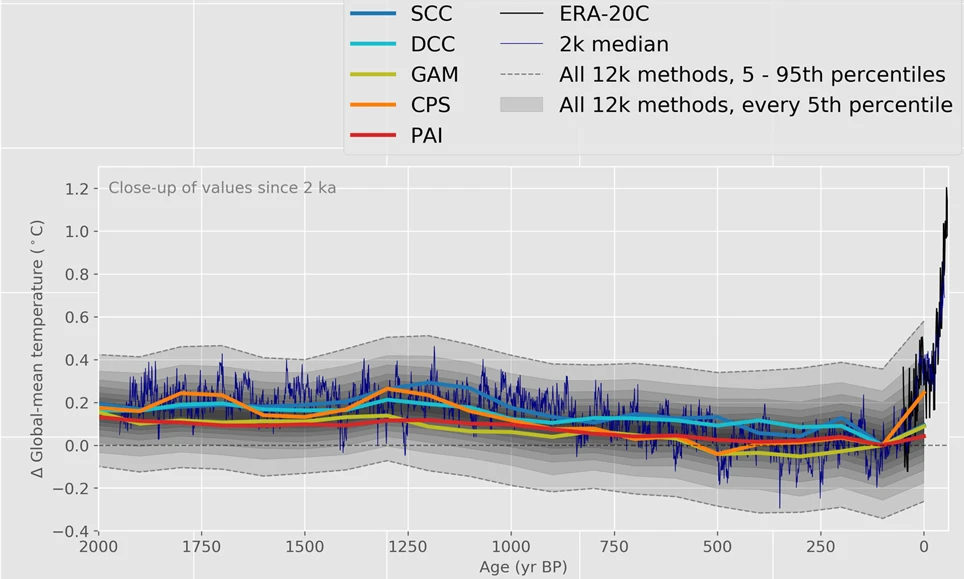
What’s missing in the CPS version?
(I didn’t just pick this one because it’s funny.)
Glacial stages and historical periods from:
Grosjean, Martin, Suter, Peter, Trachsel, Mathias & Wanner, Heinz. (2007). “Ice‐borne prehistoric finds in the Swiss Alps reflect Holocene glacier fluctuations”. Journal of Quaternary Science. 22. 203 – 207. 10.1002/jqs.1111.
David,
Good find – this paper is definitely worth a detailed read at some point. For now, gotta liked this reference:
‘Liu et al. (ref. 3) coined the term “Holocene temperature conundrum” to highlight the contradiction between the cooling indicated by proxy evidence versus the warming simulated by global climate models, a trend reinforced in the most recent generation of climate models.’
I don’t understand what you are trying to say. Even an extra cup of coffee did not help.
Yeah, I’m not following either. Except that the HadCrut4 and Pages 2k Ensemble mean are exactly the same. What are the odds of that?
I might add that a resolution of 100-140 years would miss many up/down short term warming periods.
Figure 1.
From ~9,000 to ~5,000 years ago, Earth was warming, while CO2 was falling.
From ~5,000 to ~600 yrs ago, Earth was cooling, while CO2 was
fallingrising.Most of the Holocene was much warmer than today.
Figure 1.
All of this climate change, including the “unprecedented warming from 1850-1950 was natural.
Added bonus from my comment.
This matches up very well with Holocene Neoglaciation.
Thanks. Got it.
“5,000 to ~600 yrs ago, Earth was cooling, while CO2 was falling.”
was rising is what I think you meant..
Using the graph, only about 8000 of the Holocene’s 11,400 years were warmer than now, but IMO that’s a lowball estimate.
It’s 7,900 more than the Mannian method would suggest… 😉
According to the paper itself:
“For 80% of the ensemble members, no 200-year interval during the past 12,000 years exceeded the warmth of the most recent decade. For the other 20% of the cases, which are primarily from the CPS reconstruction, at least one 200-year interval exceeded the recent decade. This comparison is conservative in context of temperatures projected for the rest of this century and beyond, which are very likely to exceed 1 °C above pre-industrial temperature. Such projections place the temperature of the last decade into a long-term context that is more comparable with the Holocene GMST reconstruction. Furthermore, if the reconstruction is influenced by a Northern Hemisphere summer bias (discussed below), then the peak warmth would be overestimated and the recent warming would therefore stand out even more in comparison.”
So what David has done is cherry picked the most extreme reconstruction (the CPS one) and cut off modern warming by applying a 100 year filter plus stopping at the year 2000.
I corrected the mistake in the paper… By filtering the instrumental data down to the resolution of the reconstruction.
CPS is the only method that actually reflects what is known about changes in Holocene glaciation and sea level… in addition to being the most fun method.
This is one of the most retarded sentences ever written by a “scientist”…
The reconstruction can’t resolve decadal changes.
The instrumental record can certainly resolve decadal changes.
The instrumental record didn’t exist 160 years ago, not to any relevant extent. You can’t compare thermometer readings with proxies. The error bars and resolution of the latter are WAY too large, and many don’t “measure” what they are purported to, like tree rings.
No schist Sherlock… The point is that the reconstruction can’t… It can barely resolve centennial changes.
You have to remember, David..
… Izzy-dumb lacks basic comprehension abilities.
As I understand the passage from the paper, the claim is not being made that the reconstruction can resolve decadal changes. The claim is being made that the decadal change resolved by the instrumental record is greater than any 200-year change in the reconstruction. Is that clearer for you?
That’s why it’s retarded.
A scientist claiming that the maximum amplitude in a short high frequency signal is greater than the maximum amplitude in a long low frequency signal is either retarded or a fraudster.
“The reconstruction can’t resolve decadal changes.”
I was going to reply with something similar. Heck, it can barely resolve centennial changes, as I mentioned in another comment. But Izaak wants to hang his hat on dubious proxies.
Jeff,
The paper quite clearly states that no 200 year period was warmer than the current decade in over 80% of the reconstructions. It does not make any statement about warm years or decades in the past. You can still try and argue that any current warmth is due to natural fluctuations and it is going to go away real soon now but that argument is becoming less and less plausible with each year of increasing temperatures.
The only thing more retarded than this sentence…
… is not being able to grasp why it is retarded.
The reconstruction can’t resolve decadal changes… It can barely resolve centennial changes.
Izaak,
The claim that each year shows “increasing temperatures”is implausible in itself.
We are talking temperature anomalies from a baseline.
If Gavin Schmidt is now stating that the margin of error for annual temperature anomaly comparison purposes for NASA GISS is 0.1 C (as I read in my local newspaper as he ‘pumps’ 2020 as the hottest year) and the difference between the hottest year 2016 (now ‘tied’ with 2020) and the second hottest year 2015 is 0.04C (NASA GISS) or 0.01C (HadCru4),the problem is obvious.
The so called “increasing temperatures” are well within the margins of error.
Lindzen,Happer, Koonin and Roy Spencer have been saying this for years.
It is not then possible to state definitively that 19 of the last 20 years,or similar, “have been the hottest on record” (meaning since 1880), as if that was compelling in any event.
The natural factors only figure looks like a response to Travesty Trenberth’s “we need a new baseline Null Hypothesis – flatten that sucker, or the children are all going to die”.
The paper’s OK, but, as I posted a week or so ago in response to an idiot troll’s buffoonery, they do have a pretty good Mike’s Nature Trick in there, covering up the green band with the Marcott buffoonery:
Mike’s Nature Tricks just ain’t what they used to be though.
Climate change causes Mike’s Nature Tricks to be not what they used to be.
Can we get this idiocy over with pleeeeeease? Sooooon?
That’s why I downloaded the reconstructions.
Leading UK daily going one more step up on sceptic scale, naughty but nice, don’t know about BoJo but the princess nut-nuts won’t like it as much.
Quotes:
The MWP was such a fly in the ointment in the case for man-made global warming that in 1995 one scientist at the IPCC – Jonathan Overpeck – wrote an email to a colleague claiming ‘we have to get rid of the Medieval Warm Period.’
In one particularly damning email, CRU director Phil Jones said he had used ‘Mike’s Nature trick’ to ‘hide the decline’ in temperatures in the second half of the 20th century. Just like Dr Mann’s ‘hockey stick’ graph he had cut off the tree-ring data just at the point where it stopped showing an upward trend and swapped in thermometer temperatures for recent decades, making them look much warmer.
“The 97 per cent figure is derived from two pieces of pseudoscience that would have embarrassed a homeopath,” said Viscount Ridley in his climate blog.
Article is behind a pay wall, but if interested I put .pdf copy on my website (will take down in 2-3 days time) http://www.vukcevic.co.uk/trueORfake.pdf
I’d give the article you attached a luke-warm “ok”. On the plus side, it does call out a couple of the worst instances of malfeasance and junk science, probably because they can no longer be covered up and have served their initial purpose of bringing alarmism into the public realm. Unfortunately, with respect to the models and data tampering, the alarmist thumb is still heavily weighing on the scale. For example, Mann is somewhat criticized for the Hockey Stick shenanagins, but only paragraphs later he is given full authority to opine on AGW.
Paper is very influential within the current UK’s Conservative parliamentary majority, hopefully it is a one small step forward. Those kind of comments are actually banned from BBC and the Sky news channel is just as bad (The Daily Climate Show: Sky News launches prime time programme dedicated to global crisisThe head of Sky News says “there has never been a more urgent need to report accurately on the climate crisis”.). It is almost impossible to hear any kind of the ‘global warming’ scepticism in the UK’s mainstream media.
True , us beggars can’t be choosers. Btw, who’s this Piers Forster character?
– Gravity causes objects to fall +
– CO2 absorbs in the infra red =
– Global warming is man-made
Thanks Vuk.
… and there we have it yet again:
“The overwhelming scientific evidence leads to the conclusion that humans are the dominant cause of the recent warming”
The overwhelming scientific evidence quote that has never, ever, in the history of mankind, ever been followed by any scientific evidence.
Dr Willie Soon is ‘persona non grata’ on the BBC, but at least he got a quote.
Those big dips in the “natural” curve are from volcanic eruptions and resultant aerosols. So, (and this is heresy) what if the effect of the eruptions was actually trivial ? You move the “natural” line upwards at each eruption point….and end up with a curve that matches the “measured” curve.
I think they’re more likely to be trivial.
Here’s my question: if CO2 is such a threat, and a very gassy baby volcano finally (after some 600 or more years) has come online in Iceland, emitting a lot of noxious gases where it is sitting on the rift zone up there, and Etna’s been going off constantly for nearly 2 years now, and a Japanese volcano is threatening to blow its stack, not to mention the 30+ other active volcanoes around the word, why are Hoomans being blamed for something we can’t control when it’s the planet that does it?
All right, that’s a long, long question, but I think it deserves an answer. If that new Icelandic volcano has a history that corresponds roughly (6,000 years ago) to the Fig. 2 chart at -4000BC years, isn’t there a correspondence there?
The ecohippies can go sit on their self-imposed guilt trips if they want to. They nothing better to do that cause trouble for everyone else, like a bunch of spoiled brats. If they’re really so concerned, why aren’t they cleaning up after themselves? They never do.
Volcanoes don’t actually emit that much over human-scale time periods. And every time I’ve tried to confirm this: “While it has been proposed that intense volcanic release of carbon dioxide in the deep geologic past did cause global warming, and possibly some mass extinctions”… I haven’t been able to find convincing evidence.
https://www.usgs.gov/natural-hazards/volcano-hazards/volcanoes-can-affect-climate
The Lake Nyos disaster was caused by high CO2 concentration seepage, and there are other volcanic sources that also involve CO2 release. I strongly suspect that the USGS estimates are off by an order of magnitude. They’re just not looking where they’ll find the “wrong” numbers. How many volcanoes have been sampled, as a percentage of the world total?
The disaster was due to temperature inversions in those particular types of lakes. The temperature inversions lead to the water overturning periodically, bringing a lot of CO2 to the surface all at once.
USGS acknowledges that there’s a lot of uncertainty in the volcano data.
The geological example I have focused on is the Middle Miocene Climatic Optimum and the eruptions of the Columbia River Basalt Group. The volcano-CO2 connection is unsupported by the data.
https://wattsupwiththat.com/2019/06/03/miocene-volcanism-carbon-dioxide-and-climate/
No issues for me with your response, David Middleton.
I was in Chicago when both Pinatubo and Mt. St. Helens erupted. And Pinatubo’s outburst, which was a lot of ash as well as a high volume of gases, did drop the mean global temperature by at least one degree. Mt. St. Helens, on the other hand, while also very explosive and full of particulates, didn’t do the same thing. And both of those critters 🙂 are showing signs of potential activity again. Etna has been going off for nearly two years now.
I’ve been watching this new Icelandic volcano growing day by day since it started about 5 days ago. It sits on the North Atlantic rift and is increasing its volume of lava constantly. The gases it is producing are also increasing in volume.
I think I’m less concerned about the gas content than the gas volume itself, because this new baby volcano (Farfand-something) has a growing volume of gasses of all sorts, as well as the steady increase in lava volume and the size of the volcano itself. When I was in high school, Surtsey got a lot of news for Iceland because it literally rose out of the sea, just like Paricutin growing in some farmer’s cornfield. The gases that are the most damaging aren’t CO2, but methane and sulfur dioxides and CO and hydrogen sulfide, among other things. Water vapor is a BIG part of it, too.
It may come to nothing, but a volcano (or a bunch of them) doesn’t have to be spectacular to make major changes in our environment. I’m interested in finding out where all of this is going.
Thanks for your feedback.
OH, almost forgot: P.S. Do volcanoes emit more CO2 than Hoomans? I agree with you: no, they don’t. You’re very right. There is, however a high volume of water vapor in those eruptions.
Volcanic activity may have been the source of Earth’s water… But, like volcanic CO2, it accumulated over 100’s of millions of years.
Volcanoes definitely cause transient episodes of cooling, mostly due to sulfate aerosols.
“I was in Chicago when both Pinatubo and Mt. St. Helens erupted. And Pinatubo’s outburst, which was a lot of ash as well as a high volume of gases, did drop the mean global temperature by at least one degree.”
I’m not convinced that Pinatubo had any global effects, besides TV coverage.
There was a transient tropospheric cooling effect… Most notable in stratospheric warming.
Sorry, but the old “estimates” comparison with “measurements” (even if somewhat indirect) doesn’t impress me. The volcanic emissions aren’t being measured, which means they don’t know how much CO2 is emitted from volcanic activity.
Stephen Sondheim just turned 91.
Everybody wants to be Sondheim…
https://youtu.be/neeJrIqlQNI
And yet so few actually achieved that goal. Say what you will about his history of composition, he has to be ranked up there with his predecessors, to include his mentor the inimitable (I take that back, Sondheim did imitate him), great Oscar the Hammerstone, whose dad was a German Jew and mom a Gentile born in Britain.
Broadway musicals are a distinctively American art form, never was just for homosexual fans of show tunes. Sondheim married his long time male roommmate in 2017, but he’s in the long line of composers and lyricists stretching back to Tin Pan Alley and the turn of the 19th to 20th century.
The comic genius Zero Mostel, while a Communist, was decidedly of the heterosexual persuasion.
The brilliant “The Producers” perhaps owes more to Mel Brooks’ production than Mostel’s performance, but would have been greatly diminished without Mostel in the lead.
The pretzel bra and headdress, pure Mel Brooks:
David,
The PAGES work was heavily criticised, to the point of irrelevance, when first released. See Steve McIntyre on Climate Audit. The Australian authors have not yet answered the question of why there is not a single example from mainland Australia in their work. Too inconvenient?
Start here and follow a dozen more PAGES 2K posts at CA.
https://climateaudit.org/2014/11/07/gergis-and-the-pages2k-regional-average/
Also, what happened to van Wijngaarden and Happer (June 2020) reporting that the combined effect of CO2 and water vapour was essentially saturated in its ability to generate more heat at higher concentrations? Who cares what historic levels of these gases was if they did not very much to climate?
https://arxiv.org/abs/2006.03098
Lastly, you are showing global temperature changes in the range of +/- 1 deg C over thousands of years. Realistically, do you think that proxy menthods have a hope in hell of measuring to this accuracy? I do not.
I prefer fact to fiction in my recreational reading. Geoff S
If you plot all of the ensemble members for all five methods, you will see that there is a YUG margin of error… But, it looks like a spaghetti monster. Even if I plot all 500 ensemble members of CPS, it looks like a spaghetti monster.
The methodology they describe in the paper is reasonable… and a LOT better than Marcott.
True. CACA was born falsified, thanks to predictions of Arrhenius and Calendar, c. 1900 and 1938, shown false by the frigid 1945-77 interval of oceanic oscillations. Now its claims are literally laughable, as david so graphically shows.
Dave ==> In your Fig. 1 both traces suffer, as I’m sure you know, from what I call “programmatic scaling” in which the scale is determined to be (by the programmers of graph producing programs — or,maybe in this case, by you) to be 120% of the range of the data being graphed. Thus both the blue trace– temperature anomaly (sic) — and the CO2 concentration are grossly misrepresented in relation to one another.
The temperature change from the last Ice Age to the Present is BIG and important.
The change in atmospheric CO2 — from 0.027% to 0.04% — is very very small and insignificant — yet, by scaling, appears huge.
I think we should offer the Climate Warriors a huge increase in salary and funding by the same amount each year –> 0.013% It’s huge, isn’t it?
Kip,
What is the appropriate scale? If you convert temperatures to Kelvin then roughly a 30% increase of CO2 corresponds to a 0.3% increase in temperature (i.e. one degree out of roughly 300). This suggest that a large change in CO2 is needed to produce a noticeable change in temperatures. Would that make you happy?
Izaak ==> Scales on graphs are a very tricky business. It is four times more tricky when you have two metrics to display together, implying a relationship. The proper scales for each is subjective and the comparative scales are subjective.
When both metrics are displayed at the programmatically determined “120% of range over time” one suspects that thinking was not involved.
The choice of scale, and whether to include zero, can act as a filter to remove ‘noise.’ However, in most cases, it is probably best to choose a scale and range that retains what is thought to be noise, albeit suppressed. On the other hand, using a scale and range that is so sensitive that the graph transits a major portion of the available white space, for changes that are at the limit of precision of the measuring device, is the behavior of an experimentalist that has an agenda. Strictly speaking, a scale that allows resolution of the last significant figure is justified; showing a resolution beyond the precision of the last significant figure is trying to convince readers that more is known about the data than is true. That is inherently one of the problems with so-called temperature anomalies. The available white space is most of the graph, and it looks like the variance in the ‘anomaly’ is of greater import than what it is.
Clyde ==> So much is subjective and depends on what the author wants the data to say.
The primary purpose in scaling is to demonstrate context…
Your arguments are backside up. The major change took place about 1 million years BP (viz Camp Century and Vostok 3 ages respectively). Since then major regular sea level rises and falls accompanied by glacial advances & retreats) have not interfered with the accumulation of ‘permanent’ ice at both Greenland and Antarctica. This simple fact is overlooked by almost all involved in this area of science.
Simply put it is impossible to drill such long sections over several years unless the core hole is sited over absolutely stable ground or in this case ice. Otherwise, the drill string would be simply sheared off.
So where did the water go after each sea level retreat?
It was locked up in continental ice sheets.
It seems many papers see both the Hallstatt/ Bray – and Eddy cycles coning to a maximum…..ehhhh….
just about now and the coming decades….
Aren’t we lucky?
https://breadonthewater.co.za/2021/03/04/the-1000-year-eddy-cycle/