By Christopher Monckton of Brenchley
The New Pause continues. To the end of December 2020, it was 5 years 4 months. To the end of January 2021, it was 5 years 6 months. To the end of February 2021, it is 5 years 7 months:

Up to December 2020, for which I have data for two satellite and two terrestrial datasets, UAH and RSS showed the shortest Pause, while HadCRUT4 shows the longest, at 6 years 6 months:


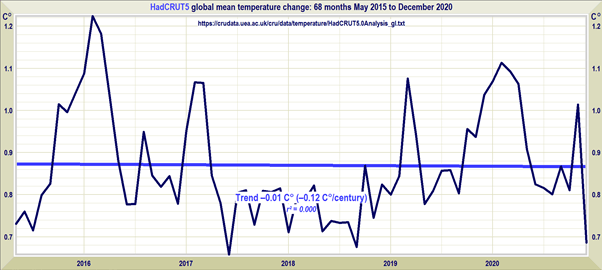

The difference between the lengths of the New Pause in versions 4 (6 years 6 months) and 5 (5 years 8 months) of the HadCRUT dataset to December 2020 is a whopping 10 months, which the newer version wipes off the New Pause. As Willis Eschenbach has recently pointed out, the tamperings between versions 4 and 5 chiefly affect recent years: for once, the earlier years of the HadCRUT dataset have been left comparatively unadjusted. Could it possibly be that the emergence of this new Pause is giving the usual suspects – er – pause for thought?
The two satellite datasets, UAH (trustworthy) and RSS (run by a “scientist” who resorts to hate speech, calling those of us whose research suggests small and harmless global warming “climate deniers”), continue to show very different warming trends. From 1979-2020, RSS, at 2.16 C°/century equivalent, shows 58% more warming than UAH. Settled? Schmettled.
Charts are below. For interest, I have also added the chart of the Central England Temperature Record from 1979-2020, which, being a regional record, shows how trivial the trend is when set against the annual winter-to-summer temperature cycle. It shows warming equivalent to almost 3 C°/century, but that is a regional and not a global mean, and the discrepancy between the regional and the global average is not entirely unexpected given poleward advection. The CETR showed warming at 4.33 C°/century equivalent over the 40 years 1694-1733, and has not shown warming at or above that rate in any 40-year period since then, so there is nothing unprecedented about the recent warming rate.
I’m taking bets on which of the various datasets will be the next to produce sophisticated excuses for the next tamper-tantrum, resulting in yet another hike in the apparent warming rate.


Finally, now that we have HadCRUT5, I have taken uncertainty intervals for each of the five mainstream climatological parameters (green) and added them to the table that shows how equilibrium doubled-CO2 sensitivity (ECS) is derived from them:

The current generation of models predicts ECS on 3.7 [2.0, 5.7] K. In reality, based on real-world observation rather than artfully profitable speculation, ECS will fall on 1.0 [0.8,1.4] K. And that is far too little to require any mitigation whatsoever. Cancel COP26! Shutter IPCC! Climatology’s predictions are about four times reality.
But can it really be as simple as this to derive ECS? Don’t we need complex models costing billions? Don’t we need multi-thousand-page IPCC reports every few years? Well, no, we don’t. The equations for the energy-imbalance factor Γ, for the implicit anthropogenic equilibrium sensitivity ΔE1 in the industrial era from 1850-2020 and then for ECS ΔE2, though very simple, are a reasonable and robust method of deriving ECS reliably from Their own recent, mainstream data, updated in a series of papers intended to be in time for IPCC’s Sixth Assessment Report.
The last line of the table is particularly interesting. It derives the unit feedback response –the response per degree of direct warming – from 1850-2020 (U1). Then it compares U1 with the feedback response U2 from 2020 to warming driven by a forcing equivalent to doubled CO2 compared with 2020.
U1, which at midrange is actually negative, at –0.06, indicating very slightly net-negative feedback in the industrial era, and not the grossly net-positive feedback imagined in the models, is 1 less than the industrial-era system-gain factor A1, the ratio of period equilibrium sensitivity ΔE1 to period reference sensitivity ΔR1, where ΔR1 is 0.3 times the period anthropogenic forcing ΔQ1.
There is little more than 2 degrees’ difference between temperatures in 1850 and at doubled CO2 compared with 2020. Therefore, U2, the post-2020 unit feedback response implicit in the model-projected ECS, ought to be about the same as U1.
At most, the ratio X = U2 / |U1| of the two unit feedback responses ought not to exceed about 1.1. But the interval of unit-feedback-response ratios X implicit in the models’ global warming predictions is an astonishing and manifestly untenable 39 [14, 69].
Just for fun, we calculated what X would be if the sillier and more extreme papers predicting 10 degrees’ ECS were true. Then X would exceed 130: that is, X would exceed any reasonable value by two orders of magnitude.
Couldn’t climatologists have done these simple sums for themselves and realized how grievously overblown their profitable but damaging predictions were? Why did they ever imagine that ECS would be anything like 3 or 4 degrees at midrange, when in reality it will be a harmless and beneficial 1 degree (and only that much on the generous assumption that the official estimates of greenhouse-gas forcings are not overstated)?
The reason is that they imagined that the 32-degree natural greenhouse effect comprised only two components: 8 degrees’ reference sensitivity to preindustrial noncondensing greenhouse gases and 24 degrees’ feedback response thereto (see e.g. Lacis et al., 2010). On that basis, they thought that 1 degree of doubled-CO2 reference sensitivity would become about 4 degrees’ ECS – and the current models’ midrange prediction is indeed close to 4 degrees.
They had forgotten that much of the 24 degrees’ total preindustrial feedback response was a response not to the preindustrial noncondensing greenhouse gases but to the 25-times-greater emission temperature that would prevail near the surface even if there were no greenhouse gases in the air at the outset. The larger the feedback response to the warmth from the Sun, the smaller the feedback response to the greenhouse gases.
Bless their little cotton socks, they had forgotten the Sun was shining. That strikingly elementary error is why the world is in a childish panic about global warming.
Great posting of another analysis, Lord Monckton. However, you should start sleeping with one open as San Fran Pelosi has just passed HR-1 in the US House of Representatives, and she states that “HR-1 will eliminate misinformation about climate change”, and I’m guessing she isn’t talking about science as we know it. This ridiculous bill now goes to the Senate, where it might encounter resistance sufficient to stop it. Or not. Stay tuned.
The FMP will enforce it (Federal Mind Police).
A new Federal Agency – DISS-MISS – is devoted to rooting out and eliminating all mis-information and dis-information…..maybe Nine Year Kerry will become its first head. Joey Biden has used the new N word – Neanderthal – to describe the miscreants who miss and diss.
What would be HR-1, pls? Could you help, pls, with some more informations concerning HR-1?
https://justthenews.com/politics-policy/elections/house-representatives-has-passes-controversial-hr-1-legislation
https://www.breitbart.com/politics/2021/03/04/37-things-to-know-about-h-r-1-for-the-people-act/
If this bill passes, free and fair elections will be a thing of the past.
Unfortunately, they pretty much already are.
That would be the goal. Dems have already proven that strategically placed operations can swing an election. This codifies those methods.
https://wittman.house.gov/news/documentsingle.aspx?DocumentID=3524
In keeping – if it mentions “for the people” it ain’t
How do we know if Nancy is lying? Are her lips moving?
I can find no reference to that quote from Pelosi. I am curious to read what she said exactly. Could you please provide?
Reacher51, I agree in that I could find no linkage of the claim ““HR-1 will eliminate misinformation about climate change”, attributed to Nancy Pelosi by Ron Long in his post above, in connection with HR-1, which is focused on US election processes.
Pending further clarification, Mr. Long’s claim itself appears to be misinformation.
I saw it reported that way on Fox News.
It’s in the bill. Nancy Pelosi may or may not have made a public statement about it.
I read it on Breitbart.com.
Pelosi did mention “confronting the climate crisis” in her speech on HR-1 in a section that lists political causes that she believes passage of HR-1 will aid.
https://pelosi.house.gov/news/press-releases/pelosi-floor-speech-advocating-for-hr-1-the-for-the-people-act
There is a section in the bill that makes it illegal to give out false information about elections, with the Democrats determining what is false and what isn’t, of course.
Perhaps that is the source of the confusion.
Anyway, once the Democrats have full control of the government, bills to outlaw saying anything a progressive disagrees with will soon follow.
“once the Democrats have full control of the government, bills to outlaw saying anything a progressive disagrees with will soon follow.”
I think that’s right. A lot will depend on a few Democrats in both the House and the Senate who have conservative constituents that they can’t alienate too much.
The Democrat Senator from Arizona stopped the $15 an hour pay increase by voting no. Senator Machin says he will not vote to stack the Supreme Court, so he may not vote to impose censorship on the Right, either.
There are a lot of vulnerable Democrats in the House elected from conservative districts and they are going to have to pay attention to what their people want and the pressure on the representatives will increase as the 2022 elections get closer.
We are close to a one-party, authoritarian government, but it’s not a done deal yet. Keep fighting back. We still have legal ways out of this mess.
Ron Long
” Great posting of another analysis… ”
Really?
It is absolutely evident that, when a period in a time series starts with or near to the period’s highest value, the linear estimate for the period automatically becomes way lower than if the period starts behind that highest value.
For UAH 6.0 LT
Aug 2015 – Feb 2021: -0.01 ± 0.12 °C / decade
Now the estimate for the period beginning 12 months later
Aug 2016 – Feb 2021: +0.24 ± 0.16 °C / decade
Moreover, the linear estimate for the first period ingeniously chosen above has no meaning at all: the standard error is way higher than the estimate itself.
In my native tongue, such behavior is named ‘miroir aux alouettes‘, i.e. a mare’s nest.
J.-P. D.
The belhop STILL hasn’t figured out that the period WAS NOT CHOSEN by LCM
It was chosen by the maths.
WHY do you continue to highlight your total lack of comprehension ?
Are you REALLY that dumb ?
Exactly ! I don’t think one should read too much into a 5-year negative trend. Such trends have happened several times within the overall dataset, and we just happen to be in another one now.
If you calculate the 60-month trend for each of the 448 overlapping such periods in the dataset, you find 189 of them have a negative trend, and 259 have a positive trend. The months with a negative trend occur in 6 groups each a year or two long, as you might expect from glancing at the graph.
There’s no reason to expect that the current negative trend, calculated on this basis, will last any longer than another few months
OK, it’s easy enough to run this issue to ground.
One can review and even download the full text of H.R.-1 For the People Act of 2021 at this URL: https://www.congress.gov/bill/117th-congress/house-bill/1/text
I did this and then did a simple computer search for the word “climate” (both directly on the website’s text and also on the 791-page downloaded PDF copy) . . . guess what, not a single “hit” for this word appearing anywhere in the bill’s text in either case.
I invite everyone else to do this to see where, in fact, the truth lays.
Nancy Pelosi may have interpreted the text of the bill as giving her the right to do anything she wants, such as censoring people discussing “climate change” (whatever that actually means to various people), and saying such publicly, but such IS NOT IN THE BILL.
And if we get the expected drop next month, the back-calculated pause will lengthen considerably.
How cold do expect March to be?
If it’s 0°C the pause will start in June. If it’s -0.1°C it will start in May.
If it’s -0.67°C (the coldest ever anomaly) the pause will start in March 2015, making the pause 6 years and 1 month old.
The bellhop has lost his room keys again !
Sorry what bit did you disagree with?
You have shown you are clueless how the trend is calculated.
Period.
Your comments are pointless.
If you have more of a clue about how the trend is calculated, lets hear your predictions.
If you like we could both draw up a list of what anomalies for March will trigger what change in the start date.
Here is a handy look up table to guess where the pause will be starting after the March UAH update
There may be some minor differences around the edges, depending on rounding errors and minor changes to earlier UAH data
I also expect a large drop next month to match the drop in the SSTs which usually foreshadow the UAH move 3 months later. SSTs had a big drop in December 2020. I would guess it will drop to around zero using the current baseline.
The bigger question is how long will this La Nina run. If it goes for another year then the pause will start stretching back to 2012 making it a full decade.
I think you would need temperatures similar to 2008 for that to happen within a year. But so far 2021 has been almost half a degree warmer than 2008.
Not where I live
Thanks to 1,200 kilometer smudged temperature infilling or replacing Polar and low population density areas.
We’re talking about UAH here.
Yearly anomalies for UAH 6.0 LT
J.-P. D.
Anomalies above wrt the mean of 1981-2010; but the difference of course is the same as when based on 1991-2020.
I was just going by the first two months of the year – trying to get a sense of what’s likely to happen over the next 12 months.
Only needs to drop by 0.2C and it will be the same level as the long pause from 2001 – 2015
Loosing keys and going to the wrong room..
How do you make a living as a bellhop ?
You really don’t understand how linear regression works, do you? Maybe stick to your comedy routine.
Poor bellhop, didn’t understand what I wrote.
Has the comprehension of an empty sock.
Probably, most of your comments seem like gibberish to me. So could you explain to a simple peasant like me exactly what you meant.
When you said “Only needs to drop by 0.2C and it will be the same level as the long pause from 2001 – 2015” I assumed you where talking about the trend, just as Monckton is. If that wasn’t your point, what was?
I agree, this month’s data will likely show a sharp decline and atmospheric effects from this La Lina are already expected to last until June.
It’s a long ways out, but a number of models are already predicting a La Nina to start forming again by the end of this summer. The tradewinds are still blowing quite strong.
Japan’s Met Agency publishes the surface time series with the lowest trends.
For 1979-2020: 0.14, i.e. the same as UAH 6.0 LT.
A good reason to trust in their ENSO evaluations:
http://ds.data.jma.go.jp/tcc/tcc/products/elnino/elmonout.html#fig2
J.-P. D.
“Couldn’t climatologists have done these simple sums for themselves and realized how grievously overblown their profitable but damaging predictions were? Why did they ever imagine that ECS would be anything like 3 or 4 degrees at midrange, when in reality it will be a harmless and beneficial 1 degree (and only that much on the generous assumption that the official estimates of greenhouse-gas forcings are not overstated)?”
– Christopher Monckton of Brenchley
In the many decades that I have been involved in the “global warming” / “climate change”/ “wilder weather”/ “we’re all gonna die from false fabricated climate BS” / debate, I’ve watched rationally calculated ECS decline from almost an order of magnitude, from almost 10C to about 1C/(2xCO2).
My own calculations of ECS range from Plus1C/doubling to Minus1C/doubling, based on the ASSUMPTION that increasing atmospheric CO2 drives temperature, which is probably FALSE – unless the future can cause the past, which is extremely improbable in our current space-time continuum. I suggest that ECS, at best, should be treated as an “Imaginary Number”. 🙂
The following post is from 2013.
https://wattsupwiththat.com/2013/09/19/uh-oh-its-models-all-the-way-down/#comment-1108144
[To spare our hardworking moderators more work, I’ve deleted links – see the original post for links.]
[excerpt]
One could also say “an infinitude of worthless climate models”, programmed by “an infinitude of dyslexic climate modellers”, yielding “an infinitude of exaggerated global warming predictions” (er, sorry, “projections”).
John said above:
David Appell had the first comment on Judith’s blog entry, which is entitled “Consensus Denialism.” Here is what he said about Judith:
“The distressing thing is how some people are all ready to attack models, instead of helping make them better.”
OK David, here are some helpful suggested steps to make the climate models better:
1. Adjust the Surface Temperature (ST) database downward by about 0.05 to 0.07C per decade, back to about 1940, to correct for a probable strong warming bias in the ST data.
2. Decrease the ECS (sensitivity) to about 1/10 of its current level, to between 0.0 and 0.5C. If ECS exists, it is much smaller than current estimates.
3. Eliminate the fabricated aerosol data to enable the false high ECS values used in the climate models. The aerosol data was always provably false (Google “DV Hoyt” ClimateAudit).
4. Include a strong natural cyclical variation based on either the PDO (~60 years) or the Gleissberg Cycle (~90 years) – see which one fits the ST data best.
Other than that, the models are great! Actually no, not so great – the models have probably “put the cart before the horse” – we know that the only clear signal in the data is that CO2 LAGS temperature (in time) at all measured time scales, from a lag of about 9 months in the modern database to about 800 years in the ice core records – so the concept of “climate sensitivity to CO2” (ECS) may be incorrect, and the reality may be “CO2 sensitivity to temperature”. See work by me and Murry Salby.
BTW, this does not preclude the possibility that increases in atmospheric CO2 over the past ~century are primarily due to human combustion of fossil fuels, but there are other plausible causes – (Google “mass balance argument” Engelbeen and Courtney).
So good luck with those models David =- hope this helps to make them better. 🙂
Regards to all, Allan
Typo: “In reality, based on real-world observation rather than artfully profitable speculation, ECS will fall on 1.0 [0.8, 5.4] K.” Should be [0.8,1.4] K
Mods, please fix
Fixed.
Thank you!
Pause for a moment and digest the news that the AMO does not exist. – really!
Apparent Atlantic warming cycle likely an artifact of climate
M.E. Mann el al., “Multidecadal climate oscillations during the past millennium driven by volcanic forcing,” Science (2021). https://science.sciencemag.org/cgi/doi/10.1126/science.abc5810
Model magic!
What’s his excuse is for eliminating the Holocene Climate Optimum?
It got in the way of his hockey stick.
Why is anyone with an IQ above room temperature (deg-C or deg-F, it doesn’t matter) still reading—let alone, quoting—anything written by Michael Mann?
My search for “GISTEMP” in the article comes up 0/0 and our good friends in the so-called popular press usually quote GISTEMP data and GISTEMP’s Land Ocean Temperature Index (LOTI) shows that the new pause goes back to November 2018.
Source:
https://data.giss.nasa.gov/gistemp/tabledata_v4/GLB.Ts+dSST.txt
But that is a pause of 2.16 years years and counting. In a few days GISTEMP will come out with LOTI to include data from February 2021 and probably the expected 300 or so changes to the monthly entries all the way back to January 1880. So who knows?
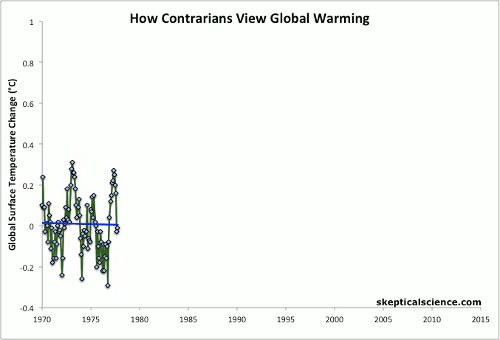
However should this new pause actually get some press, the folks at Skeptical Science are sure to dust off their “Escalator”:
For GISTEMP (LOTI) the “trend” for the monthly anomaly data from June 2015 to January 2021 is +0.01°C/decade.
From July 2015 to January 2021 it is -0.02°C/decade.
The “new pause”, i.e. the longest zero (or very slightly negative) trend up to the latest datapoint period, for GISTEMP (LOTI) therefore “goes back to” July 2015, not November 2018.
You’re right, I didn’t look back far enough. Duh!
It’s 5.33 years.
In other words to the 2015 el Nino. I recall at that time scientists joking that the inevitable fall in global temperatures, which always follow el Ninos, would encourage skepticks to start another ‘no cooling since…’ crusade. Well, I thought they were joking, but here we are again, right on cue.
It looks like the escalator might be somewhat valid. It could be that the global temperature does change in a step wise function, pause-step-pause-step-pause-step and so forth.
Note that the last couple of steps are quite a bit smaller than the previous ones shown in the animation. Note also that the most recent step looks about half the size of the one before and that one is similarly smaller than its predecessor.
My wild ass guess is that the next step on the escalator will be downward.
Likely tied to ENSO.
And SkSc makes three steps out of the last rather longish pausish series.
An “escalator”-like function in GLAT driven by a continuous and smooth exponential increase in global lower atmospheric CO2 concentration as measured at the Mauna Loa Observatory?
Rrrrright . . . got it.
“My wild ass guess is that the next step on the escalator will be downward.”
So much wishful thinking. You can blame Monkers for this, his now monthly (god forbid) pause update is quintissential disinformation. How many times does he need to have his cherrypicking, “no warming” arse debunked before he dies of shame?
There are no steps and there is no pause. If they were a thing you’d see it in the ocean data where 93% of the warming has occurred.
So many pauses, so many steps. 2.3% lol.
If we accept that most of the heat goes to the ocean, we also have to accept that most of the CO2 is in the ocean.
If the ocean is getting warmer, that means it can hold less CO2. The amount of CO2 in the atmosphere is determined by Henry’s Law not vice versa.
It is a reasonable hypothesis that the increase of atmospheric CO2 since the end of the Little Ice Age is explained by the warming of the oceans and that human CO2 emissions are tiny and ineffectual given the vast reservoir of CO2 in the oceans.
The ocean is a net CO2 sink and has been since humans started raising the atmospheric concentration. The CO2 concentration in the ocean is increasing, not decreasing.
Got a link?
From here: https://www.epa.gov/climate-indicators/climate-change-indicators-ocean-acidity
The human contribution of CO2 into the atmosphere was only 3.6ppm from 1980 to 2019. That miniscule amount did not influence anything.
Nonsense, you made that up. From 1980 until now CO2 concentration has risen from about 340ppm to 420, a rise of about 624Gt. Humans emissions over the same period are double that, forcing the ocean to behave as a net sink.
“Monkers”
You can tell when a skeptic is over the alarmist target when the alarmists start butchering the name of their antagonist.
Clearly people are continually over Fred’s target then by the level of name calling he resorts to..
Loydo,
You have obviously made the sophomoric mistake of confusing energy content with sensible temperature.
The above article discusses and presents graphs and ECS values that all cite sensible temperature (not ENERGY), and yet you reply to it with discussions of ocean energy content (not TEMPERATURE) with your single chart having its vertical axis in zettajoules.
“Warming” is an indication of positive temperature change, not necessarily a change in energy content . . . for example, ice changing to liquid water is a large increase in internal energy per kilogram, but occurs at constant temperature at a given pressure.
Physics 101.
You think that refutes the inconsequence of statistically insignificant atmospheric noise compared to what might be happening in the ocean?
Loydo, OK, let’s play your game. Your own post’s circle area chart (no credit given from where you “borrowed” it from, of course) shows 2.3% “global warming” going into the atmosphere versus 93.2% going into the ocean.
So, on what planet is 2.3% of anything considered as “statistically insignificant (atmospheric) noise”? Careful before you try to answer this . . . keeping in mind the billions of dollars and untold number of “scientific” labor hours spent debating and publishing papers relating to just the difference between 0.03% and 0.04% concentration of CO2 in Earth’s atmosphere.
BTW, if this was your attempt to deflect me for previously drawing attention to your mistake of confusing heat content with temperature, it too comes across as being sophomoric.
“When you find you’re digging yourself deeper and deeper into a hole, the first rule is . . .”
Finally, it is not what I think, but what the facts are.
Realists do not believe the climate began in 1970.
The current warming trend began in the 1700’s ( and does not correlate with CO2).
Going back 4-5,000 yrs, the Earth is in a cooling trend, interrupted occasionally by warm periods (eg, Roman and Medieval Warm Periods, and the current 200 years of moderate warming.)
Go back 2 million years. There have been multiple deep cold periods (“ice ages”), each lasting greater than 100,000 yrs, interrupted by brief warm periods of 10 to 20 thousand years. We are about 10,000 yrs into the current relatively warm period.
Go back tens of millions of years. The Earth was many degrees warmer. CO2 levels were as much as 10 times higher. Life on Earth thrived. There was no “tipping point”.
To understand climate, one must be able to zoom in and out of these different time scales or perspective is lost. On a geologic scale, the minute warming of the last few decades is trivial.
Only hysterics or people who hate people and love to dwell on “the end is nigh” apocalypses buy into the nonsense——or corrupt people with an agenda——or simple fools with no understanding of real world science, poor souls.
Meanwhile Tropical Tidbits 3.4 ENSO region graph shows temps continue to rise in the 3.4 region ever since sunspot 2804 moved to the back side of the sun, and southern sunspots 2806 and 2807 grew in size.. Every 6 hour update since 2804 moved to the back has shown a rise in temps. …
Believing NASA, La Niña will continue.
Imo, temps in the 3.4 region will continue to rise until sunspots start forming in the northern hemisphere. Note that on the TT graph that temps started dropping after February 19th. That is when sunspot 2804 appeared in the north. Temps fell from February 19th to March 2nd when sunspot 2804 moved around to the back side of the sun. Now with two sizeable sunspot groups in the south temps in the 3.4 region are rising.
goldminor
For me it is always amazing to see that people who use to discredit NASA and NOAA all the time for publishing too ‘warm’ temperature series, suddenly agree in their results whenever these show… cooling:
But other sources speak a different language, e.g. Australia’s BoM:
http://www.bom.gov.au/climate/ocean/outlooks/#tabs=Graphs®ion=NINO34
or the Japanese Met Agency:
http://ds.data.jma.go.jp/tcc/tcc/products/elnino/nino_fcst/indices/indexninofcst.html
We’ll see who was right.
J.-P. D.
Keep an eye on how the 3.4 region reacts to sunspots. That is the crux of my comment. Imo, temps will rise in the 3.4 region as long as sunspots are dominant in the south, and until strong sunspots pop up in the northern hemisphere. My theory is that sunspots directly affect temp shifts in the 3.4 region.
goldminor
” Keep an eye… ”
Hmmh. I’m keeping an eye on so many things that I don’t know how to add even one.
Some years ago, a person denied any correlation between SSN and F10.7cm.
To convince, I generated this graph out of the data available at SILSO and at Canada’s Solar radio flux:
https://drive.google.com/file/d/1ShXgzae4Fr_fOs9kWJiSzD8yXkcewQZY/view
If you have lots of sun spot data at hand, you could compare that data with e.g. HadSST3’s grid data over 5S-5N — 170W-120W, and produce a graph comparing spots and SSTs.
J.-P. D.
I am back from close call #13 in my life’s saga. After 7 days of dialysis I feel like a new man, and my mind is sparky. So here goes chapter 3 in my life. Looking back at Oulo’s chart, and TT’s 3.4 chart I see that my concept is still in full play over the last 12 days which I spent in the hospital. Note that from March 3rd to March 10th temps in the 3.4 region rose as sunspots crossed in the southern hemisphere the entire time.
On March 10th a sunspot (2608) appeared in the northern hemisphere as the last spot disappeared in the south. Note how temps moved sideways on TT’s chart at that point. Then spots in the north of the sun stayed predominant from then on, and by great coincidence temps in the 3.4 region have dropped ever since as sunspot 2608 crossed in the northern hemisphere. A new spot 2810 has just appeared in the north. So temps in the 3.4 region should continue to fall.
It’s fine as it goes, we are still in solar minimum, there is a laNina (not particularly strong, not yet) so not much surprise there.
In the long term global warming has mutated to climate change regardless of warming, pause, cooling or even blid..ng freeze, the CO2 mighty mol is guilty of anything going on.
For time being fire should be directed at the climate change gangsterism and damage it does to the planet and in particular to the poor third world countries.
The USA demo-farts claim they have a ‘social consciousness’ on one hand and intend to plunge less well off into misery, while Boydens, Gites, Berzoses, Mustkies and some other hippo crates of semi-liquid shitakes will do just fine (number of intended misspellings present).
CO2 = TRUMP
on a DERANGEMENT level..
Carbon derangement syndrome = trump derangement syndrome.
Do you have both ???
CO2 and Trump have both been demonized by people with an agenda.
“CO2 and Trump have both been demonized by people with an agenda.” And a conscience….
I dismiss the climastrologists for a very simple reason: Nowhere do they address the issue of weather modification ..er.. technology. I get to the bottom of that colourful little picture with arcane symbols. I see a feedback mechanism, “oh, hell, now we have to look at maths…” so I start at the top again, paying attention.
And there it is: Line 1, variable “aerosol”. They got me covered, now I sound like a conspiratist… someone who whispers things 39 times in the hope, no, living as if, it has become true.
Even if Climate Catastrophe were true, or if you’re just trying to humour the Alarmists or distract them from their disastrous policies – don’t ever suggest weather modification, especially if it involves dumping crap in the atmosphere. Much better to let the plants and plankton enjoy the sunshine and all the free CO2 we are giving them, and spice things up for them with a tiny bit of iron dust spread out over the oceans to make the plankton happy and have a good appetite so they grow faster and suck up extra CO2 (not that there is anything wrong with CO2 but it’s comforting to alarmists and those afraid of clowns and Santa), and become a bounty for the whole food chain above them. Much cheaper than carbon taxes and unreliable green tech, shuts up the bed-wetters, helps restock the fisheries of the world, and actually helps the environment.
Paranoid Guy I totally agree with PCman999, you must be crazy or wildly misinformed. Are you not aware of Snowpiercer? Where in the near future after ignoring AGW scientists disperse CW-7 into the atmosphere but went disaterously wrong where the world becomes a frozen wasteland and has killed all life except for the lucky few who boarded the Snowpiercer, a train that travels around the globe,
Slightly off topic, but as we haven’t had the WUWT UAH update yet, I’ll use this post to give some “fun” facts about February 2021.
UAH6 gives the February anomaly compared to the 1991-2020 base period as 0.2c, up 0.12°C from January. (Using the old base period of 1981-2010 this would be 0.36°, up 0.10°C).
This was the 7th warmest February, 0.39°C cooler than the last February.
The top 10 warmest February’s
Some context and uncertainty free trends up to the current month.
The longest negative trend is 5 years 7 months long, starting in August 2015.
The longest trend greater than 4°C / century is 10 years 9 months long, starting June 2010.
The longest trend greater than 3.4°C / century is 13 years and 11 months long, starting in April 2007.
Mr. Monckton, I was eager to see the new pause for myself, so I plotted UAH V6 back for 5 years, and I was shocked to find a positive trend! Could you tell me what I’ve done wrong? I’m afraid I can’t locate your pause.
You the forgot the all important 7 months.
Ugh, you’re right, total bonehead move! Just to make sure I didn’t screw up again, I went ahead and went back an extra 4 months on top of the 7 just to make sure I’m capturing the pause. But I must still be doing something wrong because there’s no pause here either!
As 5 years and 7 months is carefully chosen to be the earliest start date to give a negative trend, then starting any point before that will give a positive trend.
What’s amusing is that because this is such a short period to look for a trend, and because it starts with such a massive increase in temperatures you don’t have to go back very far to see much faster warming trends. Start at the start of 2015 and you are warming faster than the average trend over the entire run, go back just another year and you are warming twice as fast as that, over 3°C / century. .
CO2 is life
Why then were they so worried about rising CO2 levels on Apollo 13 ??
https://www.kane.co.uk/knowledge-centre/what-are-safe-levels-of-co-and-co2-in-rooms
Of course you know the actual level that can kill a human is around 4%. Not 1/100 of that amount.
Not very sciency are you? Now I understand the general tone of all of your comments on WUWT. Ignorance rules your opinions.
And as to Apollo 13:
http://piecubed.co.uk/apollo-13-co2-lessons/
“the CO2 levels on board Apollo 13 rose close to 6%”
BTW. 10 minutes of research on Duck Duck Go for the above information. Your ignorance is clearly willful.
A society like the current state of Venezuela is the result those of your persuasion are wishing for. That scares the hell out of me.
OMG half-runt.
WHY expose your blatant ignorance so much !!
That a really dumb thing to do.
Let us know when CO2 levels start reaching 40000ppm.
Are you really as stupid as your posts make you seem?
ROFLMAO
You have just exposed your total ignorance of the method being used.
It is obviously totally beyond your abilities to learn.
What else would one expect from a guy that loses room keys for a living !
Fair enough, we get the point, but the purpose of the exercise with pauses is that with the assumption of the alarmists’ idea of CO2’s affect on temperatures and with the ever increasing CO2 levels, one would not expect long stretches of flat temps. One would expect the temps like from 1975-1998, not the almost flat trend from 1998 until now, in light of the huge increases in fossil fuel use. And in the end, 1 or 2 degrees of warming by 2100 sounds comforting, considering the disastrous effects of cooling like in the early 1300s. I would gladly accept Southern Ontario becoming like Bali, rather than Edmonton (no offense intended, Eskies and Oilers fans, I’ll gladly admit you’re made of stronger stuff) .
“the assumption of the alarmists’ idea of CO2’s affect on temperatures and with the ever increasing CO2 levels, one would not expect long stretches of flat temps.”
This assumption is inaccurate for a couple of reasons. First is because the temperature record contains a combination of signal+noise, and the noise in the climate is quite large. We need to look at very long periods of time before the signal to noise ratio is high enough that we can clearly distinguish the underlying trend. If a trend depends exclusively on the years you pick as the end points of your trend line, you’re not looking at a long enough time period (this is a general rule of thumb – you can use statistical approaches to determine whether a trend is significant – you will likely not be surprised to learn that Mr. Monckton’s trends do not pass tests of statistical significance).
The second is that CO2 is not the only driver of earth’s climate. CO2 is said to be driving the long term warming trend since the mid-20th century, but there are other forces on various time scales that have an impact as well, both positive and negative (changes in solar output, decadal cycles in ocean temps, volcanic activity, etc.). It is the sum of all these forcings that produces observed changes in temperature. So even beyond the random year to year variability, there can be longer term swings superimposed on the gradual background warming.
Maybe the natural climate is the predominant signal and the AGW is the noise then?
The climate in general is the signal, random variability (“weather”) is the noise. Separating out signal from noise does not require making an attribution.
Horse hockey. You are trying to repeat talking points but you have them wrong.
A Temperature trend for the globe, whether it is right or wrong, IS NOT CLIMATE! It can not define climate in any shape or form. Climate includes temperature, rainfall, soil type, altitude, geography, flora, fauna, etc. All kinds of different parameters. It’s possible to pass through different climates in just a short distance while ascending a mountain.
Climate change based on a single parameter is a misnomer from the start. If anything, it should simply be called temperature change!
Climate is also the entirety of the temperature profile, not an anomaly developed from an average mid-range value subtracted from a daily mid-range value.
“A Temperature trend for the globe, whether it is right or wrong, IS NOT CLIMATE!”
It is a signature of climate change.
No, it isn’t a signature of climate change. It isn’t a signature of anything other than math majors and computer programmers thinking a conglomeration of independent measurements form a probability distribution like a random variable does.
Every prediction of climate change that has been made has never come true. Quit telling stories. You can’t name one study that has had an accurate prediction of how any climate has already changed.
No snow – nope
more fires – nope
more storms – nope
More stronger storms – nope
more flooding – nope
more drought – nope
more famine – nope
More sea level rise – nope
Polar bear extinction – nope
coral death – nope
I don’t see much climate change.
You are like the guy wondering the city streets with a sandwich placard touting the “End of the World is Coming”. He roamed for 30 years and you know what people ended up thinking of him?
You haven’t a clue. Noise is an extraneous frequency to what you are examining. In your terms, “climate” is the signal. It isn’t. It is the frequency, i.e., temperature you are examining. The fact that you want to average it and call that average some new phenomena is not relevant. You are examining temperature, not climate. The natural variability is actually variance in the temperature, it is not noise. That variance should be calculated and prominently displayed with any average so one can tell how well the average represents the entire scope of data.
The trend from 1998 till now is 0.12 deg/decade, pretty much the same as the trend from 1979
Weekly_rise
Bellman got it right!
https://wattsupwiththat.com/2021/03/05/the-new-pause-lengthens-by-another-month-to-5-years-7-months/#comment-3200221
J.-P. D.
Not bellhop is just another ignorant twit.
Like you Bin-laden
!
Writing about pauses means you have been sucked into the scam. It is ALL data manipulation.
There is no global warming. There is no pause. Earth’s surface temperature to the best of human’s ability to measure it is STABLE.
Earths surface energy balance is controlled by two powerful highly temperature sensitive processes; formation of sea ice at the poles and convective instability in the tropics. Both temperature limits have been documented for decades.
This would be the slight negative feedback he mentioned. There is some warming, but minor. The rise in CO2 has been extremely beneficial to food production.
You have a good point. One could show the real average temps against a background of the real seasonal temp ranges of a few select places (like the-20 to +35°C that’s common here) and be hard pressed to notice even the artificially enhanced temperature trends that the alarmists and bed-wetters are crying about.
You mean like this –
What about UAH which took a disappointing uptick for February to 0.2C above the (recently re-aligned) 30 year mean from 0.12 in January. But I’m expecting great things from a persistent La Niña later in the year.
I keep telling you not to calculate trends using seasonal data. The trend using anomalies is 2.7°C / century, not the 3.0°C / century you get using un-adjusted seasonal data.
ROFLMAO
England gets some SUNSHINE and the carbon-haters get all excited
Do you actually read the posts you’re responding to, or are you some not very sophisticated machine learning algorithm.
Or could write posts that actually meant something
Try it one day !!
You really are just a monkey with a linear trend calculator.
No understanding or thought process on your part, at all.
Let me try to clarify. Lord Monckton calculates trends for CET using monthly temperature values. This is a mistake, and means you get a faster rate of warming than if you used annual data.
Why is this a mistake? Because CET data is presented as actual mean temperatures, rather than monthly anomalies. England has seasons, it’s colder in the winter than it is in the summer, and these season fluctuations are bigger than any trend, as is pointed out in the head post.
This matters because the seasonal variations will increase or decrease the trend, depending on where you start the calculation. As the year starts in January, this is being used as the start point of the trend, but this means the first few months of the trend will be cold, whilst the hottest months will be in the second half of the year, and this means the trend will add an artificial warming to the trend.
This would be very obvious if you only looked at a single year, you will see a very large artificial trend. (For example, the trend for the 12 months of 2020 is equivalent to a warming rate of 270°C / century, a rise of 2.7°C on the year). But even when averaged over 40 years you are still seeing a noticeable increase in the trend. I estimate, empirically, that this is adding around 0.2 – 0.3°C / century to any 40 year calculation.
This can be seen by converting the monthly temperatures to anomalies to remove the seasonal fluctuation, or by using Annual average temperatures.
Bellman,
I think you’ve hit the nail on the head. As far as I can work out, fred250 is not a real person at all, but a bot programmed to deliver a random schoolboy insult to any carefully worded post, with random CAPITALS.
I guess it’s just a ploy to keep the discussion going
The Netherlands shows a comparable pattern of sunshine hours. A dip around 1989 and a rise in Sun hours till 2018. We must have had more high-pressure areas during the summer months. A changing weather pattern brought better summers. It will be interesting to see what the future will bring, the England sunshine hours seem to plateau a bit.
For sun hours in the Netherlands: see the second yellow graphic in the link: https://www.weerplaza.nl/weerinhetnieuws/2018-is-zonnigste-jaar-ooit-gemeten/4882/
You’re not cooking the data right. Let me show you how to do it properly.
Go on.
Bellhop, who works himself up into a lather every time it is pointed out that there is a Pause in global temperatures, seems not to understand that if one sticks with the actual data, and uses the same basis of calculation for 1694-1733 as for the most recent 40-year period, the comparison will be fair. There was not as much warming in the past 40 years as there was from 1694-1733. Get over it.
Aside from the cherry-picking of dates and ignoring the huge uncertainty in CET at the time, the rate of warming at the end of the 17th beginning of 18th century has a lot to do with the fact you are starting at particularly cold decade. The rate of warming might not be unprecedented, whatever that means, but the temperatures are.
Average temperatures between 1694-1733 was 9.1°C, average temperature 1981-2020 was 10.1°C.
Funny how coming out of the LIA will do that.
I do find it strange that people here will constantly go o about imperfections in modern data sets, will happily use any arbitrary trend in CET, even from the 17th century if they think it proves their point. The original CET was an amazing piece of research, but making exact comparisons with data that is so uncertain is really over selling it.
For context, here’s what Manley says about the early CET figures:
…
You are right that, to be rigorous, the end-points of a trend should use the best estimate available of the temperature uncertainties and provide a range of probable slopes. However, you should be prepared for the possibility of a negative (cooling) slope.
As I said below, I did find a cooling trend.
Hi Bellman.
For what it’s worth, I analysed the CET Summer mean monthly (JJA) and found that the decade from 1771 to 1780, the ave temperature was 15.85 deg C. Now compare that with our last decade, 2011 to 2020, of 15.98 deg C. The 1780 decade was the fourth warmest behind 2000 (15.89 deg C), 2010 (16.10 deg C) and 2020 (15.98).
Cheers, JB.
Bellman yet again displays his striking ignorance. If he would only read a little history he would be aware of how very cold the Little Ice Age was in Europe. Therefore, the rapid rise in temperatures shown in the Central England record for 1694-1733 is well supported by everything from accounts of frost fairs on the Thames to Dutch Old Master paintings, followed by the milder weather we have been fortunate enough to enjoy since that very cold period.
Just as IPCC likes to use the argument that the models, though flawed, are the best we’ve got, so I use the argument that the CETR is the best regional record we’ve got for the end of the Little Ice Age.
Hey, Lord Monckey, you destroyed him! Or not… 🙂 I read a lot of history (like you, undoubtedly), and I think both you (an actual expert, and a member of the Upper House 😉 ) and I agree that historical sources are hardly well suited for quantitative analysis. So while we know that period was rather cold, we don’t know how cold it was (using solely historical sources). Furthermore, the rate of change was so slow people didn’t notice it in their lifetimes. We don’t really have even qualitative historical evidence for such a quick change we have now. (Like “good god, winters are much milder today than in my childhood”)
Are you related to Pelosi, perchance?
No.
I wish people would be more specific when talking about the LIA. Are we talking about the general cold period, ending towards the close of the 19th century, or the specific very cold period at the end of the 17th – the time of the seven ill years?
I know it was very cold at the end of the 17th century, that was my point. According to CET it was increasingly cold during that time, then suddenly was a lot less cold. Twenty years later it warmed again to temperatures that wouldn’t be seen again until the 20th century.
One again with the frost fairs! I don’t think there were any frost fairs in London during the 1690s, the big one was in 1684, but you don’t include that in your warming trend. There was one in 1716, half way through your warming trend, and a really big one right at the end of this warming period, during the coldest year in the CET record.
Lessons from this are that, frost fairs are not a very reliable way of quantifying annual temperatures, and that Central England Temperature is very chaotic and difficult to establish how reliable any trend – modern or ancient.
I agree, I love the CET, but you do have to understand it’s limitations, and that means not making arbitrary comparisons, especially of trend, with no regard for the uncertainties.
One can’t perform parametric statistical summaries, but there are non-parametric statistical procedures that work with ranking. Also, algebra allows for working with inequalities. You use what you have.
Lord Moncton of Brenchely
You state that the CETR is the best regional record we’ve got for the end of the Little Ice Age.
You are correct in this, but the Central England Instrumental Temperatures Data set is far more than just a regional record–it spans the globe.
See my paper “Central England Temps.Data Set: Key to Understanding the Cause of Climate Change” .
https://www.osf.io/bmu69/
One amusing aspect of the 1694-1733 fastest ever warming trend is that it includes a pause lasting over 20 years. Between 1702 and 1725 the trend is negative.
Bellman:
The 1694-1733 warming was caused by periods of reduced volcanic activity. For example, there are no VEI4 eruptions recorded for between 1694 and 1707.
The period 1727–1739 was also free of eruptions.
There were no dimming volcanic SO2 aerosols being spewed into the atmosphere during those periods.
It will be interesting to see how Lord Monckton reacts when version 2 of CET comes out. My prediction is if it shows more warming it will be called fraudulent, and if it shows less it will be an honest improvement.
Improvement 😉
Honest 🤓
Bellman should get his kindergarten mistress to read him the head posting. He will not find any suggestion that the HadCRUT record is fraudulent. I have simply reported the inconvenient truth that in the previous version of the dataset the Pause is almost a year longer than in the present version: make of it what you will. As they say on Fox News: “We report: you decide”.
No suggestion, except saying it had been tampered with.
You are misusing the meaning of “cherry picking.” If one makes a claim that the slope of a line between points B and C is zero, and you come along and remark that the slope of the line between A and C is greater than zero, that is cherry picking. It also is a non sequitur because the original claim you are trying to falsify never mentioned point A. It might also qualify as a straw-man argument.
So why do you think Lord Monckton chose 1694 as his starting point for the great warming 40 years? It’s because he’s looked at every other starting point and seen that gives him the greatest bang for his bucks.
Your logic escapes me. I’m the one pointing out there is a long pause during Monckton’s fast warming period, is it me or is it him cherry-picking?
Cherry-picking in this context means deliberately choosing specific dates to demonstrate a particular outcome.In this case to choose the start date that gave the fastest rate of warming over a 40 year period.
If you prefer, call it the endpoint fallacy.
It all comes down to definitions. If you ask the question, “Have there been any periods greater than two years during which the slope of the trend line has been zero?”, then it doesn’t require “deliberate choosing.” It just requires building a table of slopes for the database being used, and identifying the period(s) that meet the stated criteria. An interval of time either is an affirmative answer to the question or it isn’t. There is nothing special going on! And, it makes perfect sense to start with the most recent data and work back in time if one wants to risk extrapolating into the future.
He’s not starting with the most recent data, unless you think 1733 is recent.
This article is about the most recent pause in the warming trend.
But my comment you were responding to, the one that mentioned cherry-picking, was to the warming between 1694 and 1733.
Bellman uses the climate-Communist meme catchphrase “cherry-picking”. However, when the totalitarians of the Nazi Party wrote a book “100 scientists against Einstein”, who had made the then-fatal error of choosing Jewish parents, Einstein replied that if there were anything wrong with his theory of relativity a single counterexample would suffice.
Likewise, to demonstrate the falsity of the climate-Communist notion that the recent rate of warming is “unprecedented”, only a single counterexample is necessary. In this circumstance, one is entirely free to choose any counterexample one wishes to choose. Therefore, Bellman’s characteristically poisonous and malevolent allegation of “dishonesty” is as false as everything else he writes here.
What he’s supposed to have said is along the lines of “Why 100, If I were wrong, then one would have been enough!”. He’s supposed to be talking about the number of authors, not the number of counterexamples.
But, there is a clear distinction between logical arguments – one counterexample disproves a theorem, and statistics, where a single piece of data never proves or disproves anything. The best you can do is show it’s very unlikely that a result would have happened by chance, but if you pick the data to prove your point, ignoring data that shows a different result, any significance test goes out the window.
Your broader point that you can use 1694 to demonstrate that the rate of warming in central England isn’t “unprecedented” would be OK if anyone had made that point. But I suspected that all claims of unprecedented warming are talking about global not local temperatures.
You sort of described how you really need to analyze a time series! Anomalies used to build a time series hide the variance of the underlying data and therefore linear trends tell you almost nothing about what is actually happening. What you have described is kind of like using first differences to turn the non-stationery time series into a stationery one conducive to using trend lines with. My guess is that you will find cyclical impacts from the oceans.
Again you show your GROSS IGNORANCE of the methodology, even after its been explained to you
LCM is NOT cherry-picking anything.. the maths determines the start point.
Why is it so difficult for a lowly bellhop to understand simple concepts.
The maths was to go through every 40 year period and choose the one with the greatest trend. You don’t have to explain it to me, I can do it myself.
Admission that you don’t understand, yet again
So funny
Slop-stick comedy at its worst.. 🙂
As usual, Bellman, who is handsomely paid by a climate-Communist front group to try to disrupt these threads, displays the militant ignorance that goes with the conformist, totalitarian mindset.
We are often told by the climate fanatics that the rate of global warming is “unprecedented” – oh, and to instruct the ignorant Bellman on what a rate of global warming is, it is the change deltaT / deltat in temperature over time. It is, therefore, necessary to find only one counterexample to demonstrate that the recent warming in most of England is not unprecedented. That is not how totalitarian politics works, but it is how science works. Get used to it,
I think someone might be perpetuating a fraud. Someone is being handsomely rewarded for everything I write, but I’m not seeing any of that money.
So, a rise of 1C since the COLDEST PERIOD IN 10,000 years
GREAT NEWS..
Maybe you have a an upgrade to news-vendor in your aspirations?
The point was the current warming is starting from a higher point, not how much we’ve warmed since the 1700s. Temperatures barely changed for much of that time.
Yepp, absolutely NO human CO2 warming indication what so ever.
I’m making no claims in any of these comments about what caused the warming. If rising CO2 is affecting the warming in Central England it’s only indirectly – there are many more factors that can cause long term changes in a small part of the globe, especially a part that has such an unusual set of climatic conditions. That’s one reason why I don’t think it makes much sense to compare the changes in the 17th and 18th centuries with changes in the 20th and 21st centuries.
On the other hand I wish you would provide some evidence to a claim that there is zero indication.
You see a “trend” in this mess?
There’s a trend, but also a huge amount of noise. That’s why CET is not a good proxy for global temperatures. Can you see Monckton’s period of greatest rate of warming in that mess?
You can see the trends better looking at 30 year averages.
It’s clear that CO2 has little to do with the big swings at the start, but after 1750 there’s a better fit.
That looks like a cloud of mosquitos blowing in the wind. What is the r^2 value for that regression line? If it is less than 0.5, then you are talking about a coin toss. My guess is that it is much less than 0.5!
It’s not high, better for global data, but less than 0.5 I suspect. But that doesn’t mean it’s a coin toss.
It’s 0.17. About about 1/6 of the annual variation could be explained by CO2.
If I were your boss, and told you that you had a 17% chance of getting a raise following your next annual review, would you start looking for another job? If the odds of a horse winning a race was 17%, would you bet your house on the horse?
I’ll get back to you on the actual r^2 value. I may have made a mistake somewhere, as I’ve just checked it again and it’s now showing up as 0.25. Will have to do redo this when I have more time. In any event why you are talking about odds and probability – that’s not what r^2 means.
What you should be asking is, is the correlation statistically significant, and the answer is yes.
Double checked. It’s still 0.25. Not sure where I got the 0.17 from.
p value is 2.2e-16
At an r^2 of 0.5, 50% of the variance is predicted by the independent variable — the same odds that a head or tail will come up on a coin toss. Unless it is a multivariate relationship, and one has the data for the other variables, the independent variable time has no utility for predicting future dependent variables.
Again, this has nothing to do with probability. The r^2 value, as you say indicates how much of the variance is predicted by the independent variable. An r^2 value of 0.5 is not saying there’s a 50% chance of anything happening. It’s roughly saying that if the variance in the dependent variable was, say, 2, once we factor in prediction from the independent variable it would be reduced to 1.
Bellman,
“Again, this has nothing to do with probability.”
Huh? Variance *is* associated with probability.
” if the variance in the dependent variable was, say, 2, once we factor in prediction from the independent variable it would be reduced to 1.”
You mean half of the variance of the dependent variable is from something other than the independent variable. That’s an indication of a poor model if half of what is causing the variance in the dependent variable is unknown.
If r^2 is 0.17 then it means that 83% of the variance of the dependent variable is from unknown factors. That’s not a good result at all! Especially if the independent variable is TIME.
But it’s nothing like tossing a coin if you have an r^2 of 0.5. I’ve really no idea what Clyde Spence means by that.
I never claimed it was a “good” result. Why would you expect most of the annual variance to be explained by CO2? There’s an awful lot going on there, and I’m only pointing out to fred250 there is more than zero correlation.
I’m certainly not suggesting this proves anything, just that there is a statistically significant correlation.
The r^2 value becomes much better when you apply it to global data. For the 170 years of HADCRUT4, the r^2 value is 0.85.
If the correlation between two variables is perfect (1.00…0), then the probability that y = x is 100%. That is, the independent variable is a perfect predictor of the dependent variable.
If the correlation between two variables is zero (0.00…0), then the probability that y = x is 0%. That is, the independent variable is not a predictor of the dependent variable.
What happens in between the two extremes? Do you suppose that the relationship only exists at the end-points?
A correlation of 1 does not mean that y = x, it means x predicts y. e.g, y = a + bx. With a correlation of 1 this is true for every data point, so yes the probability that y hits the trend line is 100%
I don’t know what you mean when you say that if the correlation is 0, then y cannot equal x. If you are talking about individual values than y can certainly equal x. As you say it’s just that x is not a predictor of y.
In between as r^2 increases points get closer to the predicted value, but I still don’t know what you mean about an r^2 value of 0.5 implies there’s a 50% chance. A chance of what? You seem to be making a categorical error, like saying one horse was half the size of the other one, that’s the same odds as tossing a head with a coin.
Maybe you’re making a valid point, but I’m just not seeing it.
A regression line with a correlation coefficient of 1 has a slope of 45 degrees. From trigonometry, the rise and run have to be equal.
Read the material at the following link:
https://www.thoughtco.com/slope-of-regression-line-3126232
Note particularly the formula for the slope (a) of a regression line.
For a correlation coefficient of 1, when the standard deviation for x and y are equal, the slope is 1 (45 deg). How are the x and y standard deviations going to be equal unless all the y-values pair exactly with all the x-values?
There are only two instances where the correlation coefficient can be zero. 1) when y is a constant and all values are parallel to the x-axis; and 2) where both x and y are random and a scatterplot generates a point-cloud with no correlation. (It is possible that x and y might be equal for one point, but if the correlation coefficient is zero, the zero-slope regression line has no predictive value. So, maybe I should say that the probability of y=x is vanishingly small for r=0.)
I suspect that the reason that you are “just not seeing it,” is because you plug numbers into a spreadsheet or statistics package without really understanding what you are doing. You are like a technician following the instructions in a repair manual, not knowing why you are told to do what you are.
Not true at all. Even your linked article says nothing of the sort.
The formula you are talking about,
is saying you can derive the slope a by multiplying the correlation coefficient by the sd of y divided by the sd of x. If the slope is 2, and r is 1, then the standard deviation of y is twice that of x. a, the slope of the line, could be any size.
And none of this is anything to do with why you think an r^2 value of 0.5 is like tossing a coin.
Bellman,
Your math makes no sense. If the slope of the line is not 1 then y can’t equal x except perhaps at x=0. If the slope of your line is 2 then y will never equal x. It will always equal 2x.
You’re mixing me up with Clyde Spencer. He’s the one who thinks that y always equals x if r is 1.
The equation from his link is only describing the slope, not the intercept. If the slope is 1 and the intercept is zero than y = x for all x and y, if the slope is 1 and intercept is not zero, y will never equal x, and if the slope is not 1, y will equal x for 1 specific value. It’s pretty basic linear algebra. Solve y = b + ax, y = x.
You are equivocating. The intercept is an offset that can be adjusted for.
If the slope is not the same then y can never equal x, even after the offset has been adjusted for.
If the slope is not 1, then y will equal x at one point. You said that yourself, x = y = 0 will be a solution if we remove any offset. What I don’t know is how this is relevant to any part of the discussion.
First you say my maths makes no sense, then you say I’m equivocating. What you are not saying is what you think about Spencer’s claims. Is an r^2 value of 0.5 like tossing a coin, and if so in what sense?
Nope. If the slopes are not equal then I can’t think of a situation where the intercept will occur at y = x other than at zero.
If correlation is r^2 = 0.5 then it means that in a scatter plot you will have about the same number of points above and below the trend line. I.e. flip a coin.
Nope what? As I said if you remove the offset the point where y = ax intercepts y = x will be y = x = 0. I’m really not sure what you are arguing about here.
Well yes, but the same is true for any r^2 value < 1.
“Well yes, but the same is true for any r^2 value < 1.”
Come on! You know better than this. You won’t have *about the same number* for any value less than 1!
I don’t know better, but I’m sure I’m right.
In fact for fun, I’ve just generated some random data. Two sets each with 100 data points. Set 1 had r^2 = 0.9, set 2 had r^2 = 0.08. Set had 51 points above the line and 49 below the line. Set 2, 52 above 48 below.
What was the variance of each data set?
Where did the pre-1958 CO2 concentrations come from?
Ice core samples.
So, the red line is a splice of two different methods of measuring a physical parameter! You are aware that the ice core data is inherently smoothed, and may have an offset from the method used for real-time measuring?
Yes, but any offset is pretty small compared to the overall variance in annual temperatures.
If Bellman were not paid to write nonsense here, he would realize that an increase of 1 degree in temperature in 300 years, from the “particularly cold decade” to which he refers until the present, is not a lot to worry about.
I’m worry about it a lot. The degree rise was merely to point out the difference between the two periods. You can say the trend isn’t significantly different, but the temperatures are. The first warming starts from a very cold time, the current warming starts from a relatively mild time. It seems unlikely that the causes of the two warming periods are the same, especially if the cold 1690s were caused by the Maunder Minimum as some claim.
That should have been “I’m not worrying about it a lot.”
But can it really be as simple as this to derive ECS?
We humans emit 10 Gt of carbon (CO2 equivalent) every year in a combined sink consisting of the atmosphere and hydrosphere which are in a continuous equilibrium at a ratio of approximately 1:50 of CO2 in the atmosphere and hydrosphere respectively. The atmosphere contains about 890 Gt of carbon equivalent of CO2 while the seas and oceans are calculated to have 38,000 Gt of CO2. The combined quantity of carbon contained in both the atmosphere and hydrosphere as CO2 is about 40,000 Gt.
So what are we looking at here? We are looking at an injection rate of anthropogenic carbon as follows:
0.0274 Gt C per day
0.00114 Gt C per hour
1.9E-05 Gt C per minute
3.17E-07 Gt C per second
in a sink containing ~40,000 Gt of C.
Our CO2 contribution to the global system is less than insignificant. It becomes even more significant when one realises that those ~98% of those tiny little bits of CO2 that we release into the atmosphere will eventually be absorbed by the hydrosphere as per Henry’s law.
A corollary to this is that a slight warming of the oceans will result in a substantial release of CO2 into the atmosphere, which may just be the case in this current phase of global warming.
I meant ‘It becomes even more insignificant.. ‘
Estimates of carbon sinks badly undercount vast buried and exposed carbonates.
Even in well known rigorous industries, estimates are usually wrong.
Which is why those industries replace estimates as soon as they can get physical counts into databases.
In response to Alex, we skeptics must not do as the climate Communists do. We must not overstate our case. It is theoretically possible for a comparatively small anthropogenic contribution to the CO2 in the coupled atmosphere-ocean system to have an appreciable effect. If the system were in approximate balance before we perturbed it, then we might disturb that balance. If one has a pair of scales with exactly ten tons on each side, if the scale is perfectly balanced and perfectly frictionless the addition of a feather to one side or another will tilt the scale.
The question, then, is not whether we are exerting an influence over the climate, but how much (or, rather, how little) influence we are exerting.
Those guys watch too many spook sci-fi movies where you get an instant ice age and tornadoes that freeze things on the spot. “Day After Tomorrow” is a good one, but any weatherman who knows his “stuff” will tell you “there is no such thing”.
Are these people really delusional enough that they think anyone notices a one-half degree of change of any kind? And if there were no grants money involved at all, would they still be harping on this stuff? (Doubtful.) Are any of them aware of their very own volume of contribution of CO2 to the atmosphere?
Those questions keep coming up, and the only reason any of them get testy about it is that their need for grants money is going to be threatened by any dose of reality.
Tenths of a degree, half a degree at the extreme…
Where:
Only sophisticated manmade instruments are capable of accurately measuring tenths of a degree change.
They all seem to believe they can average themselves to 0.01K, 0.001K, or even better.
Any astronomer-sky watchers there, akording to NASA’s live orrery it must be Mercury, but have not seen it so large before, unless is something to do with its orbit precession
Mercury will be in conjunction with Jupiter these days
Thanks, Since on that image Jupiter appears to be (angularly) closer to the sun it could be it. Jupiter inclination relative to Earth is only 1.3 degrees while mercury is 7 degrees. After looking at the h ttps://sohowww.nascom.nasa.gov/data/LATEST/current_c3.gif in the last 5 days it has ‘moved’ just over two of its diameters, my money is on Jupiter.
I saw that on spaceweather.com earlier today. However, the sky map provided seems to indicate that Saturn is the second planet to the upper right of Jupiter. Any idea if the photo is mislabeled?
Saturn is near too.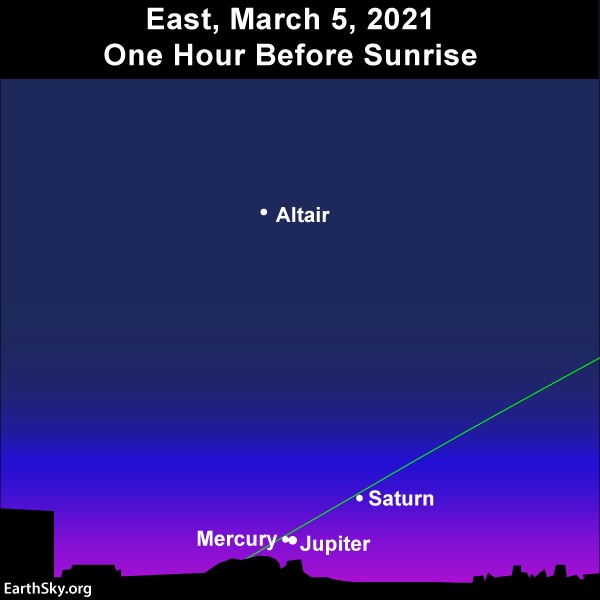
https://earthsky.org/astronomy-essentials/visible-planets-tonight-mars-jupiter-venus-saturn-mercury
Vuk, I’ve seen, in an early morning pre-sunrise over a remote lake in NW Ontario, both Venus and Mercury close together in a clear sky. They both looked big. Perhaps Mercury has a higher albedo. I woke up a mining development camp to see it. There were moans and groans from the camp but I pointed out that Copernicus on his dying bed said that he regretted never having seen Mercury. That did it! They all stumbled out to see these two diamonds repeated in the glass smooth lake surface.
The Copernicus’ “centre of the Universe is near the sun” (that would imply he might have been aware of barycentre, although Newton’s theory of gravity was published nearly 150 years after Copernicus’ d..th) although dismissed as false long time ago, probably is as correct as for any other location one can think of.
Not sure about the scale of that picture, but Venus is by far the closest to the sun at the moment, and is very bright – magnitude -3.9.
Just realised that image isn’t going to be from Earths position so that might not be relevant.
http://lucy.swri.edu/img/lagrange.jpg
Almost Earth’s view, SOHO satellite is at L1 Lagrangian point directly between the Earth and sun, well outside moon’s orbit.
HR-1, aka the Climate Misinformation Bill, may well turn out to be a spectacular own goal by alarmists.
To convict someone needs a court trial, so the defence gets to provide their own evidence and to cross-examine the other side.
Any contested data, claims or theories will therefore be scrutinised and debated in open court under Oath.
That’ll be interesting!
Yes, but decided by Democrat-appointed and brainwashed judges who already know the answer and know that any data provided by the defense must be fraudulent because it’s provided by the other side.
The data has to be provided by the alarmists. Skeptics say the alarmists have no data. It’s up to the alarmists to prove the skeptics wrong by providing some data. Skeptics don’t have to provide anything but a skeptical attitude. 🙂
Just one little bit of data would change the whole picture. Do the alarmists have any? They haven’t provided any to date. So far, all we get is unsubstantiated speculation and assertions from the alarmists. That doesn’t qualify as data or evidence.
Measuring trends of a few short years or decades in the context of geological time is foolishness, no matter how many graphs you plot.
The point is that according to the global warming Chicken Littles, CO2 controls Earth’s atmospheric temperature, and has been steadily rising for decades. Yet a corresponding steady rise in temperature is not seen, ergo there is something wrong with the premise about CO2.
The thing being wrong being variation about the trend, including changing ENSO conditions.
ONLY warming in the last 43 years has come at El Nino events
..nearly 6 years of pause now,
no warming from 1980-1997, (17 years)
No warming from 2001-2015 (15 years)
So for 38 of the last 43 years NO WARMING
There is absolutely NO CO2 warming signal
And no empirical evidence to back up the fallacy of warming by atmospheric CO2.
1… Do you have any empirical scientific evidence for warming by atmospheric CO2?
2… In what ways has the global climate changed in the last 50 years , that can be scientifically proven to be of human released CO2 causation?
What “empirical scientific evidence” do you have that all the warming of the last 43 years have come from El Niño events? How do a couple of El Niño events cause permanent warming? Why do La Niña events not cause permanent cooling? Are you no longer claiming it’s increased solar activity, or more sunshine that is causing the warming?
Duck and weave, you poor insipid little muppet without a hand-up.
1… Do you have any empirical scientific evidence for warming by atmospheric CO2?
2… In what ways has the global climate changed in the last 50 years , that can be scientifically proven to be of human released CO2 causation?
Answering questions with questions ==> he can’t give a cogent response.
I’ve given responses before, he just ignores them all calls me a bellhop, or some such witticism. If someone’s demanding I provide evidence for a claim I haven’t even made, whilst making unsupported claims himself it’s reasonable to put the same question to them.
UAH data, moron !!
NO WARMING between those major El Ninos.
Gees, go back to lugging suitcases, if you can manage even that !!
Wow, calling me a moron and using to explanation marks is such a persuasive argument I’m not sure I need to read any further. But let’s try.
Which El Niños do you count as major? I’ll assume 1982, 1998 and 2016 for this.
Trend 1983 – 1997 is 0.11°C / decade.
Trend 1999 – 2015 is 0.07°C / decade.
Of course this analysis is ignoring all other ENSO effects, from moderate El Niños and LA Niñas.
Bellman
“What “empirical scientific evidence” do you have that all the warming of the last 43 years have come from El Niño events?”
_____________
Fred has a simple method. He simply takes away all the natural warming from el ninos but keeps in all the natural cooling from la ninas and so comes up with a reduced warming trend. Ingenious. It’s called ‘selective skeptism’.
Solar activity charges the El Ninos.
Solar activity has been high for the last 40-50 years.
You really are showing your GROSS IGNORANCE now. !
And your “empirical scientific evidence” that Solar activity changes the El Niños?
What is this? Where did you get it?
TSI in 2020 was lower than in ~1960
That’s his reason for conducting the exercise.
The good Lord says: “To the end of December 2020, it was 5 years 4 months. To the end of January 2021, it was 5 years 6 months.”
how does adding one month, January, to the trend give a two month extension to the pause?
mkelly: Simple. It occurs when the new data point falls below a data point just before the beginning of the previous series. Imagine if the next month were to drop by 0.2C, we would connect up with the previous 18yr ‘Pause’! I don’t think the climate wroughters would permit this. They would wrought it out of existence – that would seem to be the objective of the recent changes to HadCrut in the UK.
The Old Pause, which used to feature in excited articles every month, was finally squeezed out of existence in February 2016, when the trend from the last few months of 1997 turned positive.
The smallest positive trend of these months to the present is from July 1997, at 0.115 deg/decade. This is not much different from the trend for the whole dataset, which is 0.137 deg/decade.
I don’t think the Old Pause is likely to make a reappearance.
ECS may actually be 0.0. Here’s another way to look at the situation.
If you perform a transformation of GHG radiation in the Earth’s energy domain (atmosphere + surface) you get a rather interesting result. The transformation is: change every event (emission + reabsorption) to an average one. This would be the strength and direction of the average of all photons emitted by the surface and GHGs.
When you do this the overall energy flow should be identical. Each photon that leaves the surface will stop N times as it is reabsorbed. Each photon will travel a distance of X meters before being reabsorbed. It will take T seconds for each event to complete.
Notice this transformed system has no downwelling IR. Yet, it is mathematically equivalent to our current atmosphere. What happened to the greenhouse effect?
What will happen if you add more GHGs to this energy domain? Since GHGs already absorb all the radiation coming up from the surface that they can absorb, the most it can do on the absorption side is slow the process down slightly. N would get larger, X would get shorter and T a little longer. However, you are also adding more emitters which naturally has the opposite effect. The two would likely cancel out telling us the ECS truly is zero.
The only way to warm the system is to add more energy to it. Hence, all the warming of the last 350 years must be due to more energy coming from either ocean changes or the sun.
To net this out. The lower atmosphere is not warmer because of downwelling IR. It is warmer because IR is integrated into the atmosphere and where there are more molecules to accept the energy it will naturally be warmer. Yes, GHGs are required to do the energy integration and the eventual emission out of the atmosphere.
The adiabatic lapse rate is the result of this integration of IR energy. Where gravity leads to a higher density of mass, it will be warmer. Gravity is not producing extra energy, it is just creating the structure for energy distribution.
I saw a recent paper that stated that ECS drops as the number of GHGs increase. This thought experiment explains why. The amount of unabsorbed energy decreases as the GHGs increase. The amount of warming produced continues to drop until all the energy is absorbed. After that you get no free lunch.
Some will jump in and claim that pressure broadening will add to the available energy. They are right. The problem is that pressure broadening is such a small factor that any warming would be negligible.
Sorry to spoil your parade, but radiation is not by photons but by electromagnetic (EM) waves. What does this mean? Photons are not bullets with a vectored direction. Molecules radiate a spherical EM wave, like a balloon and that sphere expands as it travels. The EM wave has a certain power associated with it when it is formed and from that you can calculate how much energy is available in photons. Planck visualized this as pencils sticking out from a point, I like to think of a curled up porcupine with it quills sticking out.
The upshot is two important things, one, half the radiation goes up and half down, and two, power per area is diminished by the inverse square law.
The piece I often see misunderstood or forgotten is that the sun provides all the energy in the system. The earth nor CO2 provides any independent sources of energy. Let’s also assume that all GHG;s except for water do not absorb any of the sun’s energy directly. That means there are two pairs of bodies, sun/earth and earth/atmosphere.
The sun warms the earth and the earth starts to radiate. Every time it radiates it also cools. GHG’s intercept some of the EM waves and send back half of the energy.
And here is where the misconception occurs. Warmists believe that the CO2 “back radiation” ADDS to the sun’s energy so you end up with more energy being absorbed by the earth and further increasing the temperature of the earth.
Let’s assume the sun is at its zenith and the earth and sun are at equilibrium. IOW, the earth is receiving 10 units of power from the sun and is radiating 10 units out. Remember the sun is radiating power at its own temperature and doesn’t know or care what receives it, it just keeps radiating. What little the earth radiates is not going to make the sun warmer. Likewise, the earth is going to keep radiating at 10 units because of its temperature.
Now let;s put the atmosphere in the system. Well, the earth sends out 10 units and gets 5 units back from CO2. (Not exactly right because CO2 only captures a portion of the outgoing radiation and because it is cooler it also radiates a lower power.) The end result is that the earth continues to cool, just at a slower rate. To do otherwise, CO2 would have to radiate more power than the earth is in order to reverse the gradient.
Long story, short conclusion. CO2 is an insulator. It slows heat loss which makes warmth disappear slower. That is not hotter, it is still cooling. CO2 however, can not make the earth hotter than the sun does.
Now, how about H2O? ~50% of the sun’s energy is in what is called near IR. H2O assorbs a goodly portion of this energy but CO2 almost none. Could the CO2 –> H2O feedback actually be turned around and H2O –> CO2 increases the energy of CO2?
Jim, you spoiled nothing because nothing I said is dependent on how energy is transported. It makes no difference. As I stated in my description, it is a mathematical transformation. It is a thought experiment. What the experiment shows is that the real atmosphere is equivalent to the one I described. And, as such you can elicit knowledge from a simpler paradigm.
how many more model predictions from the last 30 years just fell out of 95% error bounds this month?
does anyone even know? or care?
if climate science had the slightest pretense to rigor, we would have a site tracking (at a minimum) all the major IPCC model predictions (driving global policy since 1992) against actual temperatures
TallDave if the science was settled we would only have one model 🙂
I once put it to my local federal politician (in Australia) that all the predictions should be audited by scientists and statisticians who have no skin in the game that is known as climate science. Response – deafening silence, which was unusual because he always made the effort to respond to my many communications. This is an issue still worth pursuing.
Christopher, I relish your naughty return to the ‘pause’. The first Dreaded Pause was the single most powerful wrecking ball to the climate wroughters peace of mind and security in their ‘wreckless’ endeavors. It created a new psychological illness known as the “climate blues” that permanently terminated the careers of numerous climate scientists.
Oh, they rationalized that their depression was because they could see the terrible hot future and no one was listening. The climate blues really was nothing more than classic psychogical D*Nile. It took out those of the most delicate constitution. This is why Karl’s last ‘professional’ act before hasty retirement was Karlization of the pause.
Presently, the new pause is adding on a month at a time. How much lower must T go before it begins to conect to the earlier pause?
I am delighted that Gary Pearse enjoys these Pause pieces. I enjoy them because it is delightful to watch the climate Communists wriggle. When Ted Cruz displayed my 18 years 9 months Pause graph in the Senate, the “Democrats” did not know where to look.
That was the one based on RSS v.3 data that Carl Mears had previously stated contained a known cooling bias and therefore should not be used to infer temperatures in the TLT. You did it anyway. Mayers et al. updated their temperature data set in v.4, publishing their method in the peer reviewed literature, and you promptly dropped it like a stone. You now refer to Mears, whose data you previously relied on, as a “scientist” in inverted commas. Charming.
The paid climate Communist “The Final Nail”, one of several assigned to try to derail these threads, does not, perhaps, recall that I also carried regular analyses of all the datasets. The Pause in UAH, for instance, shows as 18 years 8 months. Not much of a “cold bias” in the old RSS record, then, was there?
And the reason why I ceased reporting on the Pause at the moment when Ted Cruz displayed the graph was that from the following month onward the el Nino began to make itself felt, bringing that long Pause to an end.
And the reason why I refer to sMears as a “scientist” rather than as a scientist is that he describes those of use whose research disagrees with his using the hate-speech term “deniers”. No scientist would resort to that hate speech and post it up on the RSS blog.
It’s even worse than my calling “The Final Nail” a paid climate Communist. If “The Final Nail” does not like that description, imagine how much less we whose research leads us to question the Party Line on climate like to be called “deniers”.
Gee, there I was thinking red-baiting was just as puerile logical fallacy, but in Monkers’ case I think it’s a bit more serious. He should have it looked at.
And there’s another climate Communist, with no serious scientific contribution to make.
If the starting point was 1940, the beginning of the 20 th century or the MWP there would be no warming at all.
All the warming is in the flawed computer models.
I’m a bit fed up with the climate right now – mainly because we need to see a downturn in global temperatures to get another turning point and only then can we start to tease apart what is and is not driving what else.
But, to be honest, I’ve lost confidence with any temperature data at the moment, because there isn’t one series that is entirely secure from meddling.
Mr Haseler may like to look at the calculation in the head posting, which shows that one does not need to tease apart what is and is not driving what else, for the warming by doubled CO2, broadly equivalent to the warming from all anthropogenic causes over the 21st century, will be a harmless and net-beneficial 1 K, and not the currently-imagined 4 K.
Look into time series analysis. Something as simple as “first difference” calculations can remove trends from two different variables with respect to time and show if there is any possibility of one “causing” the other.
Poor, poor CO2 . . . it looks like it has once again (referencing the prior intervals of 1940-1975 and 1999-2015) forgot how to cause “global warming”, aka “climate change”.
More properly, as Wijngaarden and Happer (2020 preprint) have pointed out, CO2 has just became “saturated” in the cause.
Pity.
/sarc off
It’s not that CO2 itself is saturated. As they showed in their paper, adding more CO2 will increase its energy capture. What their paper didn’t show is that that energy simply came from other GHGs (water vapor primarily). It’s the total greenhouse effect that is saturated.
“Precision research by physicists William Happer and William van Wijngaarden has determined that the present levels of atmospheric carbon dioxide and water vapor are almost completely saturated. In radiation physics the technical term “saturated” implies that adding more molecules will not cause more warming.” (my bold emphasis added)
—source https://wattsupwiththat.com/2020/10/26/study-suggests-no-more-co2-warming/
Don’t you love it! Happer and van Wijngaarden’s research may upset the whole Human-caused climate change applecart. That’s what genuine science does all the time. And here we go again.
And all those alarmists will have to rethink what caused all that ancient warming which they attribute to CO2. If it can only get so warm with CO2, and Happer and van Wijngaarden say we are at about that level now, and no warmer, then something else is needed to explain the much higher temperatures of the ancient past. CO2 could not push the temperatures that high. CO2 is at its limit today, according to the research.
We should probably find out if this is true or not before we go spending $Trillions on windmills and solar. It’s its true, we don’t need to limit CO2 production.
Yes, Tom, I’m anxiously looking forward to widespread critical review of the Happer and van Wijngaarden paper following its formal publication.
If it withstands objective reviews, then most “alarmist” climate scientists should backdown their assertions re: increasing atmosphere warming, which has indisputably occurred over at least the last 200 years, being caused predominately—and, more importantly, continuing to be caused—by increases in atmospheric CO2 content.
I say that they should backdown, not believing that many actually will.
I don’t know what Monckton means by “the 25-times-greater emission temperature that would prevail near the surface even if there were no greenhouse gases in the air at the outset,” but the AGW modeling error is not in assuming only the two components, but in assuming the water vapor (condensing GHG) feedback response to non-condensing GHGs component is linear throughout its range. In reality, the feedback should be extremely large in the temperature range where most of the earth’s ocean surface is near 0C (i.e., much colder than the earth has been in hundreds of millions of years) because that is the range where additional non-condensing GHGs will cause the greatest logarithmic water vapor response (i.e., evaporation), and progressively smaller with increasing temperature above that level. Once the great majority of the ocean surface is well above 0C almost all year, as it has been for at least 650My, the equilibrium hydrological cycle is established, water vapor dominates the GHG effect on surface temperature, and non-condensing GHGs will have little effect on it. That is why the paleo proxy record shows little correlation between temperature and CO2 except to the extent that CO2 follows temperature because of the effect of temperature on its solubility in sea water.
Let me assist Mr Langston with his elementary arithmetic. Climatology (e.g. Lacis et al. 2010) considers that about one-quarter of the natural greenhouse effect – i.e. 8-10 K – is direct warming forced by the naturally-occurring, noncondensing greenhouse gases. And it foolishly imagines that all of the 24 K preindustrial feedback response is response to that 8-10 K – i.e., that feedback response multiplies the direct warming by 3.5-4 to give eventual equilibrium warming. Therefore, current models predict 3.7-3.9 K midrange equilibrium doubled-CO2 sensitivity (ECS) in response to little more than 1 K directly-forced warming by doubled CO2.
However, emission temperature is 255 K, and it too contributes to the 24 K preindustrial feedback response. Now, 255 K is about 25-30 times the 8-10 K direct warming forced by the preindustrial noncondensing greenhouse gases. Therefore, the larger the feedback response to emission temperature, the smaller the feedback response to the preindustrial noncondensing greenhouse gases.
Bottom line: there is no basis in the preindustrail record for the assumption, explicit in paper after paper throughout the climatological journals, that about three-quarters of the preindustrial equilibrium warming – the natural greenhouse effect – was feedback response to the preindustrial noncondensing greenhouse gases.
It was that erroneous assumption that misled climatologists into assuming that feedback processes today would multiply the directly-forced warming from 1 K direct warming from doubled CO2 by about 4. For various reasons, including the points raised by Mr Langston, one cannot legitimately draw any such conclusion from the preindustrial record.
Sure enough, calculation based on the industrial-era record shows that we should only expect about 1 K equilibrium warming in response to doubled CO2: i.e., that in modern conditions one can ignore feedback response altogether and not introduce much error thereby.
I fear I did not explain the physics of GHG feedback clearly enough. If we imagine an earth with no GHGs (just N2, O2 and a trace of Ar), it is pretty much frozen solid (the “snowball earth” condition thought to have obtained at various times >650Mya) with an average emission temperature measured from outside the atmosphere of 255K, or -18C, because that is the temperature at which solar heating is balanced by infrared radiation to the ~3K cold of outer space. If we add non-condensing GHGs (effectively, CO2) at a typical pre-industrial level, the resulting 8-10K of warming melts the oceans in the tropics, releasing water vapor, a powerful GHG which leads to more warming, more melting, more water vapor, etc. until an equilibrium is reached where the only remaining frozen areas are at very high altitude and latitude. This is a “runaway” feedback effect that, once initiated, no longer depends on the initial non-condensing GHGs because water vapor is more powerful, and quickly becomes far more abundant in the atmosphere. Once that happens, CO2 is only relevant to surface temperature above the lower troposphere and in winter at high latitudes, where the air is so cold that almost all the water vapor has condensed out.
There is therefore nothing foolish in ascribing the next 24C of warming to the initial 8-10C; rather, the foolishness comes in imagining that every additional increment of CO2 will have the same effect as every previous one: the assumed logarithmic ECS. It is more likely that the surface temperature response to CO2 will have a quasi-sigmoid form, where the first increments will have the near-linear effect predicted by the normal physics of radiative heat transfer under unsaturated absorption. Once enough CO2 is added to raise ocean surface temperature enough to release significant water vapor, the response is even steeper — perhaps near-vertical — until the high-latitude ice-albedo equilibrium is reached. The response then rapidly drops off to near-zero, as the GHG effect on surface temperature is dominated by water vapor. By assuming a logarithmic ECS over the whole range of both concentration and temperature, the AGW alarmists miss the fact that we are in the flat upper tail of the sigmoid, where additional CO2 will not only not show the ~1C ECS implied by the ordinary physics of absorption-saturated radiative heat transfer, but will have almost no effect on surface temperature at all.
Consider an analogous runaway feedback effect that reaches a limit: raising a sunken ship by attaching a balloon to the bow. At first, you inflate the balloon a bit and the bow of the ship starts to rise off the sea floor. You inflate it a little more, and the ship is standing on its stern. Inflate it a little more, and the stern comes off the sea floor. What happens next is a runaway feedback effect: as the ship rises, the pressure on the balloon decreases, it inflates even more, giving more buoyancy, and the ship rises even faster. This continues until the balloon reaches the surface. But then it stops. The ship being now just below the surface instead of on the bottom is indeed entirely due to the air you pumped into the balloon when it was on the bottom; but now, no matter how much more air you pump into the balloon, it will not pull the ship up more than microscopically farther. That is the situation with CO2: now that the oceans’ surface temperature is well above 0C almost everywhere and almost all year, GHG warming at the earth’s surface is totally dominated by water vapor, and adding more CO2 has no more effect on surface temperature than pumping more air into that balloon.
The most problematic statement in Lord Monckton’s response was: “Now, 255 K is about 25-30 times the 8-10 K direct warming forced by the preindustrial noncondensing greenhouse gases.” That is an invalid and meaningless comparison of an absolute temperature (255K) with a temperature increment (8-10K). The fact that it is meaningless can be proved by simply converting both numbers to the Celsius scale: compare -18C to 8-10C. That is why I could not figure out the meaning of Lord Monckton’s original statement about, “the 25-times-greater emission temperature that would prevail near the surface even if there were no greenhouse gases in the air at the outset.” To make another analogy, that makes no more sense than saying the 295K temperature in a hospital room is nearly 100 times greater than a COVID-19 patient’s 3K fever.
Here is something you missed. Nearly half the sun’s radiation is in the near infrared. H2O has big absorption bands at these wavelengths and they have more energy than 15 um. CO2 has nearly no absorption at these wavelengths. As water was added to the earth there would be more and more water vapor. You don’t even need CO2 to start it up.
I agree CO2 is not necessary to start the process; but the fact remains that “snowball” conditions prevailed at various times even WITH substantial CO2 in the atmosphere, so without CO2 it is difficult to see how a permanent snowball could have been avoided. In any case, the point of my post was that we are probably at the high tail of a sigmoid in CO2 sensitivity, so assuming the response is logarithmic throughout the range is wrong, and ECS might be far less than 1C.
Roy, methinks you have the cart before the horse re: “If we imagine an earth with no GHGs (just N2, O2 and a trace of Ar), it is pretty much frozen solid (the “snowball earth” condition . . .”
The highest probability is that the Earth formed in the presence of water, contained in the primordial cosmic dust that gravitationally was collected together to form a molten early planet and/or by water-bearing comets that simultaneous/subsequently impacted this developing planet (see https://eos.org/articles/earths-water-came-from-space-dust-during-planetary-formation ).
It is thus most probable that primordial Earth’s atmosphere was composed mostly of water vapor. Even today, “The principle components of volcanic gases are water vapor (H2O), carbon dioxide (CO2), sulfur either as sulfur dioxide (SO2) (high-temperature volcanic gases) or hydrogen sulfide (H2S) (low-temperature volcanic gases), nitrogen, argon, helium, neon, methane, carbon monoxide and hydrogen . . . The abundance of gases varies considerably from volcano to volcano, with volcanic activity and with tectonic setting. Water vapour is consistently the most abundant volcanic gas, normally comprising more than 60% of total emissions. Carbon dioxide typically accounts for 10 to 40% of emissions.” (my bold emphasis added) —source: https://en.wikipedia.org/wiki/Volcanic_gas#:~:text=10%20References-,Composition,methane%2C%20carbon%20monoxide%20and%20hydrogen.
Water vapor is a greenhouse gas, currently the predominant one in Earth’s atmosphere.
Thus, it becomes really hard to imagine—let alone argue from a starting position—that there ever was a condition on Earth with “no GHGs (just N2, O2 and a trace of Ar)”.
Note that a temperature of -109 °F (-78 °C) would be required to freeze CO2 out of the atmosphere . . . something never claimed or even realistically possible for “snowball Earth” conditions.
Obviously the hypothetical initial conditions are not close to the primeval reality; they are just for attribution purposes. The earth’s primordial atmosphere was almost all N2 and CO2, probably with some CH4 and NH3. It could never have been mostly water vapor as water vapor condenses out to the equilibrium partial pressure. We know there must have been lots of CO2 because of the amount of carbonate rock in the earth’s crust. We also know “snowball” conditions have prevailed from time to time, so it makes sense to analyze GHG temperature contributions on the hypothetical basis of that condition.
Roy, you posted: “It could never have been mostly water vapor as water vapor condenses out to the equilibrium partial pressure.”
That is absolutely incorrect.
Today we commonly have pre-condensation (99.9% relative humidity) water vapor at atmospheric pressures in the range of 15 to 10 psia, despite the “equilibrium partial pressure” of water vapor above liquid water (at 14.7 psia/77 °F) being only 0.46 psia.
Condensation, at any given pressure, is determined by the temperature of the vapor in question.
“Collisions between Earth and rocky debris in the early solar system would have kept the surface molten and surface temperatures blistering. Image courtesy NASA. Even after collisions stopped, and the planet had tens of millions of years to cool, surface temperatures were likely more than 400° Fahrenheit.”—source: https://www.climate.gov/news-features/climate-qa/whats-hottest-earths-ever-been
That being so, if we conservatively assume lower atmospheric temperatures were above 300 °F for surface temperatures of 400 °F, it would have been impossible for water vapor to “condense out” (your phrase) at atmospheric pressures below 67 psia. There is zero evidence that atmospheric pressure was ever that high at any time in Earth’s history.
Gordon Dressler wrote: “That is absolutely incorrect.”
Oh, dear…
“Today we commonly have pre-condensation (99.9% relative humidity) water vapor at atmospheric pressures in the range of 15 to 10 psia, despite the “equilibrium partial pressure” of water vapor above liquid water (at 14.7 psia/77 °F) being only 0.46 psia.”
Not sure what you think that means. “99.9% relative humidity” does not mean that 99.9% of the air is water vapor.
“Condensation, at any given pressure, is determined by the temperature of the vapor in question.”
Yes, temperature is a parameter of the equilibrium partial pressure.
“Collisions between Earth and rocky debris in the early solar system would have kept the surface molten and surface temperatures blistering. Image courtesy NASA. Even after collisions stopped, and the planet had tens of millions of years to cool, surface temperatures were likely more than 400° Fahrenheit.”—source: https://www.climate.gov/news-features/climate-qa/whats-hottest-earths-ever-been
That being so, if we conservatively assume lower atmospheric temperatures were above 300 °F for surface temperatures of 400 °F, it would have been impossible for water vapor to “condense out” (your phrase) at atmospheric pressures below 67 psia. There is zero evidence that atmospheric pressure was ever that high at any time in Earth’s history.”
If you are talking about the very earliest conditions in the earth’s atmosphere, CO2, CH4, N2, NH3 and Ne were also present in large enough quantities to exceed water vapor. In addition, you seem to have missed the fact that if the water now in the oceans was then in vapor form, that vapor pressure alone would be a large multiple of 67 psia. Water is basically unique in that it condenses at such high temperature relative to volatiles of similar molecular weight. That is why water vapor can never have constituted the majority of the earth’s atmosphere: if the atmosphere were that thick, water’s own vapor pressure would condense it out before any other gas.
Mr Langston finds it “problematic” that 255 is approximately equal to 25 x 10. Well, that’s mathematics. He had asked me why I had said that emission temperature was 25 times the direct warming by (or reference sensitivity to preindustrial noncondensing greenhouse gases. Now, when I tell him, he finds that surely elementary arithmetic “problematic”.
He also imagines that without noncondensing greenhouse gases the Earth would be an iceball. In this, he is at odds at once with mainstream science and with elementary arithmetic.
Assume ad argumentum an initially icebound Equator. The noonday surface temperature at the subsolar point would be [S (1 – a) / sigma] ^ 0.25 for total solar irradiance S = 1363.5, ice-albedo 0.7, the Stefan-Boltzmann constant sigma = 0.000000056704 Watts per square meter per (Kelvin to the fourth power). It is thus 331.15 K, or 58 Celsius degrees. So the ice would melt.
Then the albedo would fall to 0.06, the value for open water under direct sunlight. So the noonday surface temperature would rise to 387.74 K, or about 151 C. Were it not for conduction of the heat to neighboring seawater and convection to the atmosphere, the ocean would boil. The conduction, however, would melt still more of the ice until, even if there were no convection, the entire tropics would become ice-free. The global emission temperature would at that point be somewhere between 265 K (my estimate) and 274 K (Professor Lindzen’s estimate). This is known among climatologists as a waterbelt Earth (it used to be called a slushball, but that was not reverential enough).
Meanwhile, the convection, via evapotranspiration, would put ever-larger amounts of water vapor (a greenhouse gas) into the atmosphere, so that the water-vapor feedback would commence, vigorously. At the same time there would be an enormous ice-albedo feedback, so that, even in the absence of noncondensing greenhouse gases, the water-vapor and ice-albedo feedbacks would warm the Earth still further until the surface temperature was only 8-10 K below that which prevailed in 1850, leaving little or no room for net-positive feedback under anything like modern conditions.
That is why we were not surprised when we gathered all the latest data for anthropogenic forcing and energy imbalance in the industrial era and discovered that, at midrange, feedback is actually a little net-negative: the unit feedback response is -0.06.
And of course one cannot do these calculations in Celsius, as Mr Langston tries to do. That is an elementary error.
As already noted, the problematic part of Lord Monckton’s comparison of absolute temperature to temperature increase is the logic, not the arithmetic. It makes no more sense than comparing the Kelvin temperature in a hospital room to a patient’s fever measured in Kelvins.
Unfortunately, his logic is little better in his “analysis” of the heat regime of a snowball earth without non-condensing GHGs. First he ignores the fact that ice is transparent, and the 30% of incident solar radiation that is not reflected by ice penetrates rather than being absorbed at and heating the surface, as it would a layer of equally white but opaque paper. Second, he ignores the latent heat of fusion, which requires a much larger heat input before the ice could melt. Third, he ignores the fact that night follows day, so absent other GHGs, any water vapor released from a melted ice surface would quickly condense out again after sunset, and the water refreeze, through unimpeded loss of IR radiation to the ~3K cold of outer space. Fourth, he ignores the fact that open water is even more transparent than ice, and the 94% of incident sunlight it absorbs is distributed over a depth of many meters rather than raising the temperature of only the top millimeter to more than boiling. Fifth, he ignores the fact that ACTUAL ice close to the equator but at low temperature and lacking a thick atmospheric blanket of GHGs, such as the Chimborazo Glacier, does not in fact melt (never mind evaporate) in the daytime, let alone stay liquid at night.
The Romans discovered that they could make ice even in summertime in the Sahara desert because there is so little water vapor in the air that it gets that cold at night. They would cover a large flat area with a meter of straw just before dawn, then uncover it after sunset. After several days of this treatment, the ground in the middle of the covered area was so cold that a bowl of water left there overnight would freeze solid through infrared radiative heat loss. And that’s WITH ~280ppm of CO2 in the air. The idea that daytime sunlight and water vapor alone could overcome the nighttime loss of heat by unimpeded IR radiation to outer space in the absence of non-condensing GHGs does not hold up to actual scientific scrutiny.
Roy Langston posted: “. . . any water vapor released from a melted ice surface would quickly condense out again after sunset . . .”, thereby implying that there can never be nighttime clouds in Earth’s atmosphere. The phrase “condense out” taken logically to mean “fall as precipitation”.
I think personal observation is sufficient to show the fallacy in this statement.
As Nobel prize-winning physicist Richard Feynman advised:
“If it disagrees with experiment (observation), it’s wrong. In that simple statement is the key to science. It doesn’t make a difference how beautiful your guess is. It doesn’t make a difference how smart you are, who made the guess, or what his name is. If it disagrees with experiment, it’s wrong. That’s all there is to it.”
Mr Dressler is confused. The statement he quotes was about a snowball earth without non-condensing GHGs, not the earth as it is.
Roy Langston posted; “The idea that daytime sunlight and water vapor alone could overcome the nighttime loss of heat by unimpeded IR radiation to outer space in the absence of non-condensing GHGs does not hold up to actual scientific scrutiny.” (my bold emphasis added)
Well, it is a fact that that CO2, a non-condensing greenhouse gas does NOT disappear from Earth’s atmosphere at night and thus it continuously impedes IR radiation from Earth’s surface. There is simply no such thing as the absence of non-condensing greenhouse gases.
So, yes, it is true that that part of Roy’s post does not hold up to scientific scrutiny.
As to sunlight and water vapor alone overcoming “nighttime loss of heat”, that certainly appears to be false since Earth’s energy inflow is nearly totally balanced by Earth’s energy outflow, giving us the yearly-averaged, essentially-constant surface temperatures that we currently enjoy, and have enjoyed for the last 100 years of so.
Mr Dressler is confused again. The passage he quotes refers to a HYPOTHETICAL snowball earth without non-condensing GHGs, not the actual earth, as a way to analyze the effect of CO2 on temperature. No one seems to want to address or even consider my actual point: that the assumption of high ECS in typical climate models assumes a constant logarithmic response based on extremely (indeed absurdly) high water vapor feedback, when it is quite likely that the response is much greater at a much lower level of CO2 where a runaway positive water vapor feedback effect is triggered. But that feedback loop is limited by the declining ability of sunlight to melt ice and warm sea water at high latitude; ECS may consequently now be very low, corresponding to the relatively shallow slope at the end of a sigmoid curve.
A good analysis.
Your servant, m’lord.
Nice try, but there is a substantial literature on conditions at emission temperature. There is widespread support for the notion of what is now called a waterbelt Earth.
Besides, emission temperature may be as great as 274 K.
In any event, it is inappropriate for official climatology to imagine that because the unit feedback response averaged over the entire interval between emission and 1850 temperature is imagined to have a certain value something like that value will obtain today.
In his desperation to find fault, he suggests I had made no allowance for conduction of heat to neighbouring seawater, when I had expressly done so.
Sorry, this thread has gotten out of sequence.
But let us make matters simpler. Even if the planet were frozen solid until the preindustrial noncondensing greenhouse gases came along, the moment the feedback processes commenced they were necessarily responding not only to the reference sensitivity forced by those gases but also to emission temperature itself – and chiefly to the latter.
Again, the attribution analysis is not based on actual conditions because there was never a time when CO2 was below about 200ppm.
You wrote: “In any event, it is inappropriate for official climatology to imagine that because the unit feedback response averaged over the entire interval between emission and 1850 temperature is imagined to have a certain value something like that value will obtain today.”
It’s actually much worse than that. The officially approved estimate of positive water vapor feedback is not based on the 1850 temperature but on the presumed snowball earth temperature with no CO2 — and because it is presumed to have been so cold, no water vapor. I have explained why this assumption is likely to be wildly wrong under modern conditions: an unrepeatable runaway water vapor feedback that can only be triggered at a much lower temperature.
The emission temperature is a bit of a red herring because we know what it has to be to balance insolation based on the Stefan-Boltzmann equation. The key factor is rather the effective emission altitude. Adding CO2 increases the effective emission altitude and reduces the effective temperature, moving to a new equilibrium. But this new equilibrium cannot propagate any significant temperature increase back down to the surface because there is too much water vapor in the lower troposphere blocking the downward IR radiation: i.e., what happens in the upper troposphere stays in the upper troposphere.
Conduction of heat in seawater is also a red herring: the error is in the assumption that initial absorption is at the surface rather than distributed downward according to the usual logarithmic decay function.
La Niña will persist because the turning wave is weak.
http://www.bom.gov.au/archive/oceanography/ocean_anals/IDYOC007/IDYOC007.202103.gif
There is a noticeable decrease in Pacific temperature at 150 m depth compared to the winter months.
http://www.bom.gov.au/archive/oceanography/ocean_anals/IDYOC006/IDYOC006.202103.gif
To paraphrase Ronald Reagan, here we go again with the Arrhenius equation, which assumes that the radiative forcing due to a doubling of CO2 concentration is constant (dQ2 in the development above).
Zelinka might have calculated dQ2 = 3.52 W/m2 for a doubling from some baseline Co to 2*Co, but there is no assurance that going from 2*Co to 4*Co would result in the same dQ2.
As CO2 concentration increases, there is less and less IR radiation left (out of the initial IR emitted) for the additional CO2 to absorb. At some wavelengths, most of the IR radiation is absorbed by water vapor, with very little left for CO2 to absorb anyway.
The actual amount of IR radiation absorbed by CO2 in the atmosphere (assuming clear skies) follows de Beer’s law, of the form
dQ2 (z) = K Io [1 – exp(-ACz)]
where K is a constant
Io = intensity of emitted radiation from the earth’s surface (a function of temperature and wavelength
A = absorption coefficient, a function of wavelength
C = CO2 concentration
z = altitude
What happens to sensitivity depends on where the CO2 concentration is for the given wavelength.
For a wavelength with weak CO2 absorption, suppose ACz = 0.25 at present, for which dQ2 = 0.2212 K*Io. If C is doubled so that ACz = 0.5, the total heat absorbed is 0.3935 K*Io, so that doubling the CO2 concentration resulted in an increase in dQ2 of 0.1723 K*Io.
If C is re-doubled so that ACz = 1.0, the total heat absorbed is 0.6321 K*Io, so that the second doubling resulted in an increase in dQ2 of 0.2386 K*Io.
If C is doubled again so that ACz = 2.0, the total heat absorbed is 0.8647 K*Io, so that the third doubling resulted in an increase in dQ2 of 0.2326 K*Io.
If C is doubled again so that ACz = 4.0, the total heat absorbed is 0.98168 K*Io, so that the fourth doubling resulted in an increase in dQ2 of 0.1270 K*Io.
If C is doubled again so that ACz = 8.0, the total heat absorbed is 0.99967 K*Io, so that the fifth doubling resulted in an increase in dQ2 of 0.01799 K*Io.
If C is doubled again so that ACz = 16, the total heat absorbed is 0.999999887 K*Io, so that the sixth doubling resulted in an increase in dQ2 of 0.00033 K*Io.
Any further doublings beyond ACz = 16 would result in extremely small increases in dQ2, since the total heat absorbed cannot exceed K*Io.
The “sensitivity”, or change in heat absorption due to a doubling in CO2 concentrations, is roughly constant only for values of ACz between 0.5 and 2.0. For high values of the absorption coefficient, the “sensitivity” drops off rapidly with CO2 concentration, becoming essentially zero for ACz > 8.0.
However, it is at wavelengths with high absorption coefficients where the most IR energy is currently absorbed by CO2, so that adding more CO2 doesn’t absorb much additional energy (it only lowers the altitude at which the same energy is absorbed).
At wavelengths with lower absorption coefficients, sensitivity remains relatively constant, but the baseline energy absorbed at current CO2 concentrations is a small fraction of the total, and may also be reduced because some of the energy is already absorbed by water vapor, whose concentration tends to be about 10,000 to 20,000 ppm above tropical oceans.
The only correct way to calculate the true dependence of warming on CO2 concentration (dQ2 / dC) would be to integrate the above equation over wavelength, taking into account the variation of A (CO2 absorption spectrum) and Io (Planck function) as a function of wavelength, and subtract out water-vapor interference as a function of wavelength.
Of course, this would also depend on surface temperature and humidity, so we would then have to integrate over the Earth’s surface.
This becomes very complicated, but the point is, “sensitivity” to a doubling of CO2 concentration is NOT constant–it tends to decrease rapidly at higher CO2 concentrations. Physically, this is due to the “saturation” of the atmosphere, to the point where there is no additional IR energy at high-absorbing wavelengths left to be absorbed.
So, if the current “sensitivity” is about 1.0 C (for example, from 400 to 800 ppm), how much less would it be from 800 to 1600 ppm? If the “sensitivity” falls off rapidly with CO2 concentration, perhaps we will NEVER get to 2.0 C total warming, no matter how much CO2 is in the air.
Steve Z has missed the subtlety of the calculation of ECS in the head posting. Since the difference between the surface temperature in 1850 and at equilibrium following a forcing equivalent to doubled CO2 compared with 2020 is only a couple of degrees, any nonlinearity in the system will have very little effect on ECS. And we are not concerned with what might happen after two rather than one doublings compared with 2020, for two reasons. First, the supply of affordably accessible coal, oil and gas is finite; secondly, at any commercially viable intertemporal discount rate it is not worth doing anything about global warming that will arise more than 30 years from now.
Shouldn’t the CETS trend be computed with equal months at both ends, eg, Jan 1979 – Jan 2021?
If not, there is a warming bias with one additional cold month on the left side.
No: the linear trend is not derived solely from the endpoints, but from every month in the interval of interest.
This pause is just statistical noise. The El-Nino of 2015-2016 raised global temperatures for a year to about 0.5 degrees above the long term average. The current UAH linear trend is 0.14 degrees/ decade meaning it is likely to take several decades before Mr. Monckton will stop posting about the pause despite ongoing slow and steady global warming during that time. Exactly the same nonsense occured after the large El-Nino in 1998.
In contrast if you look at ocean heat content there is no pause, nor was there one after 1998. There is just a steady rise in temperature.
Where do you see this “steady rise in temperature”? It seems to me that it is very unsteady. Compare the UAH troposphere anomalies in the US (48) in January (0,36) and February 2021 (-0,66). Or do you see this steady temperature rise at the equator, or in Australia?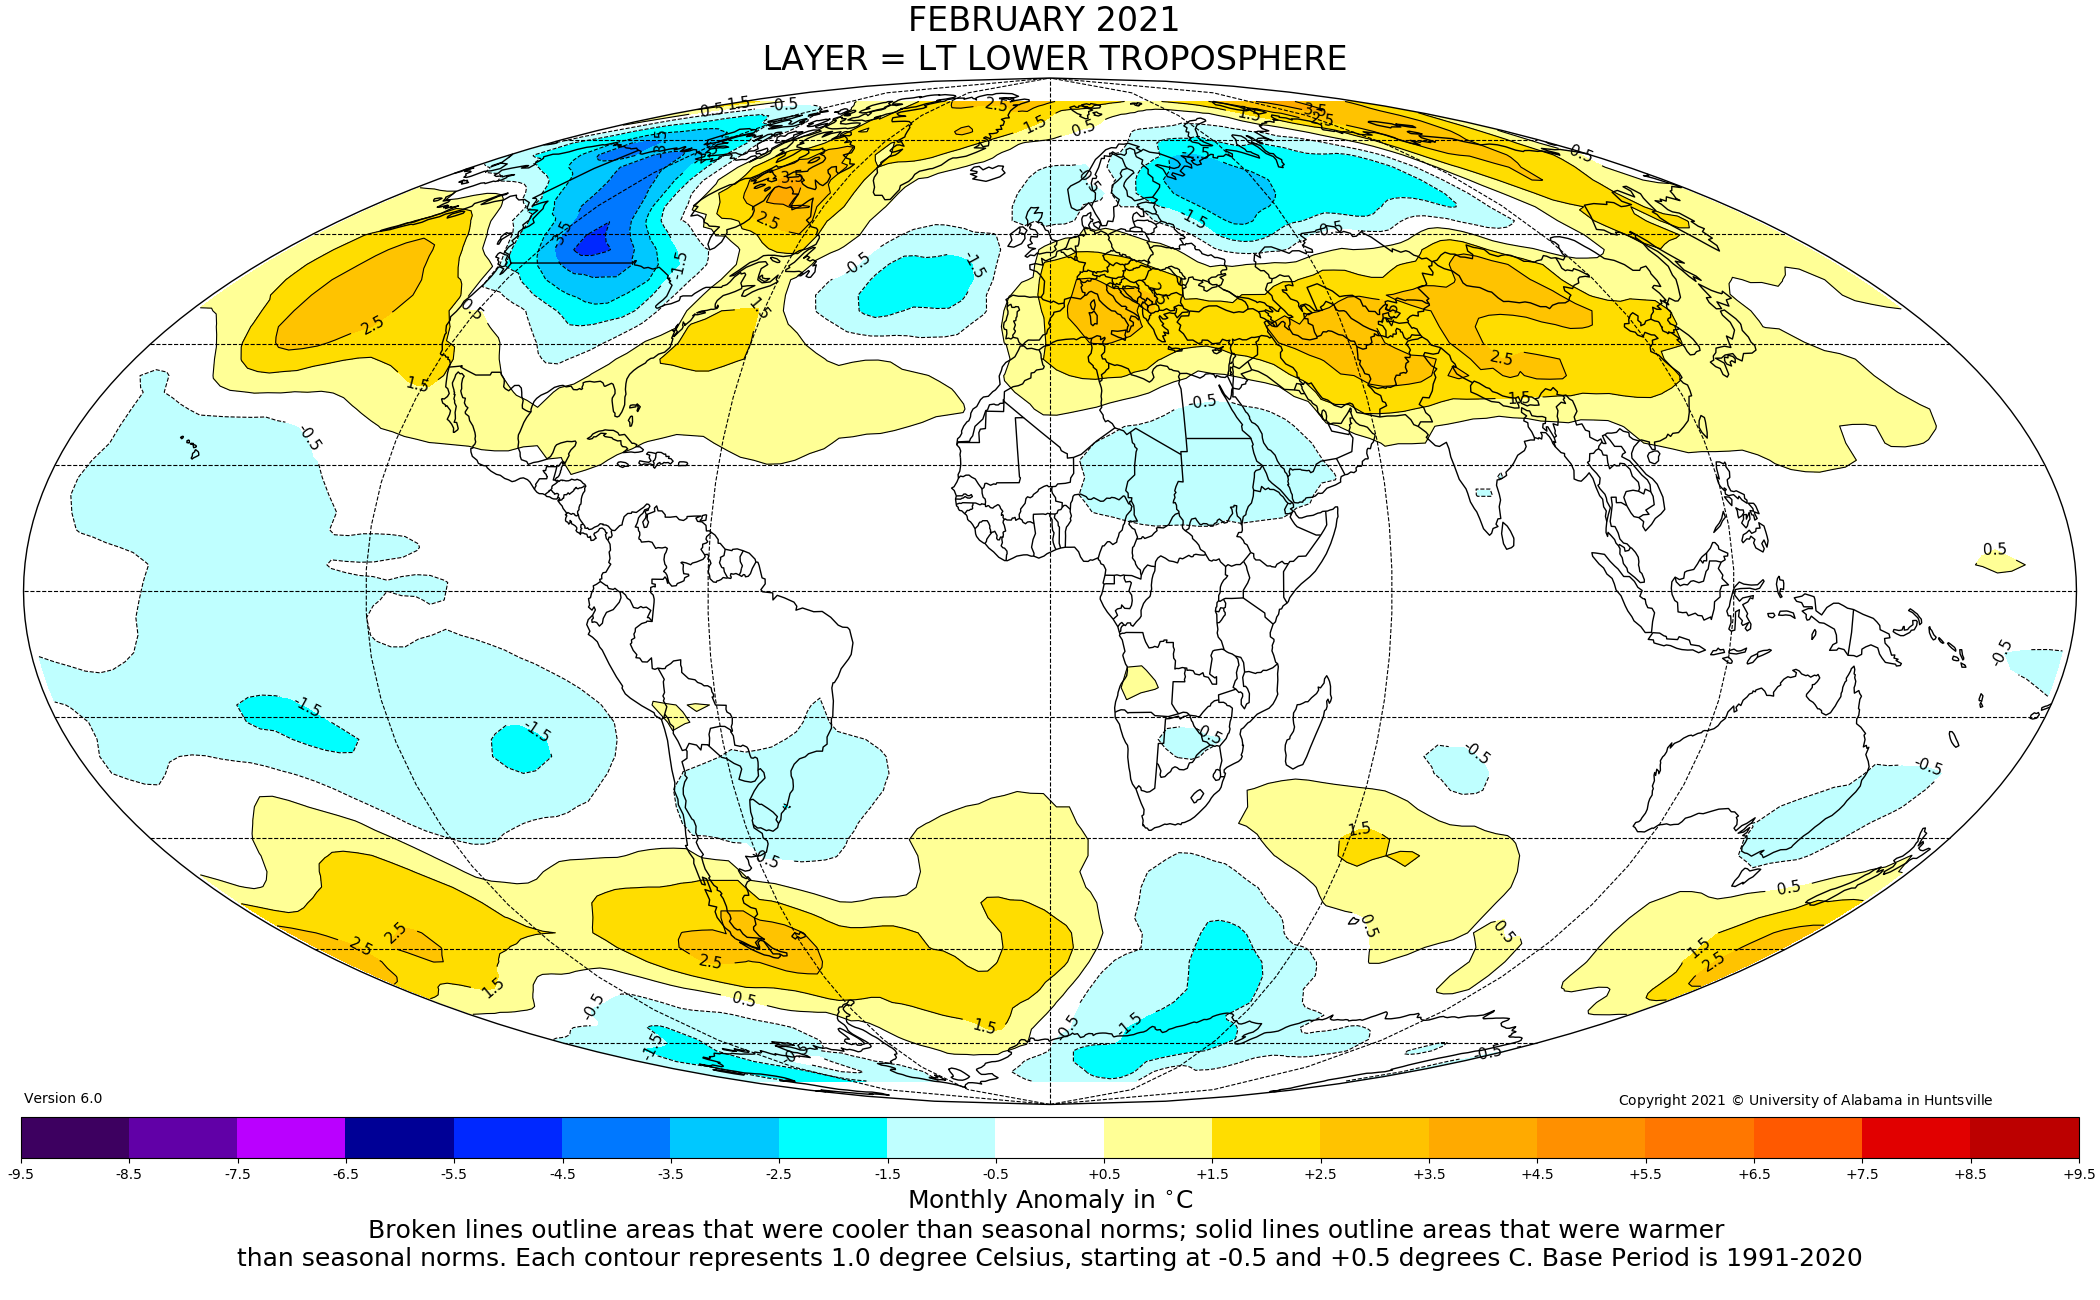
Do you think a decrease in ocean surface temperature at the equator will raise global temperature?
UAH shows that temperature trends in the troposphere are unstable.
The troposphere temperature distribution in the UAH diagram shows the importance of the Earth being closest to the Sun during winter in the Northern Hemisphere. At the same time, warmer oceans in the northern hemisphere in winter provide more snowfall.
http://globalcryospherewatch.org/state_of_cryo/snow/fmi_swe_tracker.jpg
Izaak Walton has missed the point. Long Pauses with occasional el-Nino-driven sharp increases in temperature indicate an overall warming rate which (whether steady or not, for in truth we do not have enough observational capacity to know what is going on in the oceans, even with the ARGO network) is between one-third and one-half of the originally-predicted rate.
Monckton of Brenchley
A few years or perhaps decades of change in total solar radiation will cause ocean temperatures to drop.
Monckton of Brenchley
“… an overall warming rate which… is between one-third and one-half of the originally-predicted rate.”
_______________
Which prediction was this please? IPCC AR4 (2007) stated “For the next two decades, a warming of about 0.2°C per decade is projected for a range of SRES emission scenarios.” https://archive.ipcc.ch/publications_and_data/ar4/wg1/en/spmsspm-projections-of.html
The rate of warming in UAH since 2007 is currently +0.32 C per decade. Temperatures in UAH would need to fall between now and 2027 in order for the 2007 IPCC projection not to be wrong on the cool side.
IPCC’s original prediction was, of course, the prediction in its 1990 First Assessment Report.
A prediction which is spot on…
https://www.carbonbrief.org/analysis-how-well-have-climate-models-projected-global-warming
With the February data, the Pause in the RSS set is identical in length to that of UAH, starting in August 2015, though it is cooling at a slightly faster 0.26°C / century.
Main point is that a trend over a few years is not a very useful way of determining the overall warming rate. UAH is warming slowest, RSS fastest, yet both have identical “pauses”.
Bellman is well paid to whine, but his paymasters, who are not getting value for money, no doubt realise that long pauses are the inconvenient truth that climate extremists most fear. Foe it is clear from the industrial-era record to date that not much more than 1 degree of warming is to be expected this century – not enough to worry about.
does 1 degree Celsius make a difference in your body temperature? it is only ~3% of your average temperature…
an average annual global value of 1 degree means higher values over certain locations and shorter periods, did that cross your mind? Do you think people living in locations with temperatures reaching 50 degrees are happy?
What are your credentials again? Why should anyone take you seriously when you make such claims having no proper education?
The fact that you’ll be dead before climate change will have severe impacts on our lives justifies your position to say whatever rubbish you want. Scientists have ethics and don’t think in this stupid way as you. So what if (I’m humoring you here, I know you are wrong) you are wrong? Will you apologize? Or are you willing to have all that suffering in your hands?
Which brings me to another thing, you have claimed there is no scientific consensus about AGW. This is a rubbish statement proven wrong. Have you apologized for this lie?
“…long pauses are the inconvenient truth that climate extremists most fear.”
How long does a pause have to be before it’s considered long enough to be feared?
Does it worry you that whilst CET 1694-1733 was the fastest warming 40 year period in the record, that 40 year period contains a pause lasting 24 years?
Bellman:
The long “pause” in in the CET 1694-1733 period was due the absence of VEI4 and higher volcanic eruptions. The resultant cleaner air allowed sunshine to strike the Earth’s surface with greater intensity,causing increased warming.
Any pause in such eruptions greater than ~ 3 years will cause a temperature increase, and many instances can be found in the CET record..
,
With February’s data, GISTEMP’s “pause” now starts in May 2015, making it 5 years and 10 months old.
(Sits back and waits for another cheque to drop through the letterbox.)
So many years and you still do the same kind of rubbish…
Cherry picking data to show a so-called pause is meaningless and you obviously know it
Mr Reyman should perhaps get his Kindergarten mistress to explain that long pauses tend to indicate slower global warming than predicted.
Let me be clear. There are many factors affecting climate. Sun (please argue that it is only the sun.. it will be fun), volcanoes (not even you can argue it’s only volcanoes..), humans are just some of the major ones. Not all of those influences have the tendency to cause warming (or even warming everywhere), but they cause also cooling. Volcanoes for instance cause cooling…
Then there is El nino and La nina…
Not all of those have the same effect, some are short term others long term, semi-periodic etc etc. So you can find combinations of the above that over short periods it might seemingly appear there is no warming, but that doesn’t mean CO2 did not contribute to warming, only that the cooling factors played a very important factor over that period. The long term trend, I’m sorry to tell you, is a mean global annual temperature increase, which you show in your plots too.. but then choose to focus on the last 6 years.
To argue that there is a 6 year(!) pause in global warming is ignorant beyond belief.
What if I choose to focus between 2016-2019, very dishonest thing to do (like you are doing here…), but it would show a dramatic temperature increase. Obviously you won’t get this… I’m sure you’ve been told a million times before…
As for how well global warming has been predicted, maybe have a look at this one:
https://www.carbonbrief.org/analysis-how-well-have-climate-models-projected-global-warming
They don’t have your predictions in there, but how good have your prediction been?
Also you know that this is a scientific issue, this is discussed with peer-reviewed publications, which you know you have none and with your qualifications and “quality” of work, as the one presented here, you know you won’t be able to publish as it will not survive the scrutiny of actual scientists.
Why don’t you leave this to people that actually have the formal education and understanding of this topic?