Guest Post by Willis Eschenbach
Guest Post by Willis Eschenbach
mung
/mənj/ [pronounced “munge”]
verb
INFORMAL•COMPUTING
gerund or present participle: munging
to manipulate (data)
EXAMPLE: “you could do what anti-spammers have done for years and mung the URLs”
For more than a decade now, I’ve been wondering about a couple of questions.
First, why does the satellite-based sea-level data show that the sea level is rising so much faster than the rise measured at tidal stations on the coastlines around the world? Records from tidal stations show a rise on the order of a couple of mm per year, a rate which is little changed over the century or so for which we have adequate records. But the satellite record (Figure 1) shows a rise of 3.3 mm/year. Why the large difference?
Second, why does the satellite-based sea-level show such significant acceleration? As mentioned above, the sea-level records from tidal stations, which are much longer, show little or no acceleration. But the satellite record claims that the rate of sea-level rise is increasing by about a tenth of a millimeter per year. That amount of acceleration would double the rate of sea-level rise in about thirty years. Again, why the large difference?
To start with, here’s what the satellite data says, according to the University of Colorado Sea Level Research Group.

Figure 1. University of Colorado sea level data, showing the trend and acceleration. Note that the graph shows no overlap between the individual satellite records. SOURCE: UCSLR Group
I got to thinking about these questions again this week, so I went to NOAA and got their Excel spreadsheet showing the full dataset for each of the four satellites.
I plotted up the NOAA data. But unlike the Colorado data above, I included the full overlap between the individual satellites. I then looked at the rate of sea-level rise shown by each of the four satellites separately. Figure 2 shows that result.

Figure 2. NOAA sea level data, showing the trend of each of the full individual satellite records and the overall trend. SOURCE: NOAA Excel Spreadsheet
Well, go figure … seems like after all these many years of wondering, I finally have an answer to my two questions. The trend is so large and the acceleration is so great for a simple reason. The two most recent satellites show trends that are significantly larger than the earlier two satellites. The first two satellites agree quite well, but they both show a much smaller trend than the latter two satellites. And neither half of the satellite record shows any acceleration.
Now I freely admit, I’m just a guy with no scientific training at all. I took Physics 101, Chemistry 101, and one year of Calculus in college, and that’s it. But the beauty of science is that it’s all about the facts and the evidence, and not about the qualifications of the person presenting the facts. What you see above are the facts as given by NOAA, and I’ve linked to the source of those facts above. And it seems to me that those facts are more than sufficient to entirely discredit the satellite sea-level record.
So if you have an explanation for those facts, fine. But don’t bother busting me because you think I’m not qualified to present and discuss the facts. “The Captain”, my great-grandfather who was a Mississippi riverboat captain, used to say “If you have to hang your diploma on your living room wall, there was something wrong with your education”.
And to return to the issues at hand, why does the NOAA data show an overall trend which is 0.3 mm per year smaller than the Colorado data? It’s because the Colorado data contains what is called the “GIA”, and the NOAA data doesn’t.
“GIA” stands for the “glacial isostatic adjustment”. There’s a description of it on the Colorado site here. It relates to the changes in the earth’s overall shape due to the melting of the huge and immensely heavy ice sheets from the last glaciation.
According to that page, the GIA is “independently estimated from models at -0.3 mm/yr (Peltier, 2001, 2002, 2009; Peltier & Luthcke, 2009)”.
Now, I’ve been programming computers since 1963, coming up on 60 years now. As a result, I’m very aware that a computer model is nothing more than a physical realization of the beliefs, understandings, and in particular the misunderstandings of the person programming the computer. Since Mr. Peltier has been intimately involved in programming all four of the model realizations listed on the Colorado site, their claim that the four models are “independent” is laughable. What we have is one man’s claim that he can calculate the GIA.
What effect does the GIA have? The Colorado site says (emphasis mine):
Prior to release 2011_rel1, we did not account for GIA in estimates of the global mean sea level rate, but this correction is now scientifically well-understood and is applied to GMSL estimates by nearly all research groups around the world. Including the GIA correction has the effect of increasing previous estimates of the global mean sea level rate by 0.3 mm/yr.
So there’s the missing 0.3 mm/year, applied by “nearly all research groups” … I guess NOAA didn’t get the memo.
For me, the claim that a computer model can calculate the changing of the total volumes of all of the world’s various ocean basins to the nearest 0.3 mm per year of sea level … well, let me just say that it strains credulity far beyond the breaking point and leave it at that. Here’s why.
For the land portion of the calculation, these “independent” computer models must be using GPS altitudes. By using split-phase GPS and repeated measurements, these can be as accurate as ± 10 mm or better, an amazing scientific feat … but that’s a far cry from a tenth of a millimetre, and that’s just on land. Not only that, but we don’t have GPS measurements all over the land. They’re concentrated in the US and Europe, with only spotty coverage elsewhere.
At sea, the “independent” models must be using satellite measurements, so we get into the question of the accuracy and precision of the satellite sea level measurements themselves. These measurements are done by bouncing radar waves off of the ocean surface and measuring how long it takes them to return to the satellite. Here, repeated measurements are not possible because the sea level at any point changes constantly, and the satellite is rarely in the same position twice. A recent NASA press release describing the Sentinel-6 satellite, the successor to the Jason-3 satellite, quotes the oceanographer Josh Willis:
Sentinel-6 will orbit about 800 miles up and use radar to measure the surface of the ocean. An instrument on the satellite sends a radar wave down to Earth. The radar bounces off the surface of the ocean and returns to the satellite. By measuring how long it took for the radar to go down and back — and accounting for moisture in the atmosphere which slows the radar down — scientists can measure how far away the surface of the ocean is from the satellite.
In other words, the satellite can tell scientists on Earth how high the oceans are, and how that height is changing over time.
“It’s really kind of an incredible feat of technology,” [Josh] Willis says. “We can accurately measure the water level with an accuracy of 1 inch from 800 miles up.”
An accuracy of 1 inch, that’s 25.4 mm … and they’re claiming they know the annual change in the volume of the oceans from the GIA to the nearest tenth of an mm of sea level height? I know that accuracy is different from precision, and that measurement of changes in length over time (precision) can be an order of magnitude better than the measurements of the length itself (accuracy), but still … sorry, but I’m not buying the GIA claim.
Let me see if I can give you a sense of the difficulty of the satellite measurements of sea level. The satellites orbit at an altitude of about 830 miles, which is about 1.34 billion millimetres. So to measure the change in sea level to the nearest tenth of an mm, we’d need to be able to measure the distance from the satellite to the sea surface to a precision greater than one part in thirteen billion … and that is a hard challenge even in a controlled laboratory setting.
Here are some of the difficulties in that measurement. First is the measurement of the altitude of the satellite itself. Unless we know that to the nearest mm or so for every second of every day, we’re going to get inaccurate answers. Next is the varying composition, temperature, cloudiness, and humidity of the atmosphere. All of these change the time it takes the radar signal to return to the satellite. Then there are the ocean waves, which obviously change the height of the ocean by thousands of mm. Finally, there is “instrument drift”, the inevitable changes that occur to electronic measuring instruments over time.
Net result? Well, the net result can be seen in Figure 2 above, where according to the University of Colorado one satellite says the sea level is rising at 2.5 mm/year, and a mere 8 days after the end of that satellite’s data (the interval between one satellite and the next in the Colorado sea-level record) the successor satellite says it is rising at 4.1 mm/year … no bueno. They’re claiming that in 8 days, the rate of rise jumped by 1.6 mm per year. Note also that there is absolutely no acceleration in either half of the satellite record, just a step-change between satellites. Clearly, they’re not able to measure annual sea-level changes to the nearest millimetre, much less to the nearest tenth of a millimetre.
However, the people working on the project are all true believers. In the same article, Josh Willis is quoted as saying “We know that the oceans are rising because of human-caused interference with the climate.”
Dang humans, always interfering with the climate … for example, our new “Climate Czar”, John Kerry, has 5 houses, a number of cars, a yacht, and a private jet, and he tells us to take the bus to avoid the dreaded “human-caused interference with the climate” … but I digress.
The problem is that starting out with a fixed “scientific” belief like that leads to the people working on the satellite sea-level datasets splicing together what are obviously incompatible satellite results, spreading peanut butter over the cracks so they can’t be seen, and announcing to the world that the satellites show a dangerous acceleration in sea-level rise, so we should all be very worried …
Me, I’ve said for some time that we shouldn’t put any weight on the satellite results. However, I have based this solely on the very large differences in both trend and acceleration between the satellite and the tidal station records, and the known difficulties in satellite measurements discussed above. I investigated this question in several posts, including “Inside The Acceleration Factory” and “Accelerating The Acceleration“
But now, at long last, I have the facts to back up my claim. There’s no evidence of any acceleration in the rate of sea-level rise in either the tide gauge or the shabbily-spliced satellite records. It’s been going up at on the order of eight inches (200 mm) per century for quite some time, and there’s no sign of any change in that rate of rise.
So you’re free to do what Obama and Bill Gates have done—buy seaside property. They proclaim loudly that the sea level is rising dangerously, but like the majority of climate alarmists, their actions belie their words.
My very best wishes to everyone in these most strange of times,
w.
PS—My usual request. To avoid misunderstandings, please quote the exact words you are discussing. I can defend my words, but I cannot defend your understanding of my words.
PPS—My post linked to above, “Accelerating The Acceleration“, earned me a laughable “fact-check” on Facebook by some well-meaning folks who were apparently short on cranial horsepower … now that Facebook has announced it’s taking over as the global arbiter of scientific truth, we’ll see what happens to this post.
Willis at these most strange of times Oceania is no longer at war with Eurasia. We are now at war with Eastasia. It is important to note that we have always been at war with Eastasia. You can consult Facebook to confirm.
May a rat chew-off your nose in Room 101.
1984 version of cancel culture.
Willis
Thanks for the article.
The first thing that struck me was the willingness to do a quadratic fit for 30 years of data.
Maybe alarmists can provide a similar quadratic fit for, the last century of CO2, Temperature, and SLR. On the one graph would be nice.
Why the discrepancy?
I just assumed it was due to scientific fraud.
The on-going climate scam is like observing a magician’s magic trick as a child in awe versus understanding as an adult how the sleight of hand maneuvers are being made to pull off the deception.
And then having to do that unraveling for the dozens of different deceptions that are being employed, deceptions from what is going on with SLR claims to instrumental temperatures-derived anomalies to dozens of supercomputer models. All an elaborate fraud on the public. But when Trillions of dollars are at stake, one can see the motivations.
There was a neat analogy like your magic trick in the climate blogs the other day.
“The bull in the ring sees only the red cape, not the man behind it with the sword.”
Cannot find it again to attribute. The original had some Spanish in it.
There is a lot of this going on, two different mind sets, one viewing measurements and deductions, the other viewing beliefs and imagination. Geoff S
That would be a good assumption.
“But the satellite record claims that the rate of sea-level rise is increasing by about a tenth of an mm per year.” In listening to NOAA weather radio for coastal Texas blizzard data, I got a lot of information about local sea levels to two decimal places, possibly my cold brain.
All sea level modelers must first measure sea level from a real ocean vessel, let them have a calm sea even, also view of coastal tide gauge, I’ll wage that their error will be much greater than they model by at least an order of magnitude. Where did they learn about significant figures?
As is usual I went for my morning beach swim here in Perth (Western Australia), beautiful morning including a dolphin in the waves less than 4m away. Light to moderate offshore breeze as is common this time of year with a small maybe 0.8-1.0m swell. The “ruffle” from the offshore was probably of the order of 5cm and with that small swell can you tell me a satellite that many km above can estimate the sea-level to mm, what about in the afternoon when we get our famous sea breeze where the “ruffle” can be greater than the swell.
As Darryl would have said ” Tell him he’s dreamin’ “
From what I’ve been reading there was a steric sea level rise do to the recent very strong El Nino, but since sea level has barely budged in over a year, both NASA and the Univ. of Colorado have stopped updating their graphs. The Univ. of Colorado once said they would update their graph every 10 days, but haven’t updated it for at least 2 months. NASA hasn’t updated theirs since Sep 2020. Ten days is the time it takes to cover the whole Earth once.
https://climate.nasa.gov/vital-signs/sea-level/
FH, overall ocean steric rise should not be much affected by Nino/Nina. Those are just where the warm water pool is, western or eastern equatorial Pacific. Will affect local tide gauges, but not the overall Pacific let alone all oceans.
The great and mighty Government Con kills those that bring bad news.
Willis,
I am very concerned that your continued posting will have the modern day Torquemadas howling for your blood! Please exercise extreme caution and be wary of anyone offering to BBQ some steaks for you; check their spelling!
What a joy it is to have a site with such informative authors and interesting, albeit sometimes snarky, commenters; it makes dealing with the griffters and trolls bearable!
Nice post, WE. For those interested, I have posted concerning satalt—fit for purpose? examining specificallyJason 3, and separately on its new replacement Sentinal-6, and separately on the lack of observational acceleration. These issues and more were also covered years earlier in essay PseudoPrecision in ebook Blowing Smoke.
There is a second way to prove the satalt SLR ismunged. Closure is the idea that SLR must close with thermosteric rise (calculable from ARGO) and ice mass loss, calculable from satellites ICESat and GRACE. (Other contributions are negligible, see PseudoPrecision for some laughable attempts to claim they are not. Closure is about 2.2-2.3mm/year, nowhere near satalt. Covered the specifics here in guest post Sea Level Rise, Acceleration, and Closure a while back.
I believe the GIA adjustments around 2011 and the Univ. of Colorado openly stated that it was done to measure change in sea volume, not sea level.
Judith Curry has written about this here:
https://judithcurry.com/2018/06/23/sea-level-rise-isostatic-adjustment/
Don’t forget that the precision of the instruments on those satellites is on the order of centimeters. For Jason-3 it’s about 4 cm. That’s 40 mm. And yet they claim to measure sea level trends to a tenth of a millimeter, three orders of magnitude more precision than the instruments can measure.
There are three kinds of lies: lies, damned lies, and statistics. You can see from the Jason data why climate alarmists love statistics.
2 orders of magnitude, not 3. It’s still an absurd claim.
Both you and stinkerp don’t understand the difference between precision and accuracy.
You keep using those words, but you so obviously don’t know what they mean.
An instrument that is calibrated to measure to a tenth of a millimeter is more precise than one that can measure only to a centimeter (100 tenths of a millimeter). Taking hundreds of thousands of measurements from both instruments and averaging them will show that the one with greater precision greatly improves accuracy. When the error range is a hundred times larger than the precision you claim, you’re doing voodoo, not science.
Average sea level rise of 3.3 mm/yr ±0.4mm is laughable coming from instruments that can’t measure any more precisely than 40mm. It should be 3.3 mm/yr
±40mm but then everyone would be in on the joke.
That 4cm EITHER WAY,
When you are pretending to measure in mm, that is like having a target on the side of a barn.. and mostly missing the barn.
Neither accurate, nor precise.
More like RANDOM CHANCE.
I have to agree with Brian Jackson on this one, you got them reversed. Accuracy is a statement of how far off the real value the measurement is and precision is how much the measurement varies when repeatedly measuring the same value. Accuracy is generally limited by physical characteristics of the measurement device, for example an analog to digital converter has only so many bits with which to represent the measurement (usually a voltage). Precision is basically the noise/error in the system and generally is the combination of the tolerance of all the parts in the measurement system.
Think of it this way, when throwing darts, how close you get to the center is your accuracy. The spread of all your throws is your precision.
All good but you have to remember that the overall error of the instrument calibration needs to be factored into the multitude of measurements as it just doesn’t go away.
“Accuracy is the closeness of agreement between a measured value and a true or accepted value. Measurement error is the amount of inaccuracy.
Precision is a measure of how well a result can be determined (without reference to a theoretical or true value). It is the degree of consistency and agreement among independent measurements of the same quantity; also the reliability or reproducibility of the result.
The uncertainty estimate associated with a measurement should account for both the accuracy and precision of the measurement.” (From the College Physics Labs – Mechanics UNC Chapel Hill)
My crews use GPS for measuring both horizontally and vertically. To get a really good reading they will let it cook for a period of time over the point being measured. We also will use a GPS network and/or a base station to improve accuracy. Doing all that makes the horizontal location nice and tight but the vertical is still +/- 0.1 feet. Really don’t see how their satellite is more accurate that a group of GPS satellites, networks and base stations.
We do construction staking and never use GPS for vertical staking only hard elevations run with a precision level from a known benchmark. The graders do a good job grading the dirt with GPS but then our tolerance for acceptance and approval of the grading is +/- 0.1′ which is from +0.149 to -0.149 or just about 0.3′.
I really wanted to get into all of the error theory but it takes a long time to understand (and it still makes my head hurt). Let me just say that this article points out differences in measurements between satellites and the trend is always going up. We see the same in Lord Monckton’s recent article about HadCRUT5. What these articles show me is that there are systematic errors in their measurements. By definition (same site)
Random errors are statistical fluctuations (in either direction) in the measured data due to the precision limitations of the measurement device. Random errors can be evaluated through statistical analysis and can be reduced by averaging over a large number of observations (see standard error).
Systematic errors are reproducible inaccuracies that are consistently in the same direction. These errors are difficult to detect and cannot be analyzed statistically. If a systematic error is identified when calibrating against a standard, applying a correction or correction factor to compensate for the effect can reduce the bias. Unlike random errors, systematic errors cannot be detected or reduced by increasing the number of observations.
Now this is all fun but you also need to deal with calibration of the instrument, atmospheric conditions (they do mess with GPS a lot) and also parallax and instrument drift and lag time etc.
And that doesn’t even cover estimating uncertainty, standard deviation and propagation of uncertainty and so much more.
I am so glad I don’t get tested on this yearly to keep my license.
The following is a link to the Chapel Hill article…enjoy. Oh and this is a quick summation of the actual course book.
https://www.webassign.net/question_assets/unccolphysmechl1/measurements/manual.html
isn’t Josh Willis the same guy behind the Argo buoy temperature adjustments ?
Yes – the very one.
Have heart. While an individual measurement has an accuracy of 4 cm, you take 10 of them for an accuracy of 4 mm, and ten thousand for an accuracy of 4 micron. The sky is the limit 🙂
I hope that was sarcasm because as we all (should) know, there is no mathematically valid way increase accuracy. Accuracy can only be improved by making better instruments.
The reason they think they can get remarkably accurate results is the power of averaging a huge number of samples. If your ‘noise’ is randomly distributed, that technique is amazing. It lets me pull a real clean signal out from under 20 db of noise.
On the other hand, if you’ve got red noise, averaging doesn’t help things at all. Given that red noise is common in nature, ‘their’ claims of accuracy are, at very least, highly suspect.
cB,
Many statistical methods require data to be IID, random variables that are independent and identically distributed. It is not rare to see this fundamental condition precedent violated in climate research. Geoff S
Yeah, it’s too bad you can’t improve accuracy by averaging (or any other mathematical technique). Precision can be improved by simple averaging, but as Geoff points out, the data must be IID or you have to adjust for the serial auto-correlation, and that’s not easy.
Quoting your exact words:
Do you know of any way I (or you, also) can get onto the international gravy train to pay for these extravagances? 🙂
Edited to add the smiley face, just in case.
There are four ways to get on the gravy train: 1. Be born well; 2. Marry well; 3. Provide something of value to people; or 4. Be part of a huge scam. You can pick the numbers yourself for both Obama and Gates. All of the prominent CliSci profiteers fall in one of the four.
Seems to me it would be easier to estimate the net changes in glacier volume over last few decades and use that to predict sea level change. Though water can come from elsewhere but surely most would be due to glacier volume change.
Aren’t there several other explanations for SLR? I suspect that the volume of melting glaciers would be minute in comparison.
The 2 biggest factors are the ice melting and expansion of water that warms. This is why the warmers really want to see sea level rise increasing.
Lake Eyre in Australia has been blamed for lowering sea levels one year.
https://www.npr.org/2013/08/20/213577129/how-extreme-australian-rains-made-global-sea-levels-drop
Say, why don’t we run pipes from the sea (or Queensland’s rivers) to Leke Eyre, or from the Mediterranean to the Libyan depression, and fill them both, lowering the sea level considerably?
Also refill Dead Sea, Salton Sea, Great Salt Lake… There are lots of places to store large volumes of water.
Excellent article. I am puzzled by the University of Colorado satellite sea level rise average rate showing a +/- amount of +/- 0.4 mm/yr. while NOAA shows a +/- amount varying much less with an average of +/- 0.02 mm/yr. Why the huge difference?
NOAA lies with more precision?
ROTFLMAO…….you also are confused regarding the difference between accuracy and precision!!!!!!!
One bad example, and the poor fool actually believes himself to be an expert who must never be questioned.
Do you mean NOAA lies with more accuracy?
Satellite SLR measurements HAVE NEITHER.
Try not to confuse maths and statistics, for your ideology, BF !
Brian,
I think Rud knows the difference between accuracy and precision, but is being snarky in implying that NOAA does not.
Nope. I just forgot the sarc tag. See my guest on Jason 3, which actually illustrated using shooting targets the difference. To sum that, precision is tight grouping, accuracy is on the bullseye. BOTH is how you win a rifle competition.
Rud,
I think the most important distinction is that accuracy is applies to single measurements and is generally constrained by the physical properties of the measurement system. Whereas precision is a description of the error in the system after making multiple measurements. Generally this error is from environmental noise and is independent of the accuracy, although they may be related. Because of this, mathematical techniques may be employed to characterize and nullify some of the error. While this can result in an overall better measurement, it can’t improve it beyond the physical accuracy of the instrument.
Take for instance your rifle competition example. No matter how good a shot you are and how much environmental noise (wind, etc.) you control for, you are still limited by the quality of your rifle and ammunition. You simply can’t improve the accuracy of rifle with a badly machined or worn barrel. There is no way to tell beforehand, or compensate for how far off each shot will be. You can characterize the accuracy by taking a lot of shots and then measure the maximum spread, but that’s it.
In a measurement system, the accuracy describes the limits of your knowledge about what is being measured. For example, an analog to digital converter has only so many bits. If you divide the range of voltages it can convert and divide by the number of bits in the result, you get the accuracy in volts per bit. No matter how good your electronics are and how stable the voltage source is, you can never measure that voltage at a better resolution than one bit. You can extrapolate, but that’s really just a guess. You can’t know because information was lost during the conversion. All physical systems are limited in some way, so while the mechanisms change, they all have a physical accuracy which can’t be changed without improving the physical instrument.
[deleted per request. w.]
Moderator, please delete the above comment, it’s formatted correctly below.
“The point is that you have just measured the average height of
adult males to be somewhere between 5.745 and 5.755.”
Absolutely not . . . you have only measured the average height to be somewhere between 5 and 6 feet. “Averaging” the measurements to supposedly obtain “higher precision” assumes that you have, a priori, an accurate idea of the distribution function of the population over the range of measurement (i.e., is it:
Uniform Distribution
Binomial Distribution
Normal Distribution
Poisson Distribution
Exponential Distribution
T Distribution.
Chi-square Distribution.
F Distribution.
etc.?)
Applying statistics to data does NOT create new data.
Learn about statistical interpolation.
You confuse “precision” with “accuracy.”
Have you created a macro to just keep repeating the same inaccurate claim over and over again?
Are you related to Griff?
Brian Jackson posted “You confuse ‘precision’ with ‘accuracy’.”
Absolutely not! My use of the term precision was correct. You can do any sort of “averaging” (correctly on not) and report the average value to as many decimal points as you want . . . in your case it was to three decimal places (i.e., 5.745, 5.755). You could just as easily have asserted (again, incorrectly) the average to be between 5.74518931642 and 5.75471582775.
In any case, in terms of accuracy the only thing that one could correctly assert in your example of the stick with (supposedly) accurately marked 1 foot intervals—and data recorded to only the nearest foot—is an accuracy of ±0.5 foot, no matter what data distribution is assumed over the 5 foot to 6 foot interval and no matter what “averaging” technique is used.
“Lies, damned lies and statistics.”
It’s just like NOAA claiming it can measure global surface temperatures to 0.01/yr or even 0.001/mo.
Or even worse NOAA claiming to provide the global 2M temperature anomaly back to 1850 to 0.01C when the Southern hemisphere had at best 100 observation sites mainly in Australia/New Zealand and South Africa. It was only a hundred years later, after the 2nd World War, that things improved and even then not so much. It is difficult to understand how someone can guess/homogenize/grid a temperature out of nowhere and claim an accuracy of a hundredth of a degree for the guess. Even with an observation from a Stevenson Screen taken by the observer at 1am with the sleet blowing down around their neck …. will not be accurate to any better than a degree.
My enduring refrain, the example of the Tea Boy being sent out into the rain/sleet/snow/baking sun to take measurements a ‘scientist’ should be doing. Even a height difference between the scientist and the Tea Boy has an influence.
Stevenson screens themselves were designed for local weather forecasting. They were never intended to be part of a global network. There are also several designs, at least one for the US and one for the UK, and we now have a mini version in Australia which, by some accounts, saw considerable jump in temperatures which was not allowed for. I think either Jo Nova or Jennifer Mahorasy have objected to this.
Canvas buckets were still being chucked over the sides of ships to no definable depth, to take sea temperature measurements in the 1960’s. Another task for the Tea Boy, or Cabin Boy in this case.
Willis’ excellent article justifies my unsubstantiated contention that even with multiple measurements taken by satellite over a small area of Oceans, the precision down to even 40mm would be stretching credibility. For example, what is the prevailing weather at any given moment doing; is the sea surface flat calm, choppy, violent, or just with a substantial swell?
We can average out anything we want but much like land surface temperatures, there may not be a square inch of all the Oceans that conform to the ‘average’ other than in momentary passing.
I also believe sea levels are different at each end of the Panama canal.
Willis, this will help you understand how the satelittes can measure such small lengths.
.
Get a 10 foot long pole, and make marks on the pole at 1 foot intervals. Now use this pole to measure the height of 20,000 adult males, recording each measurment to the nearest foot. Sum the 20,000 measurments and you will get a number around 115,000 feet. You may get 114,900, or 115,100, but if you repeat the measurment you will get about 115,000. 114,900/20,000 = 5.745 and 115,100/20,000 = 5.755. The point is that you have just measured the average height of adult males to be somewhere between 5.745 and 5.755. That is pretty close to the real value of 5.75. So with a device that measures to the nearest foot, you can measure the average height of adult male to +/- 0.01 feet. You can get more decimal places if you use 100,000 readings instead of 20,000.
.
Learn about the standard error of an statistical estimator.
TYPO: should be: “real value of 5.75.”
Fixed.
w.
“The point is that you have just measured the average height of
adult males to be somewhere between 5.745 and 5.755.”
Absolutely not . . . you have only measured the average height to be somewhere between 5 and 6 feet. “Averaging” the measurements to supposedly obtain “higher precision” assumes that you have, a priori, an accurate idea of the distribution function of the population over the range of measurement (i.e., is it:
Uniform Distribution
Binomial Distribution
Normal Distribution
Poisson Distribution
Exponential Distribution
T Distribution.
Chi-square Distribution.
F Distribution.
etc.?)
Applying statistics to data does NOT create new data.
Learn about statistical interpolation.
is that like the statistician who drowned in water that averaged one inch deep?
On this subject, a very wise man said it best:
“It is the mark of an educated mind to rest satisfied with the degree of precision which the nature of the subject admits and not to seek exactness where only an approximation is possible.” —Aristotle (384 B.C – 322 B.C.)
Brian Jackson, take heed.
Let’s just put a lid on Brian Jackson’s assertion that one can obtain increased precision of measurement and increased accuracy by his Gedankenexperiment of determining average adult male height by using a large number of measurements with a pole just (accurately) marked with just a 5 foot index and a 6 foot index and (presumably accurately) visually rounding off each measurement and recording it to the nearest foot.”
Here’s how to mathematically show the fallacy of this Gedankenexperiment: let’s assume we add additional accurately positioned marks at 4.50 feet, 5.50 feet, and 6.5 feet and record each measurement both as Brian proposed (rounding and recording to the nearest foot mark) and also rounding and recording separately to the nearest half-foot mark.
In Brian’s case, there are only two bins to record data: the “5 foot bin” and the “6 foot bin”, but with the new modification there are now actually four bins (the “4.5-5.0 foot bin”, the “5.0-5.5 foot bin”, the “5.5-6.0 foot bin” and the “6.0-6.5 foot bin”) to record the measurement data for each individual.
Let’s examine two hypothetical, but entirely possible, cases for data records:
Case 1: the four bins are filled with these numbers in order of increasing height:
4,000, 8,000, 6,000, and 2,000, yielding a weighted average of 5.4 feet for the 20,000 samples, with this average being exactly the same using Brian’s two bin data collection and the modified four bin data collection.
Case 2: the four bins are filled with these new numbers in order of increasing height:
2,000, 10,000, 5,000, and 3,000, again yielding a weighted average of 5.4 feet for the 20,000 samples per Brian’s two bin technique (as expected since the 5 ft/6 ft bin numbers are identical to Case 1 at 12,000/8,000). However, average from the four bin data collection is now different . . . it is 5.5 feet or 0.1 foot greater, rounded to the nearest 0.1 foot.
Why did this happen? It is because the population distribution, when measured at sub-foot resolution, shifted slightly upward in Case 2 compared to Case 1.
So, this simple example of having a “calculated average” change from 5.4 feet to 5.5 foot (again, just considering four sample bins compared to the proposed two bin method) shows the supposed increase in precision obtained just from a large amount of samples is generally invalid (i.e., BOGUS). Likewise, a claimed accuracy of 0.1 foot or better for the two-bin averaging case cannot be mathematically justified.
QED.
Brian, your snark about “Learn about the standard error of a statistical estimator.” is ugly, unwarranted, and untrue. I suspect that I may know more about the subject than you do. Keep a civil tongue in your head, you’ll get farther in life.
To return to your underlying claim, it is true in theory, but in practice it is not always true. And as the old saying goes, “The difference between theory and practice is greater in practice than it is in theory”.
First, it assumes that we are repeating measurements using the same measuring stick. This is not true for satellite sea levels, where we are using different satellites with different instruments, different orbits, and different capabilities.
Second, it assumes that the errors are symmetrical. In the real world, this is often not true.
Third, it ignores the very real phenomenon of instrumental drift.
Fourth, it ignores instrumental or human rounding errors. For example, when people are taking minimum temperatures and the temperature is near a record low, there’s an unconscious push to round to the colder figure, not the warmer.
Fifth, it ignores human error. This crops up in things like the design of the measuring stick … suppose one of the marks on your stick is out by one inch because someone wasn’t paying attention … what then?
Sixth, it ignores the actual range of the objects being measured. To use your example of a measuring stick with one-foot marks, suppose everyone you measure happens to be between 5’6″ and 6′ tall? Your method will claim that the average is six feet exactly.
Seventh, it ignores what is called “systematic error”. Here’s a good description from the web:
Eighth, it ignores the existence of what is called “red noise”. Red noise is autocorrelated noise, also called “fractional gaussian noise”. Because this kind of noise is autocorrelated, it can give results higher than the truth for a period of time, and then lower than the truth for another interval. So the results depend on the timing and the duration of the measurements.
Finally, it ignores the fact that there are limits to the process. Theoretically, by increasing the number of measurements, you can increase the accuracy of results without limit. So in theory, we’d never need micrometers. We could just use a ruler marked in inches and fractions, take a thousand estimates of a thousand things, each of which is a few mils thick more or less, and voila! Results of the average thickness of the thousand things accurate to the nearest thousandth of an inch.
Because of all of those issues, my general real-world rule of thumb is that repeated measurements can give us an order of magnitude improvement in our precision, but more than that requires a close investigation of all of the possible error sources listed above.
Now, what were you saying about learning about the standard error of a statistical estimator?
Best regards,
w.
Willis,
Couple of years ago I saved this academic bafflegab to describe mathematics the way BJ seems to imagine.
“The “begetted” eighmess as the system-limit number of the nuclear uniqueness of self-regenerative symmetrical growth may well account for the fundamental octave of unique interpermutative integer effects identified as plus one, plus two, plus three, plus four, as the interpermuted effects of the integers one, two, three, and four, respectively; and as minus four, minus three, minus two, minus one, characterizing the integers five, six, seven, and eight, respectively.”
https://www.researchgate.net/profile/Paul-Heckbert/publication/220721478_Ray_tracing_Jell-O_brand_gelatin/links/551f589f0cf2a2d9e1406a70/Ray-tracing-Jell-O-brand-gelatin.pdf
Geoff S
You and Willis have similar styles of prose. 😀 😀 😀 😉
And you are prone to mathematical mis-comprehension.
If being accurate qualifies as a “style of prose”, then yes they do.
Assuming you could dump the ego, perhaps you could learn from them.
“I suspect that I may know more about the subject than you do. ”
.
I disagree.
.
I gave you a physical, concrete, reproducible example of using a measuring device with 1 foot marks to measure an average with 0.01 foot accuracy.
.
Not only is it true in theory, it’s used everyday in practice, especially in particle physics. If you disagree, please tell me what ruler is used to measure the diameter of a hydrogen nucleus?
.
” it assumes that we are repeating measurements using the same measuring stick.”
..
The same satellite passes over the same location multiple times, and generates a data point. They take a lot of data points at the same location to arrive at an average measurement. Not only is this done with one satellite, it is done with all of them. Ask Mr. Spencer about this for his calculation of UAH.
.
” In the real world, this is often not true.” & “it ignores the very real phenomenon of instrumental drift.” …. The satellite’s radar altimeters can be calibrated against known physical altitudes ON DRY LAND.
.
“human rounding errors.” All of the data is collected, stored and processed on computers. Seriously Willis…..please try harder.
.
You can claim “systemic” errors, but you will have to prove they exist over the multiple satellites measuring sea level.
.
“repeated measurements can give us an order of magnitude improvement in our precision,.” ……..wrong word, you confuse “precision” with “accuracy.” Standard error of a statistical estimator gives you higher accuracy to the actual population metric.
http://cdn.antarcticglaciers.org/wp-content/uploads/2013/11/precision_accuracy.png
Brian Jackson
February 21, 2021 5:06 pm
True. And I gave you a number of ways that your average could be wrong. For example, I pointed out that if all the people you measure are between 5’6″ and 6′, your method would give an average of exactly 6 feet … hardly 0.01 foot accuracy, despite you claiming to know so gosh darn much about the subject.
I also pointed out that if one of the marks on the stick is incorrect, you won’t get your vaunted accuracy either.
I do note that you’ve totally ignored those examples of where your method can go astray, in a futile attempt to impress us with your knowledge. Sorry …
Wait, hang on, I know the answer to this one … an eight-foot stick with marks every foot, but they took a million measurements?
Actually, in the real world, the answer to your question seems to be “the wrong ruler”, viz:
But I digress … you continue:
Not true in the slightest. Given that for each measurement we need to know the satellite location to a very small distance, the odds of that satellite coming back to that exact same spot are vanishingly small. They measure from a nearby spot, and with very different conditions of temperature, humidity, waves, and cloudiness … and there’s no guarantee that the errors from any of them are neither red nor asymmetrical.
Yes, AS I SAID, repeated measurements can and do improve the uncertainty of the average … but as I also said, in the real world it’s not all that simple.
Actually, they are calibrated at only a few points, which are lakes. Please stop making things up.
And since they only come past those lakes occasionally, and their orbits are far from being perfectly elliptical, and the temperature, clouds, and humidity are different each time they come over, this is far from ideal.
Seriously, Brian, I politely invite you to osculate my fundament. Your snark is ugly and unwarranted. I was talking about the general issue of why repeated measurements may not help. As were you, with your example of the stick with marks every foot. So it’s ok for you to talk about humans taking measurements with a stick, but when I talk about humans you get nasty? Get a grip.
Umm … err … THAT IS EXACTLY WHAT I JUST DID IN THIS POST! I showed that two satellites measuring the same thing (sea level) over the same overlap show very different trends. Did you actually read what I wrote? Given your claims, how do you explain the difference in trends? I mean, you’ve assured me that none of the nine issues I raised have any validity regarding sea-level satellites, so what is your explanation of the sudden change in trend from one satellite to the next? Gremlins?
You are correct, I was moving too fast and misspoke. Averaging doesn’t improve precision. Precision is repeatability.
However, if there is systemic error, as there is in many measurement situations, repeated measurements will not increase the accuracy in the slightest. The same is true if there is red noise, or non-symmetrical noise.
w.
1) Please tell me where on earth you are going to find 20,000 adult males that are ALL 5’6″ and 6′ tall. Really, your claim that nobody in a 20,000 adult male sample will be 5′ 4″ tall? Get real and watch the Wizard of Oz movie. It is obvious to all, you have no concept of the term “random sampling.”
.
2) “I also pointed out that if one of the marks on the stick is incorrect, you won’t get your vaunted accuracy either. Seriously Willis, as a professed builder of his own home, you can’t tell me that a tape measure can’t make 1-foot markings?……if so, please, make sure any/all of the guests you invite into the home you built know this.;
.
2a) We know the diameter of a proton (discussed elsewhere…….pretty sure the marks can be make accurately)
.
3) Thank you, thank you, thank you, thank you for acknowledging standard error in statistical estimators: “Researchers have now measured this in experiments which are ten times more accurate than all previous ones.” LMFAO, they repeated the experiment with increased NOBS to obtain the accuracy. You simply don’t understand that quantum chromodynamics is a STATISTICAL theory. (remember you said: “. I may know more about the subject than you do” which you have just proven you don’t and that you use Google/Wikipedia for references based on your copy/paste).
.
4) “Not true in the slightest” && “back to that exact same spot are vanishingly small.” ….. please talk to Roy Spencer.
.
5) “they are calibrated at only a few points” you posted a link: ” http://file///Users/willis/Documents/%20Internet%20Downloads/remotesensing-10-01679.pdf ” which shows all of us how computer illiterate you are. You are not sharing the hard drive of your computer on the internet, so nobody knows WTF that link points to. Please stop.
6) Radar altimeters work BOTH over lakes and dry land. Do you know how radar works?
.
7) ” I was talking about the general issue of why repeated measurements may not help”…….yes, and I was trying to educate you as to how a radar altimeter with a resolution of cm can measure a population average to less than a mm.
.
8) ” THAT IS EXACTLY WHAT I JUST DID IN THIS POST”…. no, you failed. “none of the nine issues I raised have any validity regarding sea-level satellites”…….you don’t know the difference between precision and accuracy.
..
9) “If there is systemic error”……big if without evidence. Please remember in logic that a false premise allows any conclusion. You have provided no evidence of systemic error, so should I wait for you to post the evidence, or should we assume ther is no systemic error?
.
10) your claim “I suspect that I may know more about the subject than you do. ” has obviously been shown to be false.
1) Please tell me where on earth you are going to find 20,000 adult males that are ALL 5’6″ and 6′ tall. Really, your claim that nobody in a 20,000 adult male sample will be 5′ 4″ tall? Get real and watch the Wizard of Oz movie. It is obvious to all, you have no concept of the term “random sampling.”
.
2) “I also pointed out that if one of the marks on the stick is incorrect, you won’t get your vaunted accuracy either. Seriously Willis, as a professed builder of his own home, you can’t tell me that a tape measure can’t make 1-foot markings?……if so, please, make sure any/all of the guests you invite into the home you built know this.;
.
2a) We know the diameter of a proton (discussed elsewhere…….pretty sure the marks can be make accurately)
.
3) Thank you, thank you, thank you, thank you for acknowledging standard error in statistical estimators: “Researchers have now measured this in experiments which are ten times more accurate than all previous ones.” LMFAO, they repeated the experiment with increased NOBS to obtain the accuracy. You simply don’t understand that quantum chromodynamics is a STATISTICAL theory. (remember you said: “. I may know more about the subject than you do” which you have just proven you don’t and that you use Google/Wikipedia for references based on your copy/paste).
.
4) “Not true in the slightest” && “back to that exact same spot are vanishingly small.” ….. please talk to Roy Spencer.
.
5) “they are calibrated at only a few points” you posted a link: ” http://file///Users/willis/Documents/%20Internet%20Downloads/remotesensing-10-01679.pdf ” which shows all of us how computer illiterate you are. You are not sharing the hard drive of your computer on the internet, so nobody knows WTF that link points to. Please stop.
6) Radar altimeters work BOTH over lakes and dry land. Do you know how radar works?
.
7) ” I was talking about the general issue of why repeated measurements may not help”…….yes, and I was trying to educate you as to how a radar altimeter with a resolution of cm can measure a population average to less than a mm.
.
8) ” THAT IS EXACTLY WHAT I JUST DID IN THIS POST”…. no, you failed. “none of the nine issues I raised have any validity regarding sea-level satellites”…….you don’t know the difference between precision and accuracy.
..
9) “If there is systemic error”……big if without evidence. Please remember in logic that a false premise allows any conclusion. You have provided no evidence of systemic error, so should I wait for you to post the evidence, or should we assume ther is no systemic error?
.
10) your claim “I suspect that I may know more about the subject than you do. ” has obviously been shown to be false.
1) Please tell me where on earth you are going to find 20,000 adult males that are ALL 5’6″ and 6′ tall. Really, your claim that nobody in a 20,000 adult male sample will be 5′ 4″ tall? Get real and watch the Wizard of Oz movie. It is obvious to all, you have no concept of the term “random sampling.”
.
2) “I also pointed out that if one of the marks on the stick is incorrect, you won’t get your vaunted accuracy either. Seriously Willis, as a professed builder of his own home, you can’t tell me that a tape measure can’t make 1-foot markings?……if so, please, make sure any/all of the guests you invite into the home you built know this.;
.
3) Thank you, thank you, thank you, thank you for acknowledging standard error in statistical estimators: “Researchers have now measured this in experiments which are ten times more accurate than all previous ones.” LMFAO, they repeated the experiment with increased NOBS to obtain the accuracy. You simply don’t understand that quantum chromodynamics is a STATISTICAL theory. (remember you said: “. I may know more about the subject than you do” which you have just proven you don’t and that you use Google/Wikipedia for references based on your copy/paste).
.
4) “Not true in the slightest” && “back to that exact same spot are vanishingly small.” ….. please talk to Roy Spencer.
.
5) “they are calibrated at only a few points” you posted a link: ” http://file///Users/willis/Documents/%20Internet%20Downloads/remotesensing-10-01679.pdf ” which shows all of us how computer illiterate you are. You are not sharing the hard drive of your computer on the internet, so nobody knows WTF that link points to. Please stop.
6) Radar altimeters work BOTH over lakes and dry land. Do you know how radar works?
.
7) ” I was talking about the general issue of why repeated measurements may not help”…….yes, and I was trying to educate you as to how a radar altimeter with a resolution of cm can measure a population average to less than a mm.
.
8) ” THAT IS EXACTLY WHAT I JUST DID IN THIS POST”…. no, you failed. “none of the nine issues I raised have any validity regarding sea-level satellites”…….you don’t know the difference between precision and accuracy.
..
9) “If there is systemic error”……big if without evidence. Please remember in logic that a false premise allows any conclusion. You have provided no evidence of systemic error, so should I wait for you to post the evidence, or should we assume ther is no systemic error?
.
10) your claim “I suspect that I may know more about the subject than you do. ” has obviously been shown to be false.
.
11) Thank you for acknowledging that I know more than you with regards to precision and accuracy.
WordPress sucks.
Brian. Please explain how the tidal configuration of the sun and the moon complicates the average height of adult males!
It’s operator error.
This from the man who calls me computer illiterate …
I’m gonna pass on trying to answer that, Brian. Not worth my time. You can claim success if you wish. Other folks know better.
w.
Willis, to quote Bugs B., “Moroons” abound!
So, you would agree that the step changes in the satellite trend(s) shown by Willis accurately demonstrate that the last two satellites have not been measuring sea level correctly.
Very good point. 🙂
Gentlemen, please! Don’t distract the CliSci practitioners with observations. They know that sea levels are accelerating (their models say so) and any discontinuity between satellites can be smoothed to their satisfaction.
As I caught one warmunist saying, “the theory is so obviously true that measurements which disagree can be safely disregarded.”
Sampling isn’t the issue, but rather population. The big stick scenario assumes the heights have a normal distribution. With different distributions, the average could end up as 5.00000 or 6.00000 feet. Precision is not resolution, which is the real issue here.
BJ
You remarked, “Radar altimeters work BOTH over lakes and dry land. Do you know how radar works?”
I’m convinced that you do not know how radar altimeters work. They provide a calculated estimate of the distance between the satellite and the surface of interest, based on time of travel of the pulse. The problem is, both the altitude of the platform above the geoid varies with horizontal position, and the ocean surface is continuously varying. The altitude of the satellite over land is not constant, and similarly, the altitude of the satellite over the oceans is not constant!
If one of them were fixed, then you could obtain a reasonably accurate estimate of the other with the systems that are in orbit. However, the oceans have variations that might be as large as 100 feet with storm waves constructively interfering, along with smaller wind ripples of an inch, and tides varying from 1 foot to 50 feet. The satellite is moving up and down in response to changes in the strength of gravity. I’m not going to take the time to try to chase down what that is. I’m going to guess that we are talking about a few feet — much more than 0.1 mm!
You are not being successful in convincing readers that you understand this problem better than Willis does!
Please! Arguing over the number of angels on the head of a pin.
What does it matter if you make the measurement at the exact same place or not. This is a constantly varying, chaotic surface you are measuring. The surface being measured at one time isn’t the same as the one even a fraction of a second later. Besides you are measuring with an imprecise instrument. the radar wave strikes over a significant area of the chaotic surface and the return signal is spread out, some reflected from troughs, other from peaks.
And you are worried about averaging to a precision that is so much greater than the variability in the surface as to be meaningless.
Willis gave you a detailed explanation as to why your example doesn’t demonstrate what you wish it demonstrated.
Your only come back is to state that since you gave an example, your point has been proven.
Your claim to knowing more than Willis has been well and thoroughly refuted.
Willis didn’t know the difference between accuracy and precision and acknowledged it.
Sure he does. It has been explained on this blog many times over the years.
Satellite have NEITHER to the level they are pretending.
Brian, why won’t you acknowledge it when you misspeak?
BJ
You remarked, “The satellite’s radar altimeters can be calibrated against known physical altitudes ON DRY LAND.”
That is true. However, over the ocean there is no way to know the actual altitude of the satellite because it will change velocity and altitude in response to the Earth’s local gravity field. To do that, they rely on a Gravity Model, with coarse spatial resolution, and almost certainly not to a precision of 0.1 mm derived altitude when both the sea surface and the satellite are changing heights!
It appears that you are unfamiliar with how the altimeters actually work. They aren’t like a speedometer in a car that relies on mechanical calibrations that work on different kinds of pavement. The satellite altitude has to be calculated for every data sample, and that can only be modeled over water and glaciers.
Willis, the ability of satellites to measure seal level changes is even worse. There are several websites that state that the altitude of a satellite can be known to 1 in 1 million, not the 1 in 13 billion required for their stated precision. A satellite changes orbit altitude slightly as it passes over different density areas of the earths crust, which density differences are doe to either composition or thermal variations. Good for you for your fig. 2, the king has no clothes exposed once again.
Perseverance hit a sphere 6800 kilometres in diameter from a distance of 54.6 million kilometers……and the target was moving.
Given that the timing of the orbit of any satellite is extremely precise with the accuracy of atomic clocks, I guess NASA does pretty well.
Yes … but Perseverance required several mid-course corrections. In fact, NASA always plans multiple translational correction maneuvers for their spacecraft headed toward another planet. The intent of these is to bring the spacecraft back on track so as to reach the intended target.
So unlike you, I guess NASA’s original trajectory sucked and would have missed by a ways, but they knew it would be wrong and they and planned for that.
w.
Satellites in orbit have thrusters.
Satellites in orbit have limited fuel on board. Regardless, they would have to know that they were 2 inches high before they could order the satellite to correct for it.
Brian Jackson posted: “Satellites in orbit have thrusters.”
And so has every spacecraft ever sent on an interplanetary mission . . . for the purpose of “mid-course corrections” that Willis mentioned above.
But I will also add such thrusters are also needed to orient/reorient such spacecraft for (a) adjusting fly-by trajectories on multi-planet-visitation missions, (b) for breaking into orbits around the target planet or one of its moons, and (c) for proper attitude (heat shield-wise) for breaking entry into the target planet’s atmosphere and/or for direct descent to landing.
Condition (c) above was used in the recent instance of the Perseverance mission landing on the surface of Mars.
Satellites that have thrusters use them to maintain a nominal orbit that is decaying from air resistance. They would quickly run out of fuel if they attempted to maintain an exact, unvarying altitude above the geoid. Besides that logistical issue, they would have to have an independent verification of the altitude, which is a practical impossibility over oceans, and even over places like Greenland and Antarctica where the ice is moving, melting, and accumulating snow.
What the radar altimeters are fairly good at is measuring the above-water thickness of pack ice in polar regions, where there is an abrupt change in the time of the return signal.
You are so anxious to be right that you are convincing everyone that you know very little about the topic at hand.
Clyde, your main point about satellite thruster use is valid, but I cannot agree with your statement “Besides that logistical issue, they would have to have an independent verification of the altitude, which is a practical impossibility over oceans . . .”
With the implementation of full-Earth coverage of precision GPS location-altitude determination data, all Earth-orbiting satellites have a means of independent verification of altitude for any orbital nadir point.
Gordon,
Point taken that it is possible to use GPS, although high precision requires differential GPS, which isn’t possible with a moving satellite. Typically, a single GPS has a resolution of about 10 meters altitude. That isn’t much help when trying to get sub-millimeter elevation changes.
However, I’m unaware that the radar altimeters are using GPS. When I did background reading previously, it was stated that they were using gravity models to determine their altitude.
GPS satellite orbit ephemeris is accurate to about 5 cm, updated by range tracking amongst 8-12 remote tracking sites (Diego Garcia has one). This level of accuracy is required for the p(Y) code capable military GPS receiver applications (offensive and general navigation).
Air Force Satellite Control Network – Wikipedia
What isn’t so straightforward is adjusting the raw radar range data with “models” to compensate for:
To get sub-cm level accuracy is a bit of a stretch, actually.
Charles
I’m not sure that you are saying what you think you are saying. As I understand your statement, we know where the GPS satellites are to within a couple of inches. However, that apparently is only possible with numerous range tracking stations correcting the ephemeris. The radar altimeters don’t have that level of support and correction. The reference I looked at said that the multiple satellite GPS system is only good for 10-20 meters elevation for the GPS receiver. The question was about using GPS to determine the altitude of the radar altimeters.
https://en.wikipedia.org/wiki/Ephemeris
To what degree of accuracy? The accuracy for my car is multiple meters.
Perhaps you don’t realize that Mars is much larger than a few millimeters as was the designated landing zone.
Perserverance had multiple mid course corrections all the way from Earth to Mars.
You are 0 for 2 in coming up with valid examples.
LOL….see post above.
I’m glad to see that you find your ignorance to be so amusing. Regardless see post above where I once again correct your lack of knowledge regarding space craft.
That was the best laugh I’ve had in quite some time … many thanks …
And as a bonus your instruction added to my understanding of statistics.
Willis confuses “accuracy” and “precision”……still laughing?
What I find hysterical is how completely Willis dissected your meager example and you’re still trying to figure it out. Come on man! Stop digging. You’ve already been buried.
No he didn’t.
Willis acknowledges he “misspoke” which is a clever way to recover when he’s found to be in error.
He corrects you on 10 things, admits that one of his corrections might not have been fully accurate, and from that you conclude that you are completely exonerated.
Just how long have you been doing climate science?
Probably about 30 years.
The longer one has been “in” climate science, the more cognitive dissonance warps their thinking on the subject.
To bad you aren’t even that clever.
First rule of holes.
I suspect that it will be a “cold day in Hell” before you would admit to misspeaking, let alone actually being “in error.”
ninth: It assumes that the height of the people being measured, is the only thing that is changing. What if each person being measured is wearing a different brand of shoe. In the SLR case, things like the actual height of the satellite and the moisture content of the air are different with every measurement made. These values can never be known with perfect accuracy, nor can they assume that any errors in these values will be perfectly random.
Also, has the profile of the wave heights in differing sea conditions has been studied to the point where it can be compensated for in these measurements. Do they even know with any degree of accuracy what the sea conditions directly below the satellite are at any given point in time?
Wrong MarkW, height is known to be a normally distributed human characteristic with or without a shoe.
.
“Do they even know with any degree of accuracy what the sea conditions directly below the satellite are at any given point in time?” … irrelevant because they average out over time. For example, tidal behavior is sinusoidal which averages to zero over long time periods.
Do you ever get tired of making a fool of yourself. The height variations aren’t random. Beyond that, since these satellites don’t measure sea heights over 100% of the earth’s surface, even if the height differences WERE to be random, the lack of complete sampling would still invalidate your methodology.
If you think gravitational anomalies are related to tides, you know even less than you have indicated.
MarkW
I’m beginning to wonder if BJ is one of our better known trolls using an alias. The style reminds me of “weekly rising.”
Whee! In the 1950s and 1960s, women were on average 1″ to as much as 2.5″ ‘taller’ than they are now – if you compare measures with shoes on. In modern times, when most women have stopped the insanity of balancing themselves on approximately 20% of their foot area, their “shod height” has diminished considerably. But, if you actually plotted the current distribution of “shod height,” you would find a very interesting spike (pun intended) at the upper range, consisting of those women who still follow high fashion. (Not that anyone will ever do such a distribution – doctors, military recruitment stations, etc. all measure height with shoes off.)
Second point about that distribution. The shape of the human height distribution has been determined by many millions of measurements that are accurate to 0.1″ (+/- 0.3″). So, you can make deductions about the most likely average of any sufficiently large sample of properly randomized measurements of human heights. Only because far more accurate measurements than “nearest foot” have already been made. (Which begs the question – why ever are you doing this study in the first place???) Now, if you please, provide us, the ignorant masses, with the set of measurements, accurate to within +/- 0.05 mm, of the global sea level, so that we can see that the distribution is what you claim it to be?
Brian Jackson February 21, 2021 8:06 pm
I got to thinking about this, and it seemed quite unlikely. Why? Because there are people who are half the average height, but none who are twice the average height. So the distribution has to be skewed towards the shorter end.
And a look at the CDC data finds the following distribution …

Like I said … skewed left, and not normal.
Plus if you include both women and men in the sample, you’ll get a kurtosed distribution with a flattened top. Again … not normal
Sorry, Brian, but despite your claims and bravado … your statement about the distribution of human height is wrong.
w.
Should have noted that myself. I knew the distribution isn’t anything at all symmetric.
Now re-draw the graph in 1 ft intervals, like the measuring stick. 😉
Each “bin” will be basically linear, or maybe undefinable?
A person measuring 6ft, could be anywhere between 5.5ft and 6.5 ft and you have no idea of the distribution within that “bin”
Exactly! The marked-every-foot stick and the data-recorded to the nearest foot process results in a measurement set “average” value accuracy of ± 0.5 foot. That will be the case no matter how many measurements one takes and records (be it 10 or even 1 million+) and no matter how many decimal places (i.e., the precision) that are used in reporting the “average” value.
Willis, please consider the comment I made to BJ about height:
“YOU are wrong!
The height of a person is not constant. This fact is known to Biology since decades long ago: height at wake up and raising from bed DIFFERS from height of the same person late in the evening. By several millimeters (more than 10).”
This is not the same as covered by your sixth point (in comment of February 21, 2021 3:55 pm). It does not refer to the variability of the population, it refers to the variability of each individual. Humans, animals, are not steel rods with fixed dimensions (in the same physical conditions). When measuring the sea level height at a given (geographic position) point in different days (or, more generally, moments) you are not taking measures of different “objects”: you are taking different measures from the same (changing) object. Like when you go to a town at 8 am and start to measure its inhabitants and go on measuring until 7 pm: the “true” (whatever it means) average height of the population could only be obtained by repeating the measurements by a lot of different but simultaneous observers that randomly take the same person at different times during the day…
Willis
You nailed him! I wish I could give you multiple thumbs up!
Willis is cheating, again! He brings facts to a cat fight.
Sigh… The older you get, the more things you “know” – and the more things you find out that you “know” are wrong. For some reason, I always thought that “left” skew meant the mode was to the left of the mean. Now corrected. (I did have the correct notion for “negative” and “positive” skew, though. Different math teachers? Too far back to assign blame now.)
First off, height is not known to be normally distributed. In fact as Willis points out, it is known to be not normally distributed.
Secondly, if you can’t accurately subtract the thickness of the shoes, then you aren’t accurately measuring height, with or without normal distribution.
YOU are wrong!
The height of a person is not constant. This fact is known to Biology since decades long ago: height at wake up and raising from bed DIFFERS from height of the same person late in the evening. By several millimeters (more than 10).
BJ
“Rogue waves” are not sinusoidal. Actually, tides are known to have long term (~20 yr) trends. Over the length of time that radar altimeters have been in orbit, those long-term tidal trends will not yet have averaged out. Also, sea surfaces respond to wind and barometric pressure, which are somewhat random, but again the issue is whether we have been sampling long enough for them to average out. The Law of Large Numbers says that probabilistic events (such as coin tossing) will eventually approach the theoretical probability. However, that doesn’t preclude long runs of heads or tails. To ‘average’ them out will again probably take longer that the time altimeters have been in orbit.
Are you having difficulty breathing? I’m getting the feeling you are in over your head.
BJ reminds me a lot of bethan. Reads one article, and becomes an instant expert. At least in his own mind.
The sea surface is completely chaotic not “somewhat” random
Brian Jackson,
You are making a fool of yourself. It is clear that your practical knowledge of science is limited. Stop digging.
Willis
Please consider earth tides and use you excellent skills to let us know how to interpret earth tides and there relevance to the current discussions.
Thank you in advance. And I am asking for a favor knowing you are busy and may not have time.
Leonard
Willis,
Another source of possible error when trying to measure the height of humans.
How do you handle hair?
Do you measure to the top of hair (TOH)?
Do you squish the hair down? But then those with more hair would still get a couple of extra micrometers of height.
Do you just cut all the hair off of everyone being measured and then measure Top of Skull (TOS)?
And thusly, Big Hair styles women favored in years past would not compress down as much as shorter hair styles, suggesting that women have lost height over time.
And measuring the sea surface is more like doing the height measurement while the people are jumping on trampolines.
….and both of you are missing the obvious/obvious
they keep changing sticks
Willis your 2009 just was a satellite change….when Envisat when out…Jason uses the exact same “Doris”…..
when Jason 3 was brought on board….it’s rate did not match J/2…..instead of tuning 3 to 2….they adjusted 2 up to match 3
now where have we seen that before?
the increase does not actually start until 3
Please, folks, I beg of you, I implore you, when you make a statement like Latitude’s above, LINK TO THE DANG DATA!!!
Without that, it’s just anecdote, and the plural of anecdote isn’t “data” …
w.
but I’ve posted those links so many times to you…asked you to look….and I don’t think you ever look at them..or didn’t catch my posts
Here’s 2 fairly relevant….they explain what they do in their reports
…or put better….explain the jiggling and fenagling
the Envisat working annual report 2009
https://www.aviso.altimetry.fr/fileadmin/documents/calval/validation_report/EN/annual_report_en_2009.pdf
Merged envisat and jason satellite altimeters using crossovers adjustment to determine sea level variability
https://iopscience.iop.org/article/10.1088/1755-1315/200/1/012035/pdf
…there’s literally 100’s of reports…and funny enough, they admit to everything they are accused of
the only real jump up in sea level is J3….the end of J2 is adjustments
Thanks, Latitude, for the links. The real-world reality is that you need to link to your data no matter how many times you’ve done it before. It’s a guarantee that someone reading it won’t have seen your previous links.
And yes, it’s definitely jiggling and fenagling …
w.
absolutely….
The end of J2 is not actual measurements….the end of J2 was adjusted up..after the fact…. to meet with the new J3
rather than tune J3 to match all the previous satellites…they ‘assumed’ all the previous were wrong…and the new and improved J3 was right
…because the previous satellites didn’t show enough sea level rise to suit them and their computer models
there is no real acceleration in sea level rise…because it’s all adjustments
…and that’s why none of it matches any of the tide gauges
Willis and Latitude,
In following this thread I agree with Willis that they are not measuring the same spot from the same spot. At the end of my post I will link some fact sheets from NASA for the Topex satellite and the Jason 3 Satellite.
We can talk all day about precision and accuracy but that doesn’t cover the fundamental problems with these measurements. In looking at the Topex fact sheet I see that they have a network much like my surveyors GPS network and that the satellite is just a big receiver. The fundamental difference between how my crews uses GPS for horizontal and vertical locations is 2 part. 1 is my crew uses a receiver and are not bouncing the waves off of an irregular surface and 2 is that the receiver is in a fixed location and static from a minute to upwards of 30 minutes and is not a moving surface being hit with a one-time shot.
I mentioned in a comment above that we have a GPS network and also use a base station to improve the measurements. That being said we do not use GPS elevations for staking…why you may ask…well it is never the same from day to day. My crew can go out to a jobsite and shoot a few control points to make sure everything is still good. What they find is a slight difference in horizontal location from day to day of +/- 0.01 feet at the worst. Vertical location is different every day usually +/- 0.1′ and it is not surprising to see it off by 0.2 feet or more and always in different directions (for example one day it will be 0.08′ high the next 0.04′ low and so on).
I would like to know how they can get a more accurate measurement with their system locating a moving target with one satellite on a one time pass every 10 days than I can get with a fixed location of a longer duration with 4 to 8 satellites broadcasting data to the fixed network we use of 12 constantly correcting stations triangulating with my base station and receiver.
TC
https://sealevel.jpl.nasa.gov/system/documents/files/1674_tp-fact-sheet.pdf
https://www.nesdis.noaa.gov/jason-3/pdf/JASON-3-facts-Apr%2015%20v2.pdf
https://www.nesdis.noaa.gov/jason-3/pdf/Jason-3%20GPSP.pdf
https://www.nesdis.noaa.gov/jason-3/pdf/Jason-3%20DORIS.pdf
Please note in NASA’s words not mine…Topex 10 day repeat of ground tracks +/- 1 KM and the unprecedented accuracy: sea level measurements to better than 5 CM. For Jason 3 The GPSP supports precise orbit determination by the DORIS system. It also helps to improve gravity field models and provides data for satellite positioning accurate to about 50 meters and 50 nanoseconds. Never the same location.
C’mon man.
It’s Sunday afternoon past beer o’clock where I am, and you’re asking us to digest your math parables TWICE.
(To Willis’ article itself – I see the tide come in and go out in our estuary every day, and the water levels are always more than 3mm different from the same point they were on the previous high or low tides.
Depends where the wind is blowing from, and how strong.
Poofteenth and bee’s d1ck measurements from space just don’t pass the sniff test.
But they do register on the old
Absolutely not. If I make any one additional measurement, I cannot be certain of the accuracy of that one measurement of no more than the graduations on the pole.
You never specified those graduations and what system is used to point to the point on the pole. You just made up the sums of 114,900 and 115,100 for convenience.
I award you a D- in Measurement Science 101.
Consider:
a 500 mL Erlenmeyer flask, 50 mL intervals.
a 250 mL Erlenmeyer flask, 25 mL intervals.
Q: Do they provide the same precision if I want to measure 250 mL?
Joel, again careful distinction is required between the words “accuracy” and “precision”.
If the two flask are calibrated so as to the same percent accuracy at the 250 ml mark, they should theoretically provide the same overall accuracy assuming the measuring person uses the same care and technique in conducting the measurements for both flask types (e.g., measuring the liquid meniscus the same way).
The reported precision of the measurement is subject to the whim of the person performing and recording the measurement . . . one observer may be content to record the measurement as 250 ml, while another may want to record it as 250.0 ml, while yet a third observer might feel competent recording it as 250.00 ml if he/she feels the calibration and his/her eyesight measurement technique warrant such. These are different levels of precision and they might, in fact, all be correct (albeit in the last case, manually by eyesight determining a value to one part in 25,000 would not be expected).
Does the volume of the flask change as the temperature changes?
Of course . . . both the volume of the flask and the volume of the liquid within that is being measured change with temperature, probably NOT with the same slope (one would have to compare coefficients of thermal expansion of both over the given temperature range being considered).
However, Joel did not imply, in his question, concerns about differences in temperature or CTE, so this was left unaddressed so as to not over-complicate the fundament issue he raised.
Consider a graduated cylinder.:
Do each of these precision marked cylinders provide the same level of precsion for say 50 mL? or compared to the Erlenmeyer flask (above)?
Your comment about a 10 foot pole and a given level of precision measurements is nonsense.
As a final note on precision versus accuracy.
Precision comes from how “precise” the graduations are on those flasks, and the care I take to read the fluid level to a line.
Accuracy comes from how closely those graduations were calibrated to a standard when they were etched on the glass.
Satellite SLR measuremsnt aren’t accurate enough to know if they have any precision.
Would have thought it was the other way round.
<b>Question</b>How do they cope with changes in humidity of the air the radio waves pass through?
If they just average them away then they are assuming humidity is independent of whatever is happening with sea level. That would be assuming that humidity is not related to heat in the oceans.
Which would be a curious approach.
They have a separate measuring system on the satellite which purports to measure the humidity. I know nothing of its accuracy or precision.
w.
Thank you.
At least they realised that the idea is fatally flawed. And tried to compensate.
Maybe they did.
Brian Jackson is correct.
Of course averaging of measurements increases precision as per the example of the height measurements in feet only.
It is a total error to argue that averaged measurements can’t exceed the precision of a single measurement. They can and do routinely in many forms of measurement.
This brain-fail about precision and averaging is making WUWT look, well, not clever. Stop it! Brian is right. It’s embarrassingly basic.
Basically, you need to state your assumptions before averaging out random errors.
When you have that list you may see why Brian Jackson is not right.
Stats is not just number crunching. It is also logic.
Brian is not right, as many posters have demonstrated.
There are a number of assumptions that must be met before multiple measurements can be assumed to increase accuracy.
When it comes to using satellites to measure sea height, none of these assumptions have been met.
Brian is assuming all the scores on his ruler are infinitely accurate. They’re not. This means round-up and round-down errors will accrue. But you won’t know when, or how many of each.
As a result, systematic error will creep into your set of measurements. But you won’t know how much. The only way out is to calibrate the ruler and report the calibration error statistic with the measurement report.
Brian is correct only in infinitely-accurate-instrument-land. In the real world, his method fails.
That knowledge is basic to experimentalists Hatter.
Eggburn
The basic assumptions for improving the precision of a given measurement is that all errors are random. That implies using the same instrument for measuring an invariant property that doesn’t change over the time necessary to take the multiple measurements. If the property changes, then the standard deviation is no longer just of the measurement random errors, but includes a component of the trend, if any. If different instruments are used, they will likely have different calibrations characteristic of the type of instrument and what it is measuring. Differently calibrated instruments will introduce systematic errors, which will also reduce the precision.
If being read and recorded by a human, then it is best to use the same observer to eliminate issues of parallax and bias of interpolation accuracy as to whether or when to round up or down, and how well they can estimate the next unmarked significant figure.
In the case of a radar altimeter, the pulse return-time is the only thing known with high precision and accuracy. All the rest of the necessary model parameters, such as temperature along the air path, air density/pressure, absolute humidity, platform-altitude above the geoid, and wave-form and amplitude/period of the surface are known poorly. Done properly, a propagation of uncertainty analysis of all the relevant parameters should be done for every pulse path.
You don’t seem to understand the problems any better than BJ does!
Clyde, if you go back to Brian Jackson’s reply to Willis, giving the sophomoric example of using a marked-every-foot stick to measure an “average adult male’s height” (Feb 21, 3:05 pm), you’ll see this exact verbiage:
“Now use this pole to measure the height of 20,000 adult males, recording each measurment to the nearest foot.”
Overlooking the typo, his Gedankenexperiment did not say that interpolation at the time of measuring and recording data was allowed . . . it was binary, either record the height for each male as 5 feet or record it as 6 feet.
Understanding this, there is no way that n measurements with this defined process will improve the precision of the resulting “average” height to one decimal place or more . . . all one can state definitely is that the average is somewhere between 5 and 6 feet, no matter how many measurements are performed.
“averaging of measurements increases precision” But does it increase accuracy? Especially when the measurements are of a constantly changing, chaotic surface.
WAY too many assumptions
Lets look at 10 people, 3 measure as 5 ft, 7 measure as 6 ft
The average is 5.75.
BUT….
…. a 6 ft person could be anywhere between 5.5 and 6.5ft, and a 5ft person anywhere between 4.5ft and 5.5ft
You cannot assume any particular distribution without much more accurate data.
So If all people measured were just at the top of their respective range, the average height would actually be close to 6.25m
Similarly, if all people measured were at the low end of their respective range, the average height would actually be close to 5.25m
So from the information obtained by your actual measurements, the average height is somewhere between 5.25m and 6.25m
Well, except for the fact that the high end their respective range would average to 6.49999… feet (rounded off and recorded as “6 ft”) and the low end of their respective range would average to 4.5000000…+ (rounded off and recorded as “5 ft”).
The problem with your example is your 10′ long pole isn’t always 10′. Sometimes it 10′ 3″ and sometimes it’s 9’8″ and so on. The satellite is never exactly “10′” above the Earth. It drifts up and down and you never know exactly how “long” it is.
Get a 10 foot long pole, make marks on the pole at *3* foot intervals. Now use this pole to measure *every last adult male on earth*, recording the measurement to the nearest 3 feet. You will find that the average height of adult males is extremely close to 6 foot, which isn’t even close to +/- 0.01 feet.
Whether the average of a crude measuring method happens to match the average of a more precise measuring method is entirely a function of how the population distribution falls, and taking a larger sample does exactly nothing to affect a distortion from an uncooperative distribution.
Let’s consider an easy distribution. There is a 100-sided die and you wish to determine if the distribution is uniform — let us suppose the die is fair and you are recording each result exactly. As the number of samples increase, the average will inevitably zoom in on 50.5.
Now suppose you decided measurement precision doesn’t matter to accuracy as long as you take enough measurements, and figure recording the nearest multiple of 12 (rounding up) is enough. Now the expected distribution looks like this:
0 – 5%
12, 24, 36, 48, 60, 72, 84 – 12% each
96 – 11%
As the number of samples increase, the average will inevitably zoom in on 50.88 — which is wrong! You might be impressed that the it got within 0.38 of the true answer, but that’s a function of the distribution chosen and has *nothing* to do with the number of samples taken.
Brian, you are totally ignoring the concept of significant figures.
Taphonomic, Brian’s method works when the integer round-ups and round-downs are perfectly accurate and correct, and there are a large number of measurements.
But let any instrumental limits of resolution enter, and the method fails. Systematic error is then always present and never goes away, no matter how many measurements are made.
If you measure something to one significant figure you can not get more than one significant figure out of mathematical calculations.
The answer to his thought experiment will be approximately 6 or approximately 5 depending on rounding.
Calculators and computers can take calculations out to a meaningless string of digits. That doesn’t mean they reflect valid significant figures.
Generally true, but not true if it involves the Law of Big Numbers. See my answer to Pat Frank above.
w.
Pat, that’s not entirely true. I got to thinking about Brian’s method. The problem is that the average height is 5.75 feet. This means that many more of the heights will be rounded up instead of rounded down. So his average height will be taller than the actual average
So (unlike Brian) I tested my claim. Using the average height of 69″ and the standard deviation of human height which is about 2.9″, I generated 50,000 Gaussian normal random numbers. I rounded them to the nearest foot, and I get a mean of 70.2″, more than an inch away from the true value.
Of course, when I use an average height of 5.5 feet, 66 inches, his method gives a very accurate answer …
So in addition to your condition that the “integer round-ups and round-downs are perfectly accurate and correct”, we have to add the condition that the true average is exactly half-way between the marks …
And that’s a tough condition, because the true average is the unknown that we are trying to determine …
Now, upon further contemplation, I suspect that we could use an iterative process to remove this error. It would work like this.
Determine the average using Brian’s method. He gets 70.2 inches. Then re-measure with a stick where the 12″ marks start at 1.8 inches, the amount the answer is below the next measurement above it.
That should give us an answer nearer to the true value, since now more of them will round down. Then repeat the same process with the new answer.
Hang on, let me test this … yes, that works. You iteratively adjust the nominal measurements based on the latest answer, and you can end up at the right answer. It converges pretty fast, after ten iterations it gives an answer of 69.01 inches.
Fascinating. I do love inventing new mathematical methods to pull valid answers from rough measurements.
Of course, for this to work, you need to remeasure repeatedly after changing the graduations on your measuring device. However, it seems like it could be made to work in the real world.
My best to you, sir,
w.
1.8 inches? Significantly more significant figures. Seems like you’re getting Bayesian.
If you’re going to change graduations might as well just start off with graduations of .01 ft.
Hi Willis, I had to do this exercise when Richard Garwin challenged my limits of resolution argument at the 2015 WFS meeting in Erice, Sicily.
He used exactly Brian’s argument. We had an email conversation, and I was eventually able to show him that the presence of systematic errors (resolution limits) offset the final result, making the integer mean wrong.
But the method does work, so long as the measurement accuracy is perfect and the instrumental precision is infinite (in some world in another universe). Following your description, I generated 10,000 values of 5.75±0.241667 feet, where the SD was a random distribution (0.241667 feet = 2.9″).
The mean of the double precision 10,000 points was 5.7498. I then rounded the values to a single decimal, which is where the SD made its contribution and where the variation in each value begins. The integer mean after 10,000 values was 5.7490.
With 200,000 values the exact mean and the rounded (to one decimal) were identically 5.7498.
The image shows the 10,000 and 200,000 tests side-by side. The plots are crude (especially by your standards, Willis), but I think they’re adequate to convey the point.
More data points get the convergence closer to exact. But it’s necessary to have absolutely perfect rounding. Any instrumental resolution limit causes rounding errors, inserts systematic error, and Brian’s method does not work.
By the way, Willis, I meant to add my very best to you, right back. Your posts are terrific.
Thanks, Pat. The difference is, you’re not using Brian’s method.
You are rounding all of your numbers towards their true value, just with less and less resolution.
But Brian is rounding all of the numbers, not towards their true value but with less resolution, but to the nearest foot. That’s very different, because the mean is 5.75 feet. That means that many more of them will be rounded to six feet than to five feet.
And that in turn means that the mean will be biased high.
Yes, your method works just as you say. But Brian’s method is what happens in the real world, where measurements are rounded to the nearest gradation of the instrument.
Hey, what did you think of my method for extracting a more accurate value from imperfect measurements? Seems like it could have real-world advantages.
My best to you as always,
w.
Ah, you’re right, Willis. I didn’t read Brian’s method closely enough.
Rounding to the nearest foot won’t work because one foot is greater than the limit of variability among the values.
Rounding to the nearest foot will produce far more 6’s than 5’s if the average height is 5.75 feet.
Good catch! 🙂
Best back, Willis. 🙂
You’re assuming that the 1-foot division marks on your ruler are absolutely accurate, Brian. Typically, that would not be the case.
Suppose they were good to only ±0.5 inches; 4.2% accuracy. Your 5.75 would then nominally be 5.75±0.04 feet.
But it’s worse than that. With a ±0.5 inch limit of accuracy, some measurements will be rounded off in the wrong direction. But you won’t know which ones. And there’s no way to know the round-up errors equal the round-down errors.
That means some unknown systematic error will creep into your measurements. If you don’t account for that in some way, your measurement report will include false precision.
The only way to make a correct report is to calibrate your ruler using some very well-measured standard. Then report the calibration error statistic as part of your measurement report.
I’m a strong believer in the ‘hands on’ approach to almost everything. Doing work at a distance always seems to add in errors. Tide gauges are best. They’re easily tested. Hell, we can even look at the Nile gauges to see what the Egyptians had to contend with, 5 millennia ago.
I have been either in, on, near or interacting with the sea nearly every day of my life … on three continents, over 77 years. I’ve had the good fortune of revisiting many places several times at long intervals. What I have noticed (or more aptly failed to notice) is any significant difference in sea level. Strange, that!. Don’t people look? Are they willing to just believe what they’re told? I’ve been launching my various boats at the same launch ramp for over 60 years … I’m sure I would have noticed something had changed.
Rory, you have succinctly described the difference between living life and mental masturbation. The keyboard cowboys (mental masturbators) incessantly and manically pound on argumentative minutia far beyond any relevance to the current topic. They will never quit and it is futile to try to reason with them. They are ideologically driven.
You’re right of course, but I’ll be damned if I let them have the floor to spread their nonsense unimpeded. Besides they’re often such easy targets … and smacking them around can be quite diverting (and cathartic, don’t you find?)
Excellent, Willis . . . just excellent!
I agree that any assertion to measure global SLR to an accuracy of +/- 0.4 mm/year is ridiculous, whether it be based on satellite radar measurements or on tidal gauge data.
Also, I would change the article’s title verb from “mucking” to “f**king over” the sea level data . . . but that’s just me.
Good summary, but don’t forget tides. When researching the cartographic use of navigational chart datum points, I found that sea level at any given point was once (pre-satellite) only considered established after nearly 80 years of more-or-less continuous observation and relative to the altitude of a stable land feature. Turned out that this was associated with early observation of astronomic cycles of the sun, moon, and nearer planets. Unless a raw measurement is compared to the exact same point in the lunar tidal cycle, it is guaranteed to be inaccurate by quite a lot.
Another point is orbital jitter. Turns out that within any orbit, the precise altitude of a satellite can vary quite a bit — a variance several orders of magnitude greater than the accuracy claimed for most of the sea level measurements I’ve seen. Not only are satellites affected by gravitational tides from other heavenly bodies, but the earth, not being a smooth orb, has a varying mass density at every point in the surface. An orbit, even “about 800 miles up” is actually not a regular circle, but a wavy line with variations over distance that is often greater than the surface wave height.
I’ve not seen an explanation yet as to how many islands seem to be increasing in land area, per satellite data, while the ocean rises. It does seem sumhow that dirt has a better radar return than air or water, It might be better to measure land surface area changes than ocean surface. I wonder why land surface area measurement isn’t an easy (and obvious) calibration point for sea surface measurement instruments.
There is a long tide cycle caused by the moon, peak to trough about 18 years. I forget its name; is in the SLR, Acceleration, and Closure post. So SLR change needs to be computed from tide gauges with minimum record lengths of 60-65 years according to Nils Axel Moerner, the global expert. Then to be accurate you either need a large sample (presuming vertical land motion washes out) and there isn’t one, or you need difGPS corrected tide gauges with long records. There are about 70 globally. And they show about 2.2mm/year with no acceleration. Details are in the SLR, Acceleration, and Closure post.
Saros cycle.
Rud,
It is my understanding that due to wind and river flows, tide predictions are only accurate to a few hundred mms.
Example Key West is currently out by 200mm.
https://tidesandcurrents.noaa.gov/stationhome.html?id=8724580&units=metric
This makes comparing historic peak sea levels at Individual locations impossible.
Q. But does this impact the averaging or rate of SLR over multiple tidal cycles?
Thanks in advance
“There is a long tide cycle caused by the moon, peak to trough about 18 years. I forget its name;”
Nodal precession, period = 18.6 years.
This effect produces a sine wave superimposed on the data.
For the Boston tide gauge, the start of the cycle is at ~1933 and bottoms out at ~1970 and is in a steep upswing up at ~2007, headed to a new peak ~2024. So from 1970 through to today it looks like an acceleration even though it is just the part of the sine wave on the upswing. {the tide gauge “The Battery”, in NYC is nearly identical}
NASA GISS (yes, them) published a graph of SLR *starting* in 1970!
They then claimed the upswing is true acceleration due to AGW.
Either NASA does not know that the moon governs the tides, or they were not truthful.
Either way, it does not look good for them.
Mmmm … first, the length of the “Saros Cycle” is 18 years 11 days 8 hours. The near-repetition after that time just means that the forces nearly repeat during that period. It does NOT mean that it “produces a sine wave superimposed on the data.” It just means that the forces kinda repeat.
They repeat even more exactly every 54 years 34 days, which is three Saros cycles … but once again that does NOT mean there’s a 54+ year sine wave. I discuss that issue in a post called “Time And The Tides Wait For Godot“. Here’s the 54+ year cycle of tidal forces:
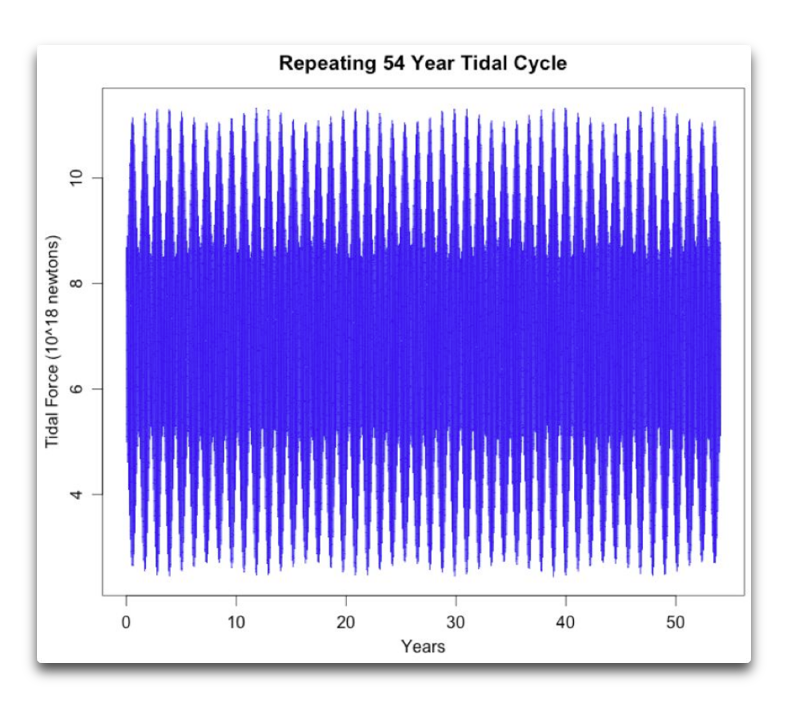
See? No 54-year sine wave, just a very complex wave that repeats after 54 years.
However, you’re right that sea levels in general swing above and below the trend line, and that if the rise is recent it is often misinterpreted as “SEA LEVEL RISE ACCELERATION!!!” by NOAA and other groups.
Regards,
w.
The Moon – Nodal Precession == 18.612958 years.
Look at my chart!
That wave is 74-75 years- Look At It. !!!!!
That is exactly 4 x 18.61 precession cycles.
Not 54 years.
Actually, when I first did this, I did not have a least squares sine wave fitting algorithm. So I used the Least Squares 3rd order and 4th order fits as a *first approximation*. The agreement between the two fits was remarkably good so I went with it. With the equations for the two polynomial fits in hand, along with the linear fit, it was a simple matter to calculate the intersection points between the curves and the linear fit.
The length of the cycle calculated out to 74.44 years +/- 10 days.
I need to say that again: 4 x 18.61 +/- 10 days. With *monthly* data. Not bad, not bad at all.
Here is the Boston tide gauge with all the fits.
The two straight lines are the linear and 2nd order fits (the acceleration).
The two curves lines are the 3rd and 4th order poly fits.
Now I agree that the ultimate waveform probably is not a real sine wave, but for such a noisy data set, Close enough. So I slapped on a sine wave and called it done.
The Saros cycle simply does not fit the Boston data.
Thanks, Tony. Per NOAA:
That is the period when the moon, earth and sun come back into approximately the same position. It is applicable to eclipses as well as the repeating cycle of the tides.
You are correct about the period of the nodal precession. However, I’m totally unclear why you think the nodal precession has anything to do with the tides. The tides are governed by the relative positions of the earth, sun, and moon. These repeat every Saros cycle, not every nodal precession cycle.
Next, as I showed above, there is no long-term sinusoidal cycle resulting from the Saros cycle.
Next, diagnosing a 74-year cycle in 100 years of data is a fools errand. Natural datasets contain a host of what I call “pseudo-cycles”, which appear, last for a while, and then disappear.
My rule of thumb is that I need to see at least three full cycles before I make a tentative claim that there is a real, stable, repeating cycle in the data. But I’ve seen cases where there are five complete cycles, cycles that then disappeared completely.
Next, you’ve used a rather crude approximation of the cycle involved. I just used a CEEMD analysis to determine the actual quasi-sinusoidal cycle in question. It has a length of 65 years 11 months …

Finally, I’d note that this cycle, which may or may not disappear over time, has a total swing above/below the trend line of ± 15 mm …
You gotta watch out for nature. She’ll fool you if she can.
Best regards,
w.
How curious.
Saros cycle gives 54 years, your CEEMD gives 65 years, and my curve fit gives 74 years.
Do we hear 85?? We need a bid for 85. Going once, going twice…..
Nice work with the CEEMD, I had not thought to look at it that way. Boston tide gauge is way more interesting than it looked at first glance. And to think all this started out with some bogus claims of acceleration from UC and NOAA.
As an aside, I did this back in 2017 and did an update in 2019. Guess what?? The data changed. Subtract one data set from the other and a very strange repeating pattern emerges. The pattern is 12 data points long so repeats every year. When another SLR post comes along, maybe I can put up what I found and we can all take a look at it.
Cheers.
Rud, thanks for bringing facts to a cat fight.
There is a NOAA measurement set that gives rise in temperature of oceans in top 0-2000m is 0.11C over the past 65 years. So gone from average of say 4C to 4.11C.
The gain in heat content is equivalent to 22 days sunlight so the slow rate of rise is a mixing issue not an available energy issue.
On average, the surface is about 16C. So if the mixing rate stays constant we could expect thermal equilibrium in about 7,000 years. I have not checked what the constant enthalpy temperature is; just assuming constant temperature top to bottom. Somewhat longer than 7,000 years if the bottom 1700m gets warmed as well.
The question that comes to my mind is – why are deep oceans so cold? They are getting geothermal heat at depth so they should be slightly warmer than the surface not cooler.
Has anyone worked out what the adiabatic temperature profile is for the oceans. That would then give a better idea of how much warming is going to take place before the deep oceans reach thermal equilibrium with the surface. If it all reaches an average of 16C then expect another 5m of sea rise.
Clearly finding missing heat in the ocean is nonsense as it is mixing rate limited and the surface temperature is thermostatically controlled.
We could accelerate the heating process by using the heat differential of about 26C between deep ocean and the tropical warm pools to make a heat engine to generate reliable electricity. About 3000m of well insulated pipe would be the main investment.
The problems with the NOAA ocean temp data are legion. Trade route biased, ship lading biased, inaccurate dart probes ( depth guesses)… covered in essay Missing Heat in ebook Blowing Smoke. We only have reasonably reliable data since ARGO. And by the ARGO design, we don’t have a real good handle on actual OHC change and resulting thermosteric rise until about 10 years into deployment, so only about 5 years ago. Hence the closure calculations proving satalt is just off.
The oceans are cold because the sea ice melts at the poles every year. This cold dense water flows equatorwards at the bottom of the ocean. See here for a discussion of the Antarctic part of the cycle.
And the geothermal heat is quite small, less than 1 W/m2, so the cold polar water stays cold.
w.
Yes – I found some really interesting work on seawater thermodynamic modelling that makes atmospheric modelling appear simple:
http://www.scor-int.org/Publications/Thermodynamic_TEOS-10_Manual_GOSHIP_19Aug09.pdf
But the simple answer is best in this case as seen in the chart attached. Another unique property of water that gives the temperature gradient at depth.
So we know why the ocean is so cold. We still do not know what the equilibrium state looks like. In fact it would be an equilibrium in steady state flows rather than any static condition.
Just think how long it would take to warm the Earth up with all that cold water sitting below a very thin warm mixed layer.
Any bottom water that was warmed by geothermal, wouldn’t stay on the bottom.
The other thing I learnt today was that there is an OTEC plant already generating electricity in Hawaii:
https://www.power-technology.com/projects/makais-ocean-thermal-energy-conversion-otec-power-plant-hawaii/
Will be interesting to get more insight into this one.
Sorry for the late reply. Willis explained. I will do a bit more. When sea ice freezes, it exudes brine. (Sea ice is ‘fresh’.) The resulting salt brines make water ‘heavier’, so it then sinks to the bottom of the Arctic/Antarctic depending on season, at the temperature near where it was created. This is called the thermohaline circulation. And the reason we know this is not massively disrupted by geothermal ocean floor energy is that it persists. For reasons having to do with seafloor configuration and continent positions, the present ‘recirculariztion’ is about 800-1000 years.
Seems like the same magic used to measure global temp to hundredths of a degree or perhaps Karl et al is just now dumping all the ship engine intake water they held to usurp the ARGO data?
I’m glad NOAA is not adding the GIA fudge factor.
I wish Aviso would follow their lead. They still add a 0.3 mm/yr isostatic adjustment (fudge factor) to all their reported satellite-measured sea-level trends. (It used to be optional, but they removed that option.)
Of course, that sum isn’t really a rate of sea-level rise (SLR). It’s what they think the rate of sea-level rise WOULD be if the ocean floor weren’t sinking. Calling it SLR is misleading.
The Rule of Thumb for adding/subtracting numbers with different significant figures is to truncate the right most significant figures to agree with the addend with the least precision.
That implies that to add a GIA with a high precision requires knowing the shape and volume of all the ocean basins to the same level of precision! I don’t believe we know the precision to that level. Our estimates probably aren’t even accurate.
Further more, in the attempt to make that GIA, the land is uplifting where there had previously been thick glaciers, decreasing the volume of the ocean basin(s) with uplift along the margins. However, at the same time, the melted glacier water is weighing down on the ocean bottoms, depressing the bottoms in proportion to the depth, thus increasing the total volume. I’m incredulous that the counteracting forces can be modeled in ocean basins with shapes and volumes known to low precision. These “Rocky Mountain High” modelers are simply having wet dreams thinking they can model to +/-0.1 mm SLR!
The 0.3 mm/year number is from Prof. Richard Peltier. To the best of my knowledge Prof. Peltier and his colleagues have not published uncertainty estimates for their 0.3 mm/yr ocean basin GIA estimate, nor for any of their other GIA / PGR figures. Tamisiea, 2011 gives a broad range: 0.15 to 0.5 mm/year.
Yes Dave a good explanation. They report what would have happened if the floor didn’t move. So non-science or fake news.
I expect when S.L. things slow down a bit they will then just add in a new adjustment “correction” to take account of what would happen if the oceans weren’t evaporating from the surface. That would really produce some scary results. Just think of the funding they could get then!
A good electronic distance meter for land surveying has a resolution of 3mm plus an about 2 parts per million. They use infrared or visible lasers emitting a pulsed beam and compute the distance to the target by comparing the emitted frequency to the returned. They require a rather focused beam. I don’t know how focused these Jason radars are or how they decide what part of the beam is used to measure but it seems to me that there must be a lot of averaging going on for each data point. But, as Willis says, they are not measuring the same point several times to improve accuracy because the surface being measured is always changing due to winds, tides currents, air pressure and likely several other variables. To add to this complex problem the geoid ( surface of equal gravitational potential) is not smooth but more like a potato. I doubt that the geoid is mapped to the accuracy they claim for sea level so I have always been suspect of the satellite sea level numbers. It did occur to me that it should detect anomalous changes and could possibly be used to track submarines.
They arent focussed. if I recall correctly from my Jason 3 post here a few years ago, the ‘aperture’ is about 10km^2. That is a lot of waves.
Areas with higher gravity would cause the oceans to pile up, while at the same time cause the satellite to drop lower in it’s orbit.
Comparing frequencies is used to measure the targets speed. To measure distance you record how long it takes the signal to return.
Yes, Doppler Shift!
Excellent
Is there anywhere that the average punter can look at the coast and see that the sea is clearly rising?
No. Only 2 mm annually (approx. 8″ over a century) is imperceptible.
Thanks. That should buy me some time to move to higher ground.
Would a place where you can see the sea level not rise be acceptable?
See http://john-daly.com/deadisle/ describes and analyzes the history behind a sea level benchmark in Tasmania that was set in 1841.
Interesting discussion
That last bit about a jump in 1950 in Sydney….. seems to have been corrected.
“Now I freely admit, I’m just a guy with no scientific training at all. I took Physics 101, Chemistry 101, and one year of Calculus in college, and that’s it. But the beauty of science is that it’s all about the facts and the evidence, and not about the qualifications of the person presenting the facts.”
That makes you better qualified IMO than many who claim to be “Scientists”.
A scientist is by definition a person who uses the scientific method to discover facts or truth.
One of the earliest fathers of the scientific method was Ibn al-Haytham. He was the first to develop hypothesis by experimentation/observation. He wrote:
“The seeker after truth is not one who studies the writings of the ancients and, following his natural disposition, puts his trust in them,” the first scientist wrote, “but rather the one who suspects his faith in them and questions what he gathers from them, the one who submits to argument and demonstration and not the sayings of human beings whose nature is fraught with all kinds of imperfection and deficiency.”
IOW a scientist must be a skeptic that must develop/confirm his/her hypothesis by experimentation and observation and not base it on the supposed research of others alone.. If a person is not a skeptic then they aren’t a scientist no matter how many degrees or titles they may have.
The so called field of “climate science” is filled with people that rely on nothing more than computer models. Models that have without fail have been terribly inaccurate in their projections so far and yet they still treat them as valid scientific evidence. They are NOT scientists. They’re leaches working flawed academic and government systems for self enrichment.
The most dangerous phrase written by so called journalists today supposedly reporting on climate change is. “Scientists say”.
There is also the problem that one cannot find a number for the mm of sea level change per degree C change in atmospheric temperature. Just one of a dozen missing numbers that are fundamental to global warming hypotheses.
https://wattsupwiththat.com/2020/09/11/the-dirty-dozen-tests-of-global-warming-science/
Geoff S
Just out of curiosity how do they account or adjust for swell, waves, and tide ect. much of which depends on sun, wind, near by and direction of storms or weather fronts or condition. Just wandering.
P, see my guest post here a few years ago on Jason 3, if I recall correctly titled “Sea level rise from satellite altimetry—fit for purpose?” It was requested by Charles, and It went deeply into all the details you seek. See also my post on successor satellite Sentinel-6, which looked at the ‘improvement’ and concluded still not good enough. WE has this nailed.
Rud, your post is here, along with your great graphic explaining the difference between accuracy and precision, which I am definitely stealing.

Thanks,
w.
From Wikipedia referencing NASA information on Jason-3: The scientific goal is to produce global sea surface height measurements every 10 days to an accuracy of less than 4 cm. In order to calibrate the radar altimeter, a microwave radiometer measures signal delay caused by atmospheric vapors, ultimately correcting the altimeter’s accuracy to 3.3 cm.
So they measure the same spot once every 10 days, accurate to 3.3 cm. And they call that more accurate than tide gauges?
An orbit takes 112 minutes. Does anyone know how many data points they get per orbit?
There are 1436 minutes in a sidereal day. Divide by 112, and it appear that there are only 12.82 and a long string of small numbers of orbits in a day. The question is, how many orbits will it take to be a whole number of days? That is the next time when the satellite will be over the same point on the earth’s surface. Exceptions: if (a) the satellite is in exactly the equatorial plane, or (b) the satellite is at the level where it is permanently above some point on the equator. Obviously (b) is restricted to measuring the height above that one spot, which would give a fair estimate of sea level rise for that one spot. But over the years it would give a good estimate of the variability caused by wind, humidity, temperature, and any other atmospheric variables over that spot. Useful to calibrate the atmospheric variability for the other satellites!
Jason-3 took 9.9 days to get back over the exact same spot, so basically 1 measurement of 1 spot in the ocean every 10 days. Difficult to believe that there isn’t going to be huge variation, for starters.
The radar has a pulse rate that gives X number of “snapshots” per second which can be merged into a visual, but are individual data points. For Envisat, that pulse repetition frequency (PRF) was 1984 pulses per second. From those radar returns they calculated the sea level along the orbit track. Jason-3’s orbit was 112 minutes, so the speed of travel along that track was 40,000 km (circumference of Earth) / 112 minutes = 357 km/min. = 5.95 km/sec. = 5,950 m/sec. If Jason had the same PRF as Envisat, 1984 pulses per second, it would obtain measurements of sea level that were (5,950 m/s / 1984 pulses/s) = about every 3 meters apart, and 20,000 measurements as in the “example” above would take 10 seconds of orbit time and stretch 59.5 km. in a straight line. Doubtful to me that you can average any of it to get accuracy better than a couple of centimeters. That said, I don’t know if Jason has a faster pulse rate than Envisat. Still looking.
You also have a pointing error. The radar lobe is rather narow. A 0.1 degree pointing error gives 0.15 m too long measurement.
According to “Attitude Determination
and Control System” https://ntrs.nasa.gov, 0.1 degree is a high end requirement.
Some clarifications, which I hope help:
The precision of a measurement process is the degree of agreement among measurements. Precision is more or less synonymous with Standard Deviation. In theory the SD should shrink with increasing number of measurements. The opposite of precision is imprecision.
The accuracy of a measurement process is the degree of agreement of a set of measurements with the True Value of the quantity being measured. Accuracy cannot be determined if the True Value is unknown. Calibration (with known True Values) is the method used to improve the accuracy of a measurement process. The opposite of accuracy is bias.
Repeated measurements of an unknown value may have high precision but still be biased. Measurement errors (aka systemic errors) can lead to bias if the mean of many separate measurements differs significantly from the True Value.
The satellite data appear to have bias. Both sets may be precise (or not — the SD’s are not given nor are the number of repeated measurements at any one point), but they differ in means. Either a phenomena occurred in which sea level rise suddenly changed in 2010, or one or both sets are biased. The True Value remains unknown.
Willis, how come when I shoot, I only get 2 dots at most ? 😉
That graphic is a keeper. Thanks for reminding me of it.
I believe the original source for that graphic is here:
http://www.antarcticglaciers.org/glacial-geology/dating-glacial-sediments-2/precision-and-accuracy-glacial-geology/
I modified it slightly, to make the “low accuracy, low precision” example less accurate, and the “high accuracy, low precision” example a bit less precise, and also to add their requested attribution; click here to enlarge it:
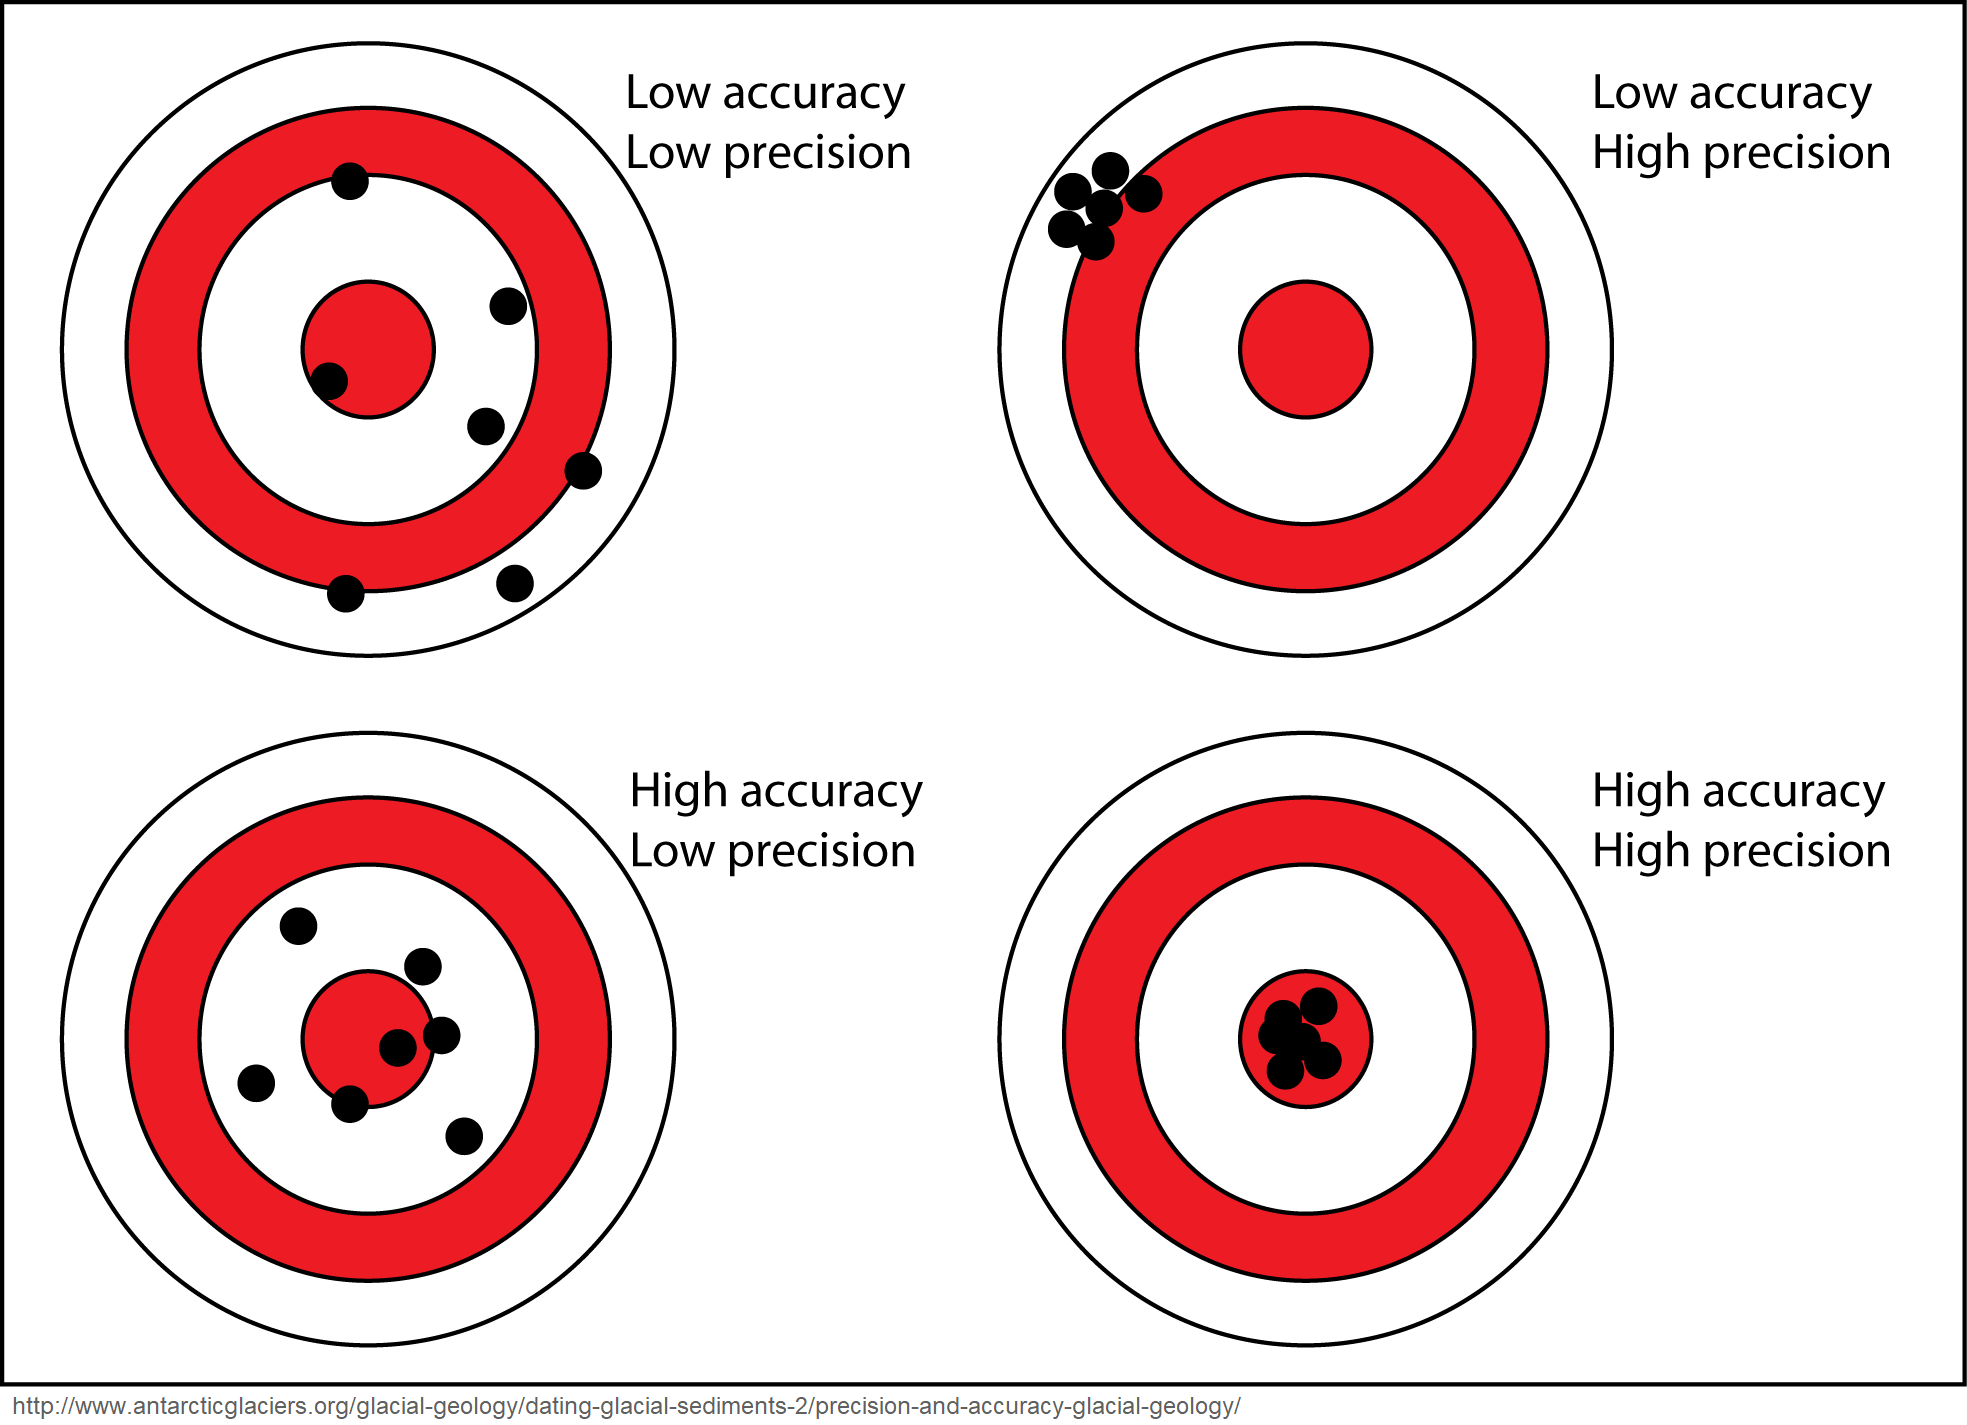
The problem is that if you remove the painted target, and are left with only the arrow holes (measurements), then you can’t tell the difference between the top row and the bottom row. When multiple measurements are highly consistent, that gives confidence in their precision, but if there’s systematic error in those measurements then their accuracy may still be poor.
OTOH, if your measurements are all over the place, that proves that they are of low precision, but they still might be of good accuracy. If you somehow know, a priori, that they are of high accuracy, and if you can take a large number of measurements, then you can reliably “find the bull’s eye” simply by averaging those measurements, even if few of the individual measurements were on target.
The problem is the temptation to simply assume that the measurements are of high accuracy, out of optimism, or because that makes it easier to justify your grants. That’s how you can end up reporting erroneous results.
Many, many things in climatology look like that. Measurement of sea-level by satellite altimetry is an obvious example, but there are many others.
For example, as reported in AR5, the CMIP5 climate models assume a wide range of values for even such fundamental parameters as radiative forcing from a doubling of CO2 (ERF), and climate sensitivity (TCR & ECS).
https://sealevel.info/AR5_Table_9.5_p.818.html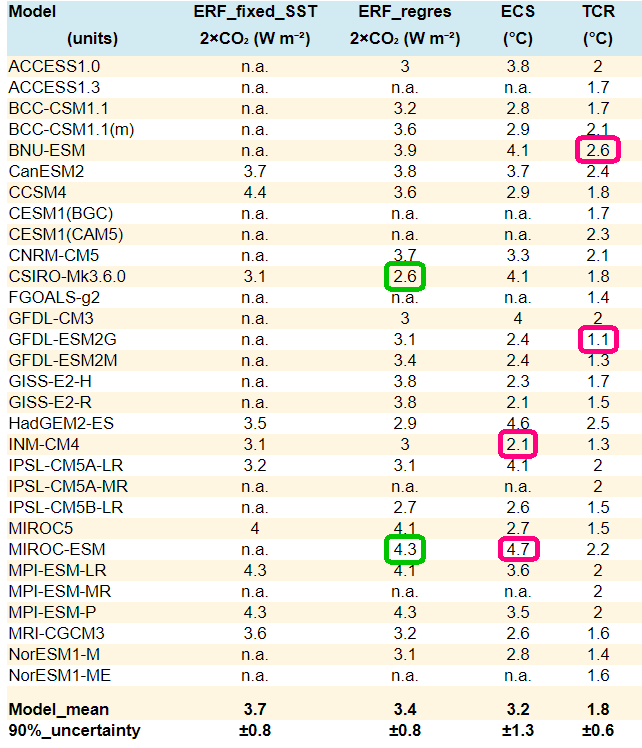
EXCERPT:
That proves that those parameters are known with poor precision. Yet alarmist climate modelers assume that by averaging the models’ outputs, they can nevertheless “find the bull’s eye.” That means they’re assuming high aggregate accuracy of models’ long-term (and thus effectively untestable) predictions, despite the known poor precision of the models’ internal parameters. There’s really no evidence to support such an assumption.
Thanks very much.
Willis – This brings back ancient memories. Years ago I worked on ICESat-1 with Scott Luthke. The GIA accuracy numbers aren’t looney and I do remember going through them 20 years ago, but I can’t remember the process now for the life of me. The bigger issue and the source of the arguments is the assumptions going into the GIA estimate. I’ll have to go consult the ancient records.
Too bad you can’t grep dead trees. Your search would be faster if you could.
Please do consult your ancient records. I’d be interested in how such high precision is rationalized.
Satellite could say sea level is rising by 1 meter a day, but if the tidal gauges don’t change, then who cares. The gauges give information relevant to the concerns. The satellites do not. IMHO, when the satellite data is cited, it is usually in the form of a FOC attack.
Fear instilled by graphs procured by
Obscure methods, cited by people with impressive
Credentials
Mr. Lee wrote, “The gauges give information relevant to the concerns. The satellites do not.”
True! It is not often mentioned in the climate alarmist community, but satellite altimetry is incapable of measuring sea-level at the coasts — which are the only places where it matters.
You might think that doesn’t matter, but it does, because some factors affect sea-level ONLY at the coasts (and not out at sea), and others affect sea-level ONLY far out at sea (and not at the coasts).
For instance, thermal expansion of the upper ocean causes “steric” sea-level rise where the water warms, but it does not affect sea-level elsewhere. That’s because gravity balances mass, not volume. That’s easiest to see for icebergs, but it’s true for anything which affects water density:
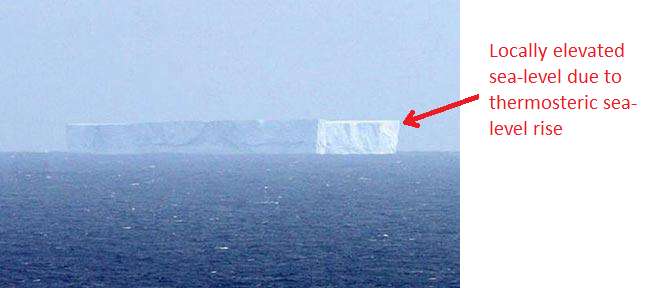
So, for example, an area of warm water in the Indian Ocean can cause sea-level rise detected by satellite altimetry, without ever affecting coastal sea-level, at all, anywhere. Variations in sea-level trend caused by that have no relevance to any practical concerns.
<b>Warning,</b> historical and pedantic note follows:
From the [nearly] authoritative source, The New Hacker’s Dictionary, comes http://www.catb.org/jargon/html/M/mung.html:
Of course, as old DEC (PDP) computer users should know, the MUNG command runs the text editor (and general purpose programming language) TECO, and has it read in and execute a TECO program to mung the file that needs to be munged.
See http://www.bitsavers.org/pdf/dec/teco/MobyMunger_%233part1_Aug79.pdf for more. I have dinner (now a Zoom meeting) with the author, Stan Rabinowitz, every month.
Thanks, Rick, most interesting. Meaning 2 is the way I always heard it, but I couldn’t find it in the dictionary.
w.
Does that mean mung bean sprouts are really GMO? Heavens to veganism! 🙂
“I’ve been programming computers since 1963”. COBOL? You’re like me a fossil remnant. As an engineer, I started with FORTRAN in ’63. Ahh…
But, now more to the point, as far as we humans are concerned, doesn’t the tide gauge data be the ONLY significant data? If we’re rising too?
Frankly there’s a large amount of hubris in much of these prognostications.
Previous should of had a Willis in front. My bad.
Willis, a minor quibble here. One part in 10E10 is not that difficult for a timing measurement, and with care that can be bettered by a couple of orders of magnitude. The other sources of error that you mentioned are cause for concern.
Thanks, Erik, but this is the reason that I ask folks to quote what they’re talking about. I have no idea what I said about a “timing measurement” that you are discussing.
Care to clarify?
w.
Willis,
“So to measure the change in sea level to the nearest tenth of an mm, we’d need to be able to measure the distance from the satellite to the sea surface to a precision greater than one part in thirteen billion … and that is a hard challenge even in a controlled laboratory setting.”
Mea culpa – you didn’t specifically mention timing. My recollection is that the earth moon distance has been measured to close to that level of relative precision using retroreflectors from the Apollo program. It does help that the retroreflectors are essentially stationary with respect to the moons surface, but the same thing cannot be said about the actual ocean surface with respect to the mean sea level.
just btw kerry does not own a yacht . he owns several yachts and numerous mere boats .
Willis, it’s a good thing you didn’t get more education. You might have ended up much dumber. As my father would say, “Educated FOOLS”. Appropriate for many of today’s so called scientists. Common sense will win.
“As my father would say, “Educated FOOLS”.”
I’ve come up with a neater version: “No fool like a wise fool.”
It won’t if the foolish people control the military.
Similar to how there was such a desperate need to be rid of Mr Trump, The Need for Sea Level Rise (SLR) is equally urgent.
Without SLR, the whole Global Changing Warming Warm house-of-cards collapses and for manifold reasons:
1) ‘Everybody‘ knows that warm things expand. Thus SLR = expanding ocean and all other things being equal, it has to ‘rise’
OK BUT, only El Sol can heat the water. Sol’s output is claimed to be by all parties so therefore doesn’t count.
Warmists then want their Cake & Eat It by asserting more water vapour (to actually create the GHGE) in the atmosphere – which can only cool the water because of greater cloud cover.
2) Radiation from CO2 cannot warm the water, CO2 simply doesn’t radiate at the temperatures involved. It has zero emissivity
3) What little radiation there is coming from the atmosphere ## cannot warm the water without perfectly munging the whole idea of Entropy. It requires Heat Energy to flow up a Thermal Gradient
## Take average Troposphere temp to be minus 15 Celsius, emissivity of Oxygen/Nitrogen to be 0.02, you get downwelling power of 5.02 Watts per square metre
4) Even if energy did get into the water, it would float on the top 100 metres and not cause a bulk expansion. By floating on the top, extra energy would very promptly dissipate exactly as happens inside El Nino. The energy would physically go up into the atmosphere and down the thermal gradient, even if just a few 10’s of metres, from where it can NEVER return, without violating the Law of Entropy.
5) Alert readers might wonder and should demand to know why the ocean expands when it gets warm whereas the atmosphere is not allowed to expand.
They will demand an answer as to why the atmosphere simply doesn’t expand to ‘disappear’ the Trapped Heat in that means instead of staying a fixed volume and getting hot.
Yet more perfectly good, rock-solid and long established Physics is required to be munged.
Good grief and especially for peeps SO CONCERNED about Temperature , the expansion of Ideal and near Ideal gases was/is the very basis of THE most accurate thermometers ever made.
Conclusion & Theory time:
You all know me, what SLR there is is coming from Soil Erosion, the creation of new desert, thus:
So you see (sea haha) SLR is The Sacred Cow that has to be kept alive at all costs.
The whole of Climate Science is riding upon her back and as we see from their science, their politics, their (anti) social media presence, no trick is too low or too dirty.
As Mr Trump discovered to his political (and personal?) cost
Well put, peta.. let me add a bit.
3) The only way you can measure CO2 radiation frequency bands is by creating conditions of negative temperature gradient, by using a strongly cooled receiving sensor.
At atmospheric pressure, the mean free path of any CO2 radiation is measured in 10’s of metres, so anything in that frequency band is only from less than 100 or metres away.
4) Evaporation caused by any radiation would actually cause the water surface to COOL slightly.
SLR is also due to our mining of fossil water.
Fort Denison will slip under the water any day now ..
…or maybe in several thousand year !!
Got to thinking about it, and realized that my main objection to Brian Jackson’s comments (other than the snarky tone) is that he hasn’t answered my main question.
This is, if averaging can increase the accuracy of the sea-level rise results to the required level as he claims, and if none of my objections to that claim are true, as he says over and over … then why does the trend make an instantaneous step change from 2.5 mm/year from the first two satellites, to 4.1 mm per year from the third satellite? I mean, if there are no issues as Brian claims, then why that huge anomaly?
w.
I did laugh when I said “What if one of the 12″ marks on your measuring stick is off by an inch”, and his response was “Seriously Willis, as a professed builder of his own home, you can’t tell me that a tape measure can’t make 1-foot markings?”… dang, bro’, avoid the point much?
They actually started “adjusting” past data when they changed from Topex to Jason 1
I guess they just found ways to keep doing it
Here is 2003 data overlaid over data from 2000, more than DOUBLING the trend !!!
About the same time all the manifestly FAKE “adjustments” in the temperature data started to happen.
OOPS….. 2000 data over-laid on 2003 data !!
Fred, what is the source of the two datasets?
w.
I had to look up the definition of “Pissing Contest” I was also reminded about the Uncle Remus tale about Brer Rabbit and the tar baby. Over at Roy Spencer’s blog there’s an ongoing argument about whether the Moon rotates or not. Well that’s my editorial comment.
Here’s a graph of the changes Colorado University made to their sea level data up to 2016:
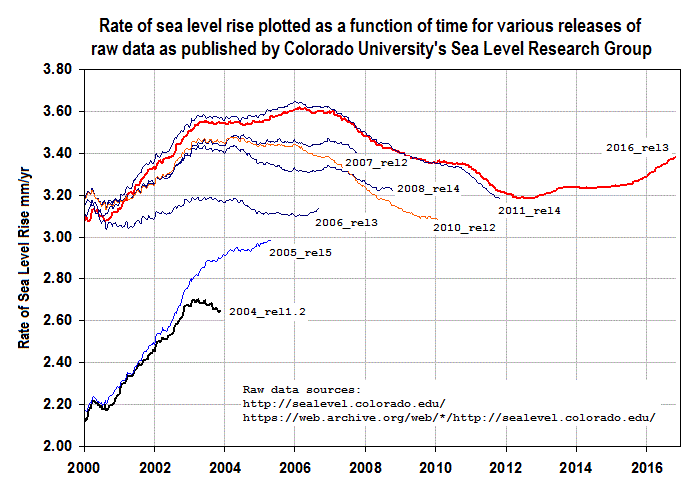
Each plotted point represents the rate of sea level rise since the start of the time series in late 1992. I can only conclude that over time the historical data has been rewritten.
The last two installments since 2016 have increased the acceleration from 0.084 to 0.097 mm/yr² I feel like the bank examiner trying to figure out where the money was embezzled.
Willis,
I just went back to check BJ’s claim, and he does claim that multiple measurements can improve the accuracy. I think it is he who does not understand the difference between accuracy and precision.
And these same people presume to tell our ancestors that they did not how to measure temperature and “correct” their readings.
Clearly moderns have not been able to workout how to climb to shoulders of giants!!
Acceleration explained as change in change.
https://tidesandcurrents.noaa.gov/sltrends/sltrends_station.shtml?plot=50yr&id=9414290
Looks like a 70-80 year oscillation. Its interesting that error ranges increase over time, with the ‘present’ being more uncertain than the ‘past.’
Willis, That is a great article, and the comments are illuminating too.
I am intrigued by the satellite calibration. The lakes that are used to verify the height of the satellite must be very special, No doubt guarded at all times to avoid any variation in their surface taking place.
They must also be static with no ground uplift or sinking taking place. They must be free from any wind heaping up water at the moment the satellite comes over to take its height fix.
The risk of unknown variation being introduced is endless even the beavers pushing his freshly chewed log might get in the way.
Even the back of all those turtles we rely on to keep us up might vary, who knows…:)
There is acceleration but it is caused by ENSO.
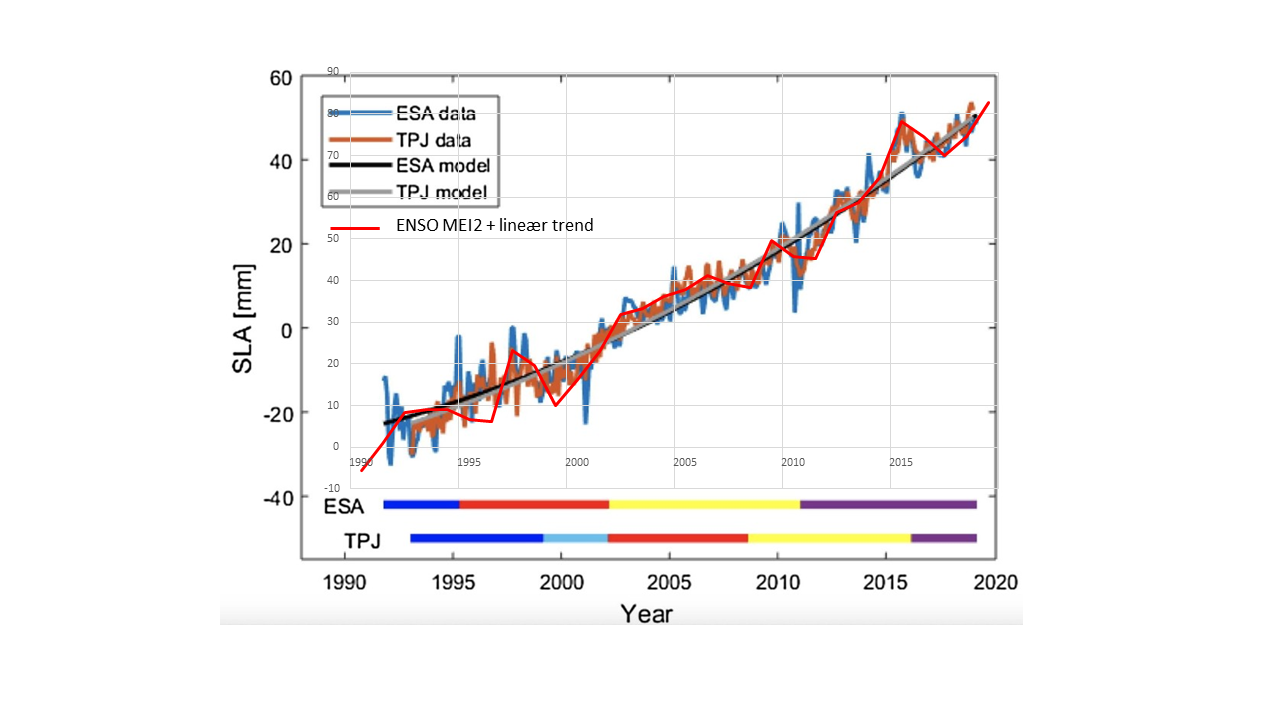
I think one of the problems with the chart is that it doesn’t show the error bars. With them any statement about a trend so small as to show acceleration would be meaningless.
Motto of climastrologists: We don’t need no stinkin’ error bars!
different parts of the world have different sea level rise – or fall,
it looks like the first two satellites were inspecting one part of the world and the other pair another place.
i refer to nils axel morner https://www.researchgate.net/publication/284392946_The_great_sea_level_humbug_No_alarming_sea_level_rise
To mung, we can add “ming”.
(No – not Ming the merciless.)
“Minger”
noun British Slang.an ugly, unpleasant, or smelly person or thing.
The munged-up sea level (and global temperature) record is a minger!
It mings!
Since it was munged.
The minging mungers have munged it into a minger!
The Dutch know this stuff very precisely. The tidal gauges on the North Sea show a sea level rise of 1.9mm/yr ever since systematic measures began (in the 1870s). The North Sea is in open connection with the Atlantic, which is in open connection with the Indian Ocean, which is etc. with the Pacific. There was a bloke in Syracuse 2 millennia ago who figured that that means that in all those waters the rise has been 1.9mm/yr, give or take a tiny correction because the geodetic surface is not an exact sphere.
If measures from satellites give a different answer then there is something fundamentally wrong with such measurements.
Sydney’s Fort Denison is on a highly stable geological area.
SLR is about 1mm/year, with no acceleration
Fort Denison is an almost exact match for the data from the Bondi Baths Stilling pool.
oops, got the colours mixed up..
Sorry, Fred, but that’s not true about Sydney being stable. There’s a very good analysis of Pacific tide gauges and GPS levels in a post called “Relative sea-level rise and land subsidence in Oceania from tide gauge and satellite GPS“. From the Abstract:
Recommended reading for anyone interested in the issue.
w.
Wonderful, thanks for the reference Willis. Interesting stuff.
The tide gauges I am familiar with are typically situated in somewhat protected waters having access to the sea. The water surface is thus much smoother than what would be found by satellite measure on the open ocean. How exactly does the satellite iron out all of the surface variation (wave, chop, ripple) caused by wind?
accelerators are also supposedly a group of troublemakers causing homeland security issues by starting violence IN usa rallies etc also then linked(supposedly) by cia or fbi to some twerp in russia
sheesh facepalm roflmao
Agreed that sea level measurements with satellites cannot possibly be accurate or precise to within 0.1 mm or less from a satellite orbiting 830 miles above the earth, measuring seas that constantly vary in height by meters over time and distance.
The other factor of course is that sea level rise is a function of multiple processes, not just ice melting or thermal expansion of the oceans. The earth’s crust is in constant motion, due to plate techtonics, which has to effect sea level. And erosion and dissolution of the land surface constantly adds material to the oceans. Tidal forces, or course, play a role, as do ocean currents and prevailing winds. Every geologist certainly understands that, if not the so-called “climate scientists”.
And there is no possible one single worldwide number that can be used to represent the net effect of crustal rebound after the last glaciation.
It is commonly known that land is rising in the north because the glaciers melted. What is out of sight, and therefore out of mind, is that if the volume of water in the oceans is increasing from melting glaciers and mining of ground water, then the extra weight, particularly in the deepest waters, will cause the upper mantle to respond by sinking deeper, thus increasing the volume of the ocean basins.
And then there is the issue of the mid-ocean spreading centers introducing new rock, which if it isn’t compensated by subduction, will result in a decrease in ocean volume.
It is a very complex problem, and without detailed maps of the shape of ocean basins, and measurements of rate of production and destruction of ocean floors, there is little hope of measuring Glacial Isostatic Adjustment to 0.1 mm.
The important issue is whether people will be inconvenienced by a transgressing shoreline. That appears to be more a factor of local subsidence than SLR.
I agree with you in general, Duane. In term of mankind’s concerns in the foreseeable future, however, tectonic movement and erosion are miniscule.
GPS satellite orbit ephemeris is accurate to about 5 cm, updated by range tracking amongst 8-12 remote tracking sites (Diego Garcia has one). This level of accuracy is required for the p(Y) code capable military GPS receiver applications (offensive and general navigation).
Air Force Satellite Control Network – Wikipedia
What isn’t so straightforward is adjusting the raw radar range data with “models” to compensate for:
To get sub-cm level accuracy is a bit of a stretch, actually.
“It’s been going up at on the order of eight inches (200 mm) per century for quite some time, and there’s no sign of any change in that rate of rise.”
Well it’s running uphill a lot somewhere else then-
“One of the oldest tide gauge benchmarks in the world is at Port Arthur in south-east Tasmania. When combined with historical tide gauge data (found in the London and Australian archives) and recent sea level observations, it shows that relative sea level has risen by 13.5 cm from 1841 to 2000.”
:: Sea-level Rise :: CSIRO & ACECRC ::
And when the CSIRO munge it the best they can come up with is-
“We have used a combination of historical tide-gauge data and satellite-altimeter data to estimate global averaged sea level change from 1880 to 2019. During this period, global-averaged sea level rose about 25 cm, with an average rate of rise of about 1.6 mm/yr over the 20th Century. The sea level record indicates a statistically significant increase in the rate of rise from 1880 to 2019.”
And I’m telling you this ancient weather worn continent of Gondwanaland aint moving anywhere in relation to the oceans surrounding it-
ANCIENT GIANT UNDERWATER REEF FOUND IN NORTH FLINDERS – Coober Pedy Regional Times (cooberpedytimes.com)
And it has generally warmed (naturally, from the LIA) from 1880 to 2019. The “acceleration” is undetectable.
The most sage advice I can give to these modern day sundry climastrologists and clairvoyants is simply this. If yer gunna paint the house use something a lot better than Covid masks while you’re sniffing the turps-
Adelaide’s Tidal Wave. The One That Never Happened | Adelaide Remember When
‘We'(the left) listen to the ‘Scientist(our Scientist). You pay these useful idiots to give you what you want, they make a mockery of real science. Just like Tycho Brahe trying to keep peace in the church over Earth centric universe. Make up your own facts(Climate Gate) for the desired outcome to satisfy and keep your income!
For years it was too much of a coincidence for me to believe that the start of acceleration of SLR miraculously happened exactly when the shift to satellite happened. You have given a great insight into why.
This is one of the best posts I’ve read over the last 10 years. It was a wonderful aha moment.
Thanks
A large part of this thread has been a defense of the fallacy that averaging measurements can’t improve the precision. That a thousand measurements can only have the precision of one of them – or the least precise of them. This is horribly wrong. Where to start? GPS measurements for instance increase accuracy by using multiple measurements from several satellites to interpolate a more accurate position.
Arguing against this is like arguing for a flat earth. And don’t go diving into distracting detail about distribution models and statistical arcana. Even with non normal or skewed distributions, a mean of measurements is going to improve on the precision of a single measurement. The exception proves the rule. The presence of error doesn’t mean that the universe doesn’t exist. That’s the smoke-screen argument tactic used by warmists to hide the big holes in their case, no need for us to copy that.
The fraction of girls or boys in a population is about 0.5.
For this to be true, it must be the case that all babies born are 50% boy and 50% girl.
We couldn’t have the precision of the average being different from the precision of any single case, could we now?
So now we’re on board with the LGBQ-trans lobby – how nice!
Maybe one of the “W” s of WUWT should change to “woke”?
Woke up with that? 🙂
Hatter Eggburn February 22, 2021 9:41 am
First, precision is the spread of the individual actual measurements. This can’t be changed by averaging, because it relates to the spread of the measurements themselves. You mean that averaging measurements can improve the accuracy, which is how close we’re getting to the actual value.
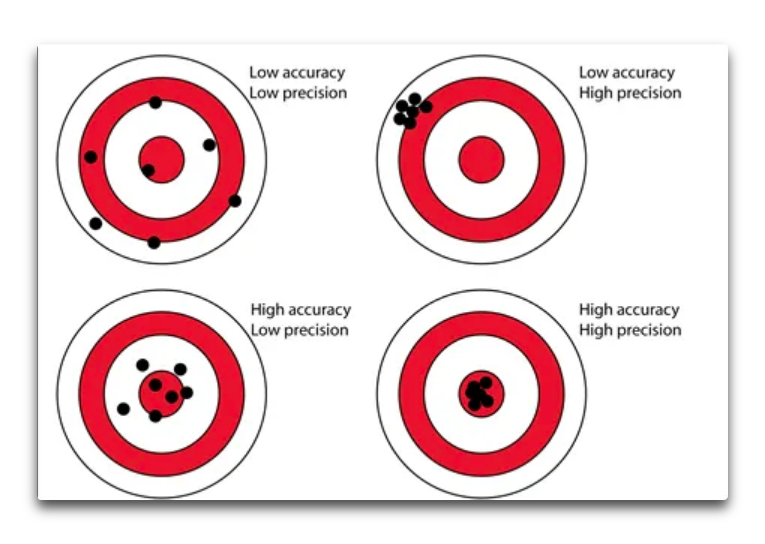
You continue:
Not true, even given that you’re wrong about “precision”, you mean “accuracy”. (A single measurement has no “precision” because precision is the spread of repeated measurements).
For example, suppose we have a measuring device that always measures 2 units too small. If we average a hundred such measurements, the result will be 2 units too small … averaging absolutely will NOT improve on a single measurement. And this is not some “distracting detail”, it is a real, valid, and important issue that has to be considered for any measuring device.
These questions about distribution models and the like are not “statistical arcana” as you falsely assert. For example, if the distribution of what you are measuring is NOT symmetrical, averaging will not give you a valid answer.
For example, I showed elsewhere in this thread that human height is not symmetrically distributed.
Brian Jackson claimed:
Here’s the actual distribution of human heights, with an average height of about 5’9″.

So I generated 50,000 random numbers with that actual distribution and a mean of 69″. That has a standard error of the mean of 0.02″, because there are so many random numbers.
But using Brian’s method of rounding to the nearest 12″, it gives us a mean of 69.4″ ± 0.02″, which is an error of almost half an inch. And increasing the number of measurements does NOT bring that answer any closer to the true value.
Heck, Brian’s method doesn’t even give us the right answer even if the distribution is symmetrical. The problem is that the average height is 6.75 feet. As a result, many more of the heights will get rounded up to 6 feet than get rounded down to 5 feet. This means that the average using his method will be taller than the true average. I just tested it with 50,000 random numbers simulating the height distribution (mean = 69″, standard deviation = 2.93″). His method gives an average height of 70.2 ± 0.02 inches … a full inch out from the correct answer. Brian’s method is out by an inch even using his assumption of a normal distribution.
Not only that, but suppose we round the heights to the nearest two feet … that gives us an average height of 71.4 ± 0.02″, even worse. And again, using more measurements doesn’t bring us one iota closer to the true value.
So I’m sorry, but these questions are NOT “statistical arcana”. They are crucial questions that have to be asked before we start averaging data and proclaiming an answer.
Best regards,
w.
If Brian’s nearest foot-only estimate is out by only half or one inch, how does that not just prove Brian’s point?
Anyway this is already beyond my statistical pay grade.
Hatter, Brian’s claim was:
Unfortunately, his answer was wrong. All he did was prove his misunderstanding of statistics.
w.
“This is horribly wrong. Where to start? GPS measurements for instance increase accuracy by using multiple measurements from several satellites to interpolate a more accurate position.”
And precisely how many satellites at any one time are focussed on the particular point of the wave to triangulate and check the vertical distance being measured? Oh that’s right they can’t do that simultaneously and if you stuck 2 vertical tape measures a metre apart on the same satellite would they ever agree?
You could try it yourself with 2 lasers on a sturdy frame a metre apart out off the beach next time you’re down there and see if you can get the measurements to agree anytime they’re both triggered together. How far above the sea level are the lasers fixed? Can you tell us to the accuracy of the lasers?
That average annual SLR at Port Arthur tide gauge is 0.85mm/yr but you reckon you could detect that in any year or 2 or 3? What hubris some folks have and they reckon they’re gunna change the climate to what they know it’s supposed to be to boot. We had special places for people like that but now they walk among us and congregate in universities with compooters.
If the proportion of boy babies to girl babies were 50/50, we’d have a large imbalance in favor of girls. Please keep your examples in the realm of factual.
Standard error is standard deviation divided by the square root of number of measurements.
So precision is increased (standard error decreased) by more measurements.
OK assuming this and assuming that and taking away the number you first thought of…
Willis, connect the dots. The Hockeystick shows a dog-leg at 1902. If temperature rapidly reversed in 1902, sea levels should have been falling up to 1902, and then rapidly start rising post-1902. There is no dog-leg in sea levels, so either the Hickey Stick or the Sea Level data is wrong and is non-confirming. How can temperatures rapidly increase and sea levels not?
There actually is a dog-leg in sea-level data around 1850. Before that sea-levels had been falling, after that they started rising.
At a remarkably steady rate.
Ironically, the Sea Levels look to have a reverse dog-leg starting just about 1902.
https://www.climate.gov/news-features/understanding-climate/climate-change-global-sea-level
GIA calculations are extremely uncertain. They are probably reasonably correct for Northern Eurolpe where there is a large body of measurements of relative sea-level going far back (>250 years), a dense network of GPS stations and where the glacial history is well known.
Data are much more uncertain in every way in North America and Greenland, and very sparse in the most important area, i e Antarctica. The glacial history there is very uncertain, GPS station are few and far between, and there are of course no GPS stations at all in areas covered by ice (they must be on bedrock). And what is worse <i>none</i> of the GIA models come even close to matching the limited actual data there is. For an example look at figures 9 and 10 in this paper:
https://www.semanticscholar.org/paper/A-new-glacial-isostatic-adjustment-model-for-and-of-Whitehouse-Bentley/b8b0c52546304964f79406ff9a49b0d8bc43e9a3
The correlation chart between predicted and actual values looks like it had been done with a shotgun at long range.
And of course we have no data att all for ocean areas, which are the important ones for sea-level adjustments. There are no underwater GPS station, only extrapolations of already shaky land data. ”It´s models all the way down”
The sea level is widely imputed to be a serious threat. The danger is depicted on the cover of the National Geographic shown above, with the Statue of Liberty half under water. Almost invisible and just above the water level, is the legend :”NO ICE”, implying that is the level when ALL ICE on the Earth has melted. Since melting all ice in Antarctica and Greenland (mountain glaciers are negligible) raises the sea level by over 80 meters, and thermal expansion would add another 5 meters, at least, so the artist’s impression is grossly inaccurate.
ONLY half of the torch would be above water! Moving along…
Whether the sea level may be rising or not is NOT the important question.
The important question is whether land is being submerged BY the sea? The answer is well known. NATURE CLIMATE CHANGE , pg 810-813, VOL 6 | SEPTEMBER 2016,www.nature.com/natureclimatechange. The COASTAL land area has increased by 13,000 km2 in the past 30 years.
OK, you say, but what about all those Pacific islands being inundated? The National Geographic article: https://www.nationalgeographic.com/news/2015/02/150213-tuvalu-sopoaga-kench-kiribati-maldives-cyclone-marshall-islands/- addresses the issue.
It turns out that 80% of the coral islands in the Pacific and Indian Oceans are stable or gaining area, while 20% are losing area. The 20% losing area are overpopulated, with groins – sea walls- i.e. islands where natural nourishment is inhibited by HUMAN STRUCTURES. One Congressman famously asserted that islands were being tipped over by human structures.
That effect is NOT known.
It is often asserted that coastal cities are threatened by rising seas. In reality, it is sinking cities near coastal areas; due to withdrawal of ground water faster than it is replenished.
Jakarta is a prime example.
Measuring the eustatic sea level is insecure since the signal is buried among: diurnal and semi-diurnal astronomical tides, long period tides, Chandler Wobble effects, Lunar node tides, changes of atmospheric pressure (e.g. polar front pressure centers, hurricanes, winds causing storm surges, persistent winds, evaporation and precipitation, changes in ocean surface topography, the El Nino Southern Oscillation, Kelvin-Rossby waves, seasonal water balances among ocean basins, seasonal variations in water slope, river runoff/floods, seasonal water density changes due to temperature and salinity, seiches, tsunamis, thrust earthquakes altering the ocean floor, thermal expansion-contraction, glacial melt or growth, terrestrial water storage, sediment deposition, and more. ALL these effects are larger; most are MUCH larger than the measured sea level anomaly. Possibly, a sea level anomaly of 2-3 mm/year IS measured and interpreted accurately, but it is equally possible that confirmation bias is clouding the reality.
Although relative sea level measurements exist before 1750, those prior to ~1880 are routinely ignored. The earlier DECREASE in sea level is not consonant with the current narrative.
According to Gavin Schmidt, the current administration’s science advisor, https://www.studlife.com/news/2017/09/21/wash-u-hosts-climate-change-panel-continues-push-toward-increased-sustainability-on-campus/, since 1980, climate change and associated anomalies are 100% due to humanity. That raises the fascinating question of both the origin and sudden cessation of all prior anomalies in the climate system of which sea level is one aspect that is used to frighten people needlessly.
A related issue arises in OHC data from ARGO where a 0.02 degree temperature change is presented in units of 1022 joules over depths of 700 m or 2000 m. This unit obscures the tiny temperature changes putatively being measured. The ARGO I and II measurements may represent a sensor calibration error issue more than a temperature change.
Willis, isn’t the GIA adjustment mixing volumetric measure (ocean basin volume) with linear measure? I think ‘sealevel’ will wind up somewhere up above the real ocean this way. This is not how the system works.
If the ocean basin was a rigid box and you threw a rock into it, yeah the water level would go up. However the physical material giving emergence of the rising land is material being drawn from beneath adjacent seafloor which sinks. The principal of isostasy would suggest there is no change in ocean basin volume.
Now, vis à vis dropping a rock in the box, global rivers deliver a steady stream of sediment, many volcanoes send lava into the sea, desert dust, meteorites and dust add a liitle bit. Even this load is compensated for by some lowering of the seafloor.
The biggest effect is from sediment loading, but the sediment is preponderantlty lighter sialic (continental crustal material) and therefore introduces a volumetric addition.
It shows that astronomers, mathematicians and physicists should cultivate a geological friend to temper their hubris.
There is another possible reason why the satellite data disagree with tide gauges. Should I believe (I don’t) in the accuracy of satellite measurements, satellites measure whole oceans. Most of the area is far from shores. So satellites tell us that water is slowly and inexorably rising in the middle of oceans. In each ocean it creates a huge bulge. When these bulges burst, we will get a tsunami of biblical proportions. Only the New York City is getting prepared for the catastrophic sea level rise.
/sarc
Tangier Island shorelines superimposed from 1850. Not what the major news will report on, and this image is getting harder to all the time. Last year it was handy.
tangier island shoreline surveys 1850 1905 – Bing images
WoW, I’m surprised at sea level goin down off trend apx 10 mm in 2016 then up off trend in 2016. Were these tied to significant event and/or corroborated with tide gauge data?
A shame that Willis Eschenbach did not include a copy of the most up to date version of global tidal gauge measurements for comparison. Otherwise fantastic article – as usual. Thanks for the enlightenment.
John, thanks for the kind words. The problem is that these days the tidal records all have the satellite records spliced onto the end of the tide gauge records. You can read my analysis of this issue in the post “Inside The Acceleration Factory“.
w.
I’m going to take this opportunity to go off-piste for a moment to say that I’ve been put in Facebook Jail for three days for linking to an article in Newsweek Magazine … middle of the road Newsweek! Madness.
Just wanted to get the word out so folks who are my Facebook friends don’t wonder where I’ve disappeared to.
I wrote up the issues on my blog, you can read about this latest madness in my post called “Totalitarian Censorship“.
We now return you to your regularly scheduled programming …
w.
It is a nature of police states that they “round up usual suspects” when they need to show that they work hard and faithfully.
Watch the movie Casablanca again.
Although satellite sea level measurements are fun for academics to study, tidal gauges are far more important if one is worried about coastal flooding. Tidal gauges measure the relative sea level changes to dry land elevations which are affected by plate tectonics, isostatic rebound, and subsidence. Some land areas are subsiding, e.g. Louisiana, and some are rising like Alaska. Averaging the worlds tidal gauges should be a pretty good estimate of actual sea level. I am always a little skeptical when “modeled adjustments” are added to data. Those adjustments make it too easy for non-scientific biases to affect the results.
Deleted comment and reposted.
Willis – I have a question related to your post on “Bright Green Impossibilities”. Comments there are closed so could not ask there now. My apologies for being off topic here. So, my question – can wind and solar generate sufficient energy on their own without using fossil fuels to reproduce themselves including powering all the mining machinery, transport, manufacturing, land clearing, on-site assembly, and ultimate decommissioning? To me, it seems obvious they can’t meaning that they are reliant on fossil fuels from cradle to grave, but I lack the technical knowledge to back up my assertion. Have you done or considered (or do you even have any interest) in doing a post on how much energy is required to produce a solar panel or wind turbine including the energy required to mine, transport, etc.? To me, it is blindingly obvious, but apparently not so obvious to the activists supporting this nonsense.
Thanks.
Thanks, Barnes. I ran the numbers on wind turbines a while back. At that time the energy payback time was on the order of four years. However, it’s not an easy calculation, and I didn’t include maintenance or decommissioning.
I don’t think that the answer is “blindingly obvious”. I suspect the true numbers are on the order of 8 years or so, but it’s highly dependent on just where the panels or turbines are located.
I suspect that if you did a thorough google search that you’d find some better data than mine. Me, I have other things on my plate, but I encourage you to do the research.
w.
Thanks Willis. I will keep digging. I am not sure if I made myself clear. I am not looking for payback time, but trying to ascertain if wind turbines and solar panels could generate sufficient energy to drive the entire process for their creation, deployment, maintenance and ultimate decommissioning without any support from fossil fuels or nuclear. I think the intermittency issue alone would make the manufacturing process difficult if not impossible, but that is opinion alone. That being said, I am sure you have plenty of other things to work on besides chasing this down. Thanks for your posts – they are always highly informative.