UIT THE ARCTIC UNIVERSITY OF NORWAY

10,000 km2 of ice disappeared in a blink of an eye from an ice sheet in the Storfjorden Through offshore Svalbard, a new study shows. This dramatic break off was preceded by quite a rapid melt of 2.5 kilometres of ice a year. This parallels the current melt rates in Antarctica and Greenland and worries the scientists behind the study.
“Our measurements of the ice retreat in Storfjorden Through show that the prevailing conditions to the great break off, match what we see in Antarctica and Greenland today. It is uncanny. There are new studies published almost weekly, that show that the retreat of current ice sheets is two to four km a year and that it’s speeding up.” Says CAGE-professor and first author Tine Lander Rasmussen.
Climatically unstable period
The last deglaciation, 20,000- 10,000 years ago, was a period of coexisting global warming and rapidly shrinking ice sheets. But stating the actual correlation between the two is not as simple as it sounds. The period in question was climatically unstable, and big melts were interrupted by re-freezing and formation of new ice. The speed of the ice retreat, relative to climatic changes, has therefore been difficult to establish.
“We have studied the ice sheet development 20 000 – 10 000 years ago using marine sediment cores. The 12 cores have been collected in the area during the past 18 years, and meticulously analysed for different types of microfossils of single-celled organisms called foraminifera,” says Rasmussen.
The biochemistry in the foraminifera fossils helps reconstruct the enormous amount of information about the state of the environment in prehistoric times. The sediments were sliced up in slices representing time periods of 30 to 70 years. Over 70 samples were dated and analyzed.
“What we saw is that the ice sheet starts retreating some 20,000 years ago but lingers on a ridge in the fjord. Then, some 15,000 years ago the atmosphere and ocean temperatures warm up, impacting the ocean circulation. A huge chunk of the ice sheet disappears at the same time. At the start of the Holocene warm period, 11,000 years ago, things really pick up speed. We can’t see any more evidence of an ice sheet covering the ocean floor after that time.”
Consistent correlation between global warming and ice retreat
The periods of extremely rapid ice sheet retreats are consistently correlating with periods of global warming of oceans and temperature. This is mirrored in ice sheet retreat from other eight Northern Norwegian fjord systems.
“This is strengthening our hypothesis that an increase in ocean temperature and global warming is the direct cause of the chain of the events leading up to the dramatically rapid ice sheet disintegration.” Says Rasmussen.
This gives some alarming perspectives on present-day outlook. The great melt of the glacial maximum to the Holocene was 10,000 years in the making. The present climate change is much more rapid.
“The final retreat of the Storfjorden Through ice sheet happened as rapidly in the outer parts as it did further up the through. This means that as soon as warmer oceanic water got access to the ice sheet, it surged pretty rapidly inward from the edge of the ice shelf. To the interior of the sheet itself. We see this happening in Antarctica today. The Larsen A (1995), B (2003) and C (2017) break-offs are examples of this process. “
###
Except the Larson Ice sheet melts are driven by volcanic and geological activity, not climate
If it was climate, East Antarctic would be affected as well……. and its not.
https://www.plateclimatology.com/antarcticas-larsen-ice-shelf-breakup-driven-by-geological-heat-flow-not-climate-change
Furthermore, Antarctica has been COOLING for most of the last 2000 years
Indeed so. Tectonic activity regulates flow of the warm Atlantic currents into Arctic ocean, which in turn affect Arctic ice levels
(Graph needs updating with more recent data)
http://www.vukcevic.co.uk/NAt.htm
There is no evidence Larson Ice sheet melts are driven by volcanic and geological activity.
You will not find it if you do not look for it. As you could see from the graph and comment above it is there in the N.Atlantic and further in the Arctic Ocean, with exact numerical quantitation. Note that forcing formula is not linear but it has square law dependency. Problem with climate scientists is that they tend to ‘linearise’ natural process which most often are not.
There’s plenty. There are over 100 active volcanoes under the ice in Western Antarctica.
There are volcanic features, but there are no recent recorded earthquakes associated with volcanism, so it looks like they are extinct.
Here is the paper
https://www.researchgate.net/publication/261635359_Seismicity_in_the_Antarctic_Continent_and_Surrounding_Ocean
Evidence of an active volcanic heat source beneath the Pine Island GlacierTectonic landforms reveal that the West Antarctic Ice Sheet (WAIS) lies atop a major volcanic rift system. However, identifying subglacial volcanism is challenging. Here we show geochemical evidence of a volcanic heat source upstream of the fast-melting Pine Island Ice Shelf, documented by seawater helium isotope ratios at the front of the Ice Shelf cavity. The localization of mantle helium to glacial meltwater reveals that volcanic heat induces melt beneath the grounded glacier and feeds the subglacial hydrological network crossing the grounding line. The observed transport of mantle helium out of the Ice Shelf cavity indicates that volcanic heat is supplied to the grounded glacier at a rate of ~ 2500 ± 1700 MW, which is ca. half as large as the active Grimsvötn volcano on Iceland. Our finding of a substantial volcanic heat source beneath a major WAIS glacier highlights the need to understand subglacial volcanism, its hydrologic interaction with the marine margins, and its potential role in the future stability of the WAIS.
To be “active”, there must not be an eruption.
Magma movement volcanic earthquakes are often very small.
USGS shows that earthquakes are only tracked in the South Shetland Islands.
https://earthquake.usgs.gov/earthquakes/map/?currentFeatureId=us7000d3q2&extent=-85.00543,-132.36328&extent=-26.43123,50.625&range=month&magnitude=all&settings=true
Erren
Or dormant! On top of Mount Lassen (CA) there are hot mud pools despite no volcanic activity for 100 years.
Your search engine can be your friend. It can keep you from looking like a liar or a fool:
https://www.livescience.com/41262-west-antarctica-new-volcano-discovered.html
What is missing from your link, and from the thread in general, is any proof/indication of the CHANGE in geothermal energy emissions required to melt the ice at this rate.
After (hopefully) realizing that the word “discovered” in your link head does NOT connote any CHANGE, read thru your link and heed:
“People hear the word ‘volcano’ and get caught up in the idea that it will change the way the ice sheet works, but this stuff has been going on underneath the ice [for millions of years], and the ice sheet is in balance with it,””
What Clyde linked is a sort of press release of the paper I linked above.
Make your own conclusions about what’s said there:
Here we show geochemical evidence of a volcanic heat source upstream of the fast-melting Pine Island Ice Shelf, documented by seawater helium isotope ratios at the front of the Ice Shelf cavity.
That just contradicts what you said.
“That just contradicts what you said.”
AGAIN, where is the evidence that the increase from this heat source is concurrent with the melting.
I’ll try again. Is the source new? Are the “documented sea water helium isotope ratios new? You have no proof that they are, and as we progress, we routinely “discover” these changes.
Here’s what we know, and what the authors are telling us The area is replete with such geothermal emissions spots. They come and they go. That’s why the authors go out of their way to disavow your convenient cause/effect supposition, by mentioing that we are roughly in “balance” with them w.r.t. melting.
OTOH, the close arithmetic linking of the energy gain of the ice melt to the more general heating of ocean currents – and what we know about those currents – points to them as the cause…
The paper:
Yet, recent direct measurement of the thermal gradient beneath the Whillans Ice Stream have revealed heat fluxes that exceed the background geothermal gradient4. The apparent surface deformations in the WAIS thickness also suggest localized heat fluxes that are most likely volcanic due to their intensity14,15, while ash layers from ice cores reveal more recent eruptions
[…]
Here we report on helium isotope and noble gas measurements that provide geochemical evidence of subglacial heat flux that can only be volcanic in origin and of subglacial meltwater production that is subsequently transported into the cavity of the Pine Island Ice Shelf.
“Yet, recent direct measurement of the thermal gradient beneath the Whillans Ice Stream have revealed heat fluxes that exceed the background geothermal gradient”
STILL waiting for any indication/proof that there is anything going on w.r.t. geothermal emissions that hasn’t been going for before it was “discovered”. FYI, every melt that has any sourcing from a geothermal emission is going to have “heat fluxes that exceed the background geothermal gradient”.
I give you permission to THINK…
One day you will give YOURSELF permission to think.
Then you will just need to work out how to.
So far, there is no evidence of any such capability.
Only a person of complete ignorance thinks that geothermal activity is constant
https://www.newsweek.com/antarctica-melting-below-mantle-plume-almost-hot-yellowstone-supervolcano-705086
Oh , its big oily blob.. that explains the ignorance and denial.
And to think, BugOilBoob actually claims to be a geologist.
Only a complete moron thinks that heat sources under the oceans don’t heat ocean currents
https://www.newsweek.com/antarctica-melting-below-mantle-plume-almost-hot-yellowstone-supervolcano-705086
You must pay attention to the dates.
Clydes link was about the discovery in 2013, my link, later, in 2018, from their deeper analysis of their discovery.
Exactly, bigoilbob, all that they have ‘proved’ is that the ice in that location melts at the same rate, and has done for thousands or millions of years. No change.
Only a completely ignorant moron thinks that volcanic and geological activity are constant…..
…and that massive heat plumes under the ice aren’t going to have any effect.
Big oily blob self-defines by his comments.
https://www.newsweek.com/antarctica-melting-below-mantle-plume-almost-hot-yellowstone-supervolcano-705086
Exactly.
Apart from the fact it “does NOT connote any CHANGE…the ice sheet is in balance with it”, apart from that inconenience, the Larson ice shelf carvings events happen on floating ice; it thins, it cracks, a bit floats away. But even if there was some change in geothermal activity on the West Antarctic peninsula, it has to be warming the entire Weddell Sea to somehow be “driving Larson Ice sheet melt”.
And another MORONIC statement that trying to imply that seismic activity is constant.
SO DUMB !!
The Larson sheet THINS FROM BELOW.. !!
Have you got ANY EVIDENCE AT ALL that the warmer section of the West Antarctic, which just happens to overlie a huge complex of seismic and volcanic activity…
….. has ANYTHING to do with human released CO2
Remain your normal ABYSS of science, Loy-dumbest !!
I doubt anything is in balance on Earth. All natural system tend to build themselves up to a critical state.
Your search didn’t dig deep enough 😀
Too easy loyd’oh. Even the BBC disagrees with you.
https://www.bbc.co.uk/news/science-environment-41972297
“One result of our study is that the heat flux is higher underneath West Antarctica, where more ice is currently melting, than underneath East Antarctica.
Do you think increased geo-thermal activity is driving increased Larson ice-shelf carving?
Makes more sense than the claim that unchanged air temperatures are doing it.
This unchanged West Antarcic air temperature, nowhere near a volcano out in the Weddel Sea?
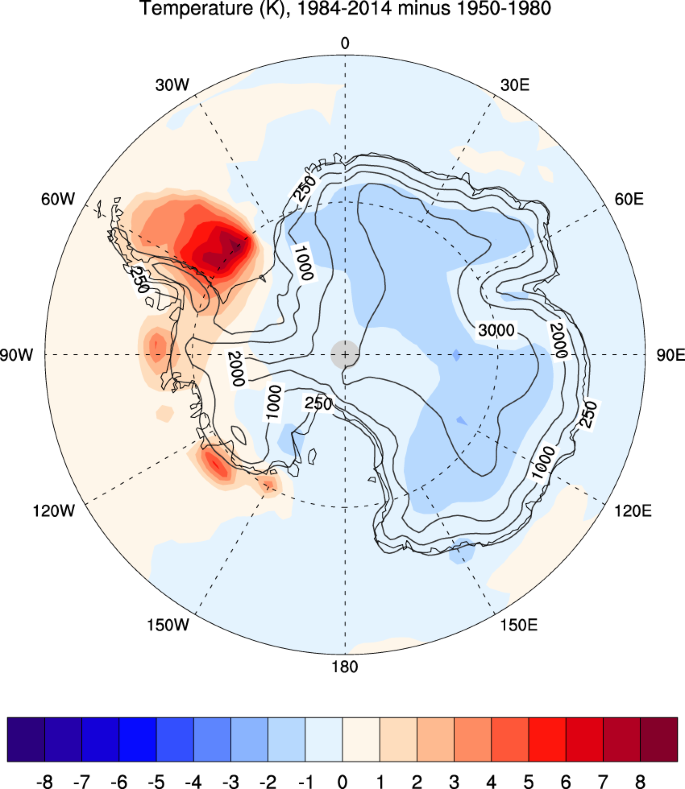 ?as=webp
from here: https://www.nature.com/articles/s41612-020-00143-w
ROFLMAO
That is caused by human CO2 , is it Loy-dumbest !!
LOTS of warm pools along that peninsula, I wonder where that warm water comes from.
Seems you comment is, as ALWAYS, based on total IGNORANCE. !!
Maybe you should try reading this for a first time
I know self-education is against your basic morality…
… but do at least try.
https://www.plateclimatology.com/antarcticas-larsen-ice-shelf-breakup-driven-by-geological-heat-flow-not-climate-change
Meaningless graphic that shows normal temperature ranges as alarming colors… Bogus!
Do you have ANY EVIDENCE AT ALL, that human CO2 is the cause. !!
Do you really think HEATING FROM BELOW, doesn’t cause ice sheets to thin and crack ??
Are you REALLY THAT DUMB !!!
“calving”
As in a cow having a calf.
Except, glaciers “calve”.
Ice-shelves float and do not calve or carve.
“increased ice-shelf carving?”
What’s that, lolly? More twisted alarmist logic for the gullible?
Loydo wishes there was no evidence for volcanoes under the Antarctic.
Feelz. FTFY.
There is evidene you have no clue about what you are talking.
New ?
No !
There is evidence that the Larson Ice sheet melts have nothing to do with air temperatures.
It’s not melting it is calving.
WRONG
Didn’t read the link did you , twerp
Your DENIAL of science is getting stronger and stronger
Its all you have to maintain your mindless fantasies.
Certainly nothing to do with human released CO2 is it. Loy-dumb.
Antarctica has been cooling for 3000 years. That’s when the gigantic EAIS quit retreating, based on soil isotopes.
What a load of RUBBISH, just to get published !!
Present day has been steady for the last 15 years, and the current level of Arctic sea ice is WELL ABOVE what it has been for most of the last 10,000 years
So yes, the melting from 12,000 year ago, at the end of the last major snow-ball-Earth period to basically no sea ice at all in summer during the Holocene optimum, would have been quite quick.
But it is totally irrelevant to the current period, which is only a small recovery from the extreme highs of the LIA and late 1970s.
But these are facts, Fred. Our resident expert on everything Arctic and Antarctic, grief, to rebutt with his “feelings” in 3.. 2.. 1..
Apparently, the belief that there is a “right” answer to a math problem is an example of white supremacy.
https://www.foxnews.com/us/oregon-education-math-white-supremacy
Yaba Daba Do! It must have been Fred Flintstone and associates running around in those four-wheeled pushmobiles that caused the rapid Storfjordan Through sea ice loss 10,000 years ago because it is SUV’s causing it now! What logical fail, these idiots have demonstrated, once again, that planet goes through cycles all on its own. Thanks for showing another example of there is no anomaly signal detectable against the background of natural variability.
Now it can be told, the astonishing truth about why the Neanderthals are gone from the planet.
I do not believe there were pickup trucks being driven then belching out copious amounts of CO2. What caused the warming up? I thought the only thing that warms the planet is CO2. These guys did not get the memo.
See Fred Flinstone (above). Looks like we had the same thought, which means you’re quite the clever fellow.
The mining machinery had copious methane output, though. !
Tine hun, you’re talking about a vanishingly thin, small, triangular piece of ice, on a slope of undeclared gradient.
It has a southerly aspect into a much larger (by comparison itself) mass of water that getts very very deep very very quickly.
Frankly hun, you would found something amazing if it hadn’t departed the fjord – there was nothing else it could possibly do
Don’t take it personal please, but we see here ‘Magical Thinking’
You have fixated upon (studied) this place too hard for too long.
It has become ‘your personal baby’ and as such, is capable of wondrous and beautiful things.
All human babies are – by definition. Don’t add to your worries about that.
But when that happened, you stopped doing Science
Comparing it to Larsen was the step too far.
You are sensationalising it and for what reason? If it really was A Perfect Baby, it would not need that sort of ‘sell’
You instinctively knew
sorry hun. Try laying off the plant-based diet## and the wine required to make that mush even remotely edible
Properly clear your head and try again in 3 or 4 years time
## Such things being strongly encouraged and mandated by Government – especially in Care Homes :-0
Ehrlich didn’t see that one coming did he?
What mechanisms effect core temperature and mantle volatility over time? Is it cyclical?
These guys are so focussed on the minuiae that they have missed the big picture (all too common in climate science). Sea levels have been rising at about 2mm per year for a few decades. Actually probably for two or three centuries if you take away adjustments. But in the last de-glaciation, the sea level rose at nearly 6mm per year for 20,000 years, and for several thousand years in the middle of that they averaged about 10mm per year. There was some serious melting going on, not the itsy bitsy ice that they are talking about, which you would need a magnifying glass to see.
Indeed. They say:
The conditions now are greatly different from what prevailed 10,000 years ago when a large chunk of the planet was covered by ice sheets a mile thick.
Again, we have academics able to ignore facts that are common knowledge among school boys.
And if all ice on Earth melted today, the resulting eustatic increase would not be as high as the increase that occurred just between 18,000-12,500 years ago.
Furthermore, the 2mm increase of eustasy today does not actually result in global sea level rise, the planet’s sea level is technically at stillstand because the rate is not significant enough to cause a transgression of coastlines globally because local and regional factors (isostasy and sedimentation) are dominant over eustasy.
And the world didn’t come to an end during the last deglaciation period. So why all the end of days talk from politicians, the media and the people who own them both?
CONTOL over your life, you deplorable unwashed scum. How dare you foul their air. You do nothing but take up space, despoil their property and deplete the riches that lie beneath it. .
Rapidity of change means nothing.
Climate change is fractal and changes of all magnitudes and all speeds occur all the time, according to the log-log distribution of nonlinear fractality.
This study falls into the category of “obvious at a glance that it’s total BS”.
Antarctic “melt” sits in the same company as sea level rise and ocean “acidification” as being completely false and illusory.
The only real warming phenomena are the recovery of sea and air temperatures since their minima at the depth of the little ice age 200 years ago, and the reduction in Arctic ice from the peak attained in the 1970’s. Both follow a normal fractal signature of climate variation. For such variation not to exist would be as nonsensical as for gravity to stop.
Google Windy.com and check temperatures in Antarctica during what would still be summer there. I doubt that there would be melting there for more than a few hours per year. One warm afternoon would be likely to greatly accelerate the rate of melting.
Yes, but is the Antarctic screaming? It needs to scream. Because all the canaries in the coal mine died. Or something.
“Trough”, not “Through”. The map caption got it right, but the body text didn’t.
And here we have peak summer in the Southern Hemisphere. Imagine how much ice sheet is melting with those balmy -10 to -25 degree C temperatures.
https://earth.nullschool.net/#current/wind/surface/level/overlay=temp/orthographic=-58.11,-89.44,872/loc=-151.109,-79.681
Claiming that today’s minor glacier retreat is on pace with the end of the last glacier period isn’t even pseudoscience, it’s cartoon-science.
If ice is melting as fast as it did during the last de-glaciation, why is it not showing up in sea level rise?
Salute!
How why not look at the last deglaciation before the current one?
How did the temp, sea level, forrestation, etc. and such look from the beginning to next glacier age we are now recovering from?
My feeling is we are looking at this inter-glaciation more than what happened the last two or three times
Gums sends…
Because this is in one and only one location. During the last ice age most of the land (maybe 60-80%) was under glaciers. This would have increased the amount of melting ice by a huge factor.
In other words, it’s something local, and not anything global.
It’s nothing to worry about.
“Then, some 15,000 years ago the atmosphere and ocean temperatures warm up, impacting the ocean circulation. A huge chunk of the ice sheet disappears at the same time. At the start of the Holocene warm period, 11,000 years ago, things really pick up speed. We can’t see any more evidence of an ice sheet covering the ocean floor after that time.”
And this is what the geology of Hallett Cove in South Australia shows-
“During the Recent ice age about 20 000 years ago,
sea level was about 130 metres lower than today
and South Australia’s coastline was about 150
kilometres south of where Victor Harbor now is.
The ice cap started to melt about 15 000 years ago.
Sea level began to rise and reached its present level
about 6000–7000 years ago.”
(Hallett Cove Geological Trail, 2010, Government of South Australia)
In other words St Vincent and Spencer Gulfs didn’t exist and the South Australian coastline was out at the edge of the Continental Shelf incorporating Kangaroo Island in the time of aboriginal occupation-
OpenSeaMap – The free nautical chart
Now compare what could be an average SLR of 16.25mm/yr for 8000 years to the historical tide gauge rises at Port Arthur and Fort Denison and please explain plant food doomsters?
You can see the light coloured Continental Shelf here along with the earlier Dreamtime Story-
Kangaroo Island – Wikipedia
Speaking of ice retreats, I note that DMI appears to have changed the basis for their chart
http://ocean.dmi.dk/arctic/plots/icecover/icecover_current_new.png
to show 90/10 historic profiles, rather than the 2 s.d. (=~95%/5%) margins previously. Could that be anything to do with the risk that ice is now inside the old margin? It must be important to resist anything that says we are not too far from normal…
From the map, it seems like the area in question is bounded mostly by land on the west, north, and east (between Spitsbergen and Edgeoya), and only open to the south (except for two narrow channels to the east).
A strong current of warm water flowing into this bay from the south (for example, a branch of the Gulf Stream) would be trapped in the bay, and could melt the ice relatively quickly from below. But this would not occur in fjords or bays facing west, east, or north, where a warm current could bypass the fjord.
Such rapid melting in a south-facing bay could be quickly reversed if the warm current either stopped or was diverted to the east or west.
That’s a real narrow view: rapid retreat of current ice from one or two spots based on “history of” doesn’t address inland stuff at all.
For example, how long did it take the entire body of water that is now the Great Lakes to turn into a southward flow down the center of the continent? And why should that be ignored. Why should giant errata (huge boulders moved by glaciers), and drumlins and glacial kames and that spectacular hiking trail called the Ice Age Trail be ignored in this “search for substantive evidence of warming”? Why ignore the Palisades in the eastern North American continent?
Why are those massive potholes in Russia, which are showing up now because the ice that was frozen solid for so long, be ignored?
It appears to me that this narrow view they manifest is for the sole purpose of saying “I’m right!” and getting grants money. They may be close to being right, but ignoring the rest of the planet in this quest, just to point and say “See?!? I’m right!, is kind of shallow.
It is ridiculous to say that present warming of around a degree in a century is much faster than in the past when thermometers were only invented in 1714. For warming rates before that we depend on proxies that are not accurate to 2 degrees on any given year. Even these guys, and I give them credit for their hard work, only have 12 bore holes on which to base their thousands of years of prehistoric temperature profiles. Interesting, but also high on the hubris index to draw sweeping conclusions…..
It sure is ridiculous even with the warming that caused the 130M SLR evident in the geology at Hallett Cove in South Australia and formed St Vincent Gulf. Saying that was an average SLR of 16.25mm/yr for 8000 years is as meaningful as saying the average adult has one large breast and a testicle.
To comprehend that you only have to visit the world geologically significant stranded shingle dunes at the head of the gulf at Fitzgerald Bay. As it shows-
“STATEMENT OF HERITAGE SIGNIFICANCE
The Fitzgerald Bay Stranded Shingle Ridge is an elevated shingle ridge deposited by 3m high sea levels during the mid-Holocene period (5,000 years ago) and then regionally uplifted by around 4m. The ridge consists of packed, sub-rounded pebbles and cobbles that now lie 5-8m above the adjacent landscape. It is located parallel to and slightly inward from the modern coastline of western Upper Spencer Gulf between Whyalla and Port Augusta, South Australia.”
26443_Summary.pdf (environment.sa.gov.au)
So the warming of 130M of sea level rise can pause and even drop 3M somewhere along the way and yet we’re all supposed to panic with with a somewhat steady and average SLR of 0.85mm/year measured at Port Arthur between 1847 and 2000 which even John Daly has doubts with evidence was even that great. What on earth are you smoking with the plant food meme doomsters?
How much energy are they talking about to melt the ice at that time and how much energy needed to melt the ice now? Larger quantity then at same rate melt now? Just asking.
Oh look, More trees under receding glaciers, glaciers that didn’t exist before the LIA
https://notrickszone.com/2021/02/12/tree-remnants-show-gretas-thunbergs-northern-sweden-was-3c-warmer-9300-years-ago-trees-theres-tundra/
Arctic ice max which occurs in March, millions of square kilometers.
2015 – 14.51
2016 – 14.52
2017 – 14.42
2018 – 14.48
2019 – 14.78
2020 – 15.05
Source NSIDC.
From the article: “The present climate change is much more rapid.”
What climate change? This guy is delusional. He’s been looking at too many Hockey Stick charts, and believing them.