Reposted from The NoTricksZone
By P Gosselin on 5. February 2021
Climate researcher, geologist, Patrice Poyet has released a new e-book: The Rational Climate e-Book: Cooler is Riskier. The Sorry State of Climate Science and Policies.
This is an outstanding reference. Using the table of contents the reader can conveniently look up the topic that’s of interest. The ebook has been downloaded over 10,000 times so far.
The 449-page book contains 120 figures and 177 equations and concludes that climate change is mostly about politically-fanned fear, and based very little on hard science.
Predictions of gloom haven’t come true
According to Poyet, a geologist, the worse climate predictions have been made for 50 years and none of them has ever become true. For example, despite the unsupported claims that the Maldives islands would be submerged by 2050, 97% of them have grown so far, for various reasons having nothing to do with “climate change”.
Also 50 years ago, the first Earth Day promoted ice age fears, and environmentalist Nigel Calder (later a prominent AGW skeptic) warned: “The threat of a new ice age must now stand alongside nuclear war as a likely source of wholesale death and misery for mankind.”
IPCC ignores vast majority of the science
While IPCC-affiliated scientists claim man to been behind the climate change of the past decades, Poyet’s book shows that this can only be concluded if one ignores all other factors. Fig 12, of his book, for example, depicts the natural fluctuations witnessed during the Holocene.

Rather than looking at what’s behind the Holocene changes, the IPCC tries to sweep it under the rug and scientists ignore them in their models.
CO2 climate sensitivity on the low end
When it comes to the question of how much of the warming since 1900 is attributed to CO2, Poyet believes climate sensitivity to a doubling of atmospheric CO2 is closer to that suggested by Lindzen and Choi (2009; 2010) and Soon et al. (2015) – at a range of values from 0.26°C to 0.475°C since 1900, and that we still are dealing with large uncertainties and small numbers.
Sun a huge climate driver
On what factor is the most powerful climate driver today, Poyet informed that over the timescales centuries, the sun drives the climate with a long term hysteresis of the oceans of several decades due to their massive heat storage capacity.
This regime gets disturbed by spells of volcanic activity. But when there are coincidental changes in solar and volcanic activity, the climate deteriorates, as was experienced during the LIA.

Flawed climate models
Poyet believes the models also are inaccurate. “Even small changes in the solar reconstructions, e.g. PMOD over ACRIM, lead to massive discrepancies in models’ predictions,” says Poyet. “The sun is, strangely enough, much under-appreciated in the current climate models, when it could have as large as an impact as ± 4.5 W/m2 since 1750 (Judge et al., 2020) to be compared to the +1.53 W/m2 imbalance attributed to CO2 since 1900.”
Ice age in 1500 years?
Moreover, the solar mechanisms are far more complex and widespread than what the IPCC likes to believe:

Over longer time-scales, “the glacial inter-glacial cycles, the well known combination of the 41kyr tilt cycle and various precession cycles rule the game. This is what will send us back in glaciation in 1,500 years or so,” Poyet commented in an email.
Antarctica: no warming in 200 years
On the topic of Antarctica, the geologist presents a chart showing there has been no significant temperature trend change over the past 200 years:

Future: cooler from now on
When it comes what to expect in the next 30 years? Cooler? Warmer? Poyet says the current state of the climate-science does not allow anyone to make reasonable predictions. “It compares somehow to earthquakes forecasting. Earthquakes still cannot be predicted. The same applies to climate-science.”
He also calls the climate-alarmists’ belief they can tell us the temperature in a century, just because they have added the CO2 control knob “delusional”.
“What makes the climate is first and foremost the precipitations and thinking they are able to forecast a precipitation regime 100 years ahead is a joke.”
Poyet says his favorite climate model is Ollila’s (2017) where he concludes, in all scenarios, a decrease in temperature from 2020 onward.
================================
Patrice is a geologist, a geochemist and an applied computer scientist with an interest in various domains like Earth and Planetary Sciences, Astronomy, Finance and Trading, Integration in Manufacturing and Design, Simulation and Defense Systems. Patrice published 38 articles mostly in peer-reviewed scientific journals, 6 books jointly-reviewed with colleagues, 6 peer-reviewed chapters in books, 64 papers in peer-reviewed conferences, one D.Sc. thesis (1986), and 32 scientific and technical reports for demanding public and private clients (e.g. French Navy, EC-funded R&D projects, CIEH, etc.) and acted as an expert reviewer for several EC R&D projects.
“Rather than looking at what’s behind the Holocene changes, the IPCC tries to sweep it under the rug and scientists ignore them in their models.”
Needs changed to
“Rather than actually scientifically studying what’s behind the Holocene changes, the IPCC tries to sweep it under the rug and scientists ignore it in their ignorant linear progressions they try to validate with the label ‘model’.”
Its like watching children try to blame an oven fire on a small dog that stays in the back yard. I haven’t seen a single product from the IPCC that can claim to be a model or even a modele. There has been no science at all.
Having followed the global climate controversy for the better part of 50 year … man-made global cooling, through anthropogenic global warming to the now indisputably equivocal “climate change” patchwork of bad science, poor data and nonsense computer modeling; I have arrived at the opinion that it’s ALL pointless bickering. They’re partially right and if they ever got it together and looked at it objectively … that fact makes them all wrong when applied to the end result. Modern climate science has been like the 5 blind men describing the elephant.
IPCC is the Intergovernmental Panel on Climate Change. it is a political body. Don’t expect science from a political body.
But it’s settled science
Not true – I can state with great confidence that the surface temperature is stuck where it is now for more than the next 30 years baring a major asteroid hit. The climate system will even accomodate a serious volcanic event with minor perturbation.
All climate models are wrong – they are unphysical claptrap.
The “Greenhouse Effect” is make believe – completely disconnected from how energy on Earth is regulated.
I think you are right even though I have no scientific background with which to judge.
I think the alarmists themselves know they have a weak argument otherwise they would engage in such fraud and subterfuge
Hand waving is the sign of weakness
You do not need to have much faith in what I say. It is so easy to see for yourself. This climate model updates every day:
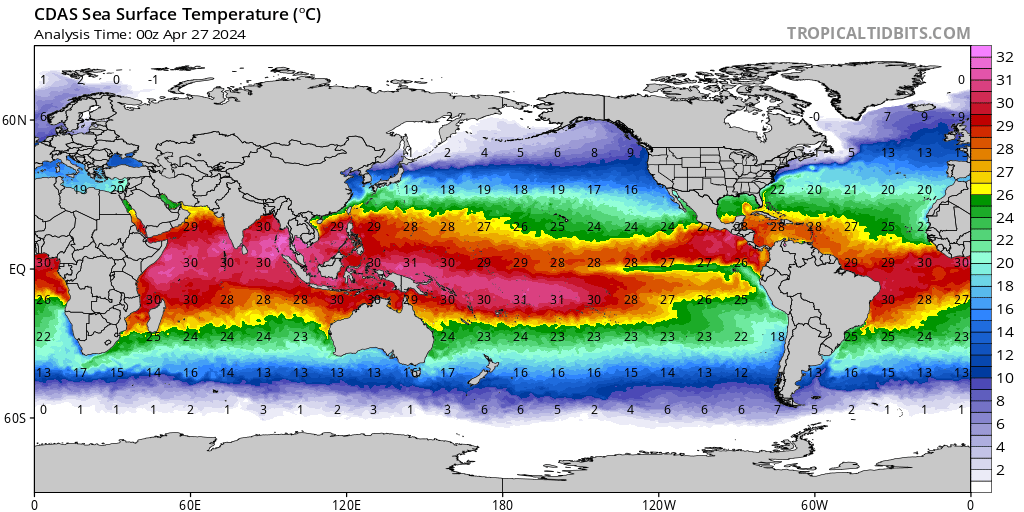
So you can check it daily.
What you will observe is the the lowest temperature is -2C and the warmest temperature will be 30C give or take a degree across the three tropical oceans.
So the climate model reduces to:
Average Global Surface Temperature = {30 + (-2)}/2 = 14C
That is all you need to know to get a more accurate prediction of the surface temperature than any other climate model will produce.
You need a bit more knowledge to understand why 30C is the upper limit but daily observation will confirm it is 30C. It is well known that sea ice forms at -2C so there is no ocean surface water cooler than -2C.
I have doubts that Earth will slip into another glacial period in the next few millennia. The orbital eccentricity is lower than it has been for a million years and is still reducing.
Other glacial periods have been timed with reducing eccentricity but all had higher eccentricity than now. We will have some indication if ice starts accumulating in the northern hemisphere. Until then it would be a brave call to forecast another period of glaciation within 1500 years. Albiet I doubt Poyet will be around to see that he is wrong; likewise for me.
Perhaps the first person to live ‘forever’ has already been born. link If we extend peoples’ horizons past a hundred years they will develop different priorities. Preventing glaciation might become the next cause de jour. The issue might become how to get more CO2 into the atmosphere. 🙂
We’ll need more CO2 for food production first.
Always assuming that CO2 has any effect on temperature…which is so unlikely that I would actually put money on it a lot of money!
You better hope you are wrong. Imagine being ruled by Nancy Pelosi, Chuck Schumer, and Joe Biden forever.
Old Sicilian saying: “Where there is death, there is hope”.
Every 400,000 years, orbital eccentricity tends to be lower like during MIS 11 and MIS 19.
That arctic temperature chart at the top of this article would make a good proxy for the global surface temperature profile.
It shows the cyclical nature of the climate, and it shows that the Early Twentieth Century was just as warm as it is today.
If it was just as warm in the recent past as it is today, that means that CO2 is a minor player in the Earth’s atmosphere and is not something we need to concern ourselves about.
Alarmists claim we are experiencing unprecedented warming today because of CO2, but the chart above clearly shows that is not the case in the arctic, and it is also not the case in any part of the world. All unmodified, regional surface temperature charts resemble the profile of this arctic chart. They all show it was just as warm in the Early Twentieth Century as it is today.
Here is the U.S. surface temperature chart which shows the same thing the arctic chart shows:
And other regional charts look the same. This is the true temperature profile of the Earth.
Tom Abbott
Thank you. It is my belief that the warmest decade in the last 100 years in North America was in the 1930s. Could you kindly advise. What is the source of the temperature chart you have posted?
It’s here
Terence, Redge gave you the link to the source of the Hansen 1999 chart.
When you go to that link, you will see the Hansen 1999 US surface temperature chart displayed next to a fraudulent, modern-era Hockey Stick chart.
I contend that the U.S. chart is the *real* temperature profile of the planet because its profile resembles every other regional surface temperature chart on Earth.
The “hotter and hotter” temperature profile of the fraudulent Hockey Stick chart demonstrates that the Data Manipulators changed the temperature profile from the one shown on the U.S. chart, which shows it was just as warm in the 1930’s as it is today, to the one on the fraudulent Hockey Stick chart which cooled the 1930’s into insignificance in order to make it appear that the temperatures are getting hotter and hotter and hotter, for decade after decade and we are now at the hottest temperatures in human history.
It’s a very scary story if you believe the Hockey Stick represents reality. But it does not represent reality.
The unmodified, regional temperature charts are what represent reality and they say it was just as warm in the recent past as it is today, and that means we are not experiencing unprecedented warming, as the alamists claim, and that means there is no need to regulate CO2 because nothing unusual is going on.
Here’s a chart of the AMO. Look at how it resembles the Hansen 1999 US temperature chart profile.
Interestingly, this chart follows almost exactly, the Yoshimura Cycle, which is based on the movement of the sun in its Barycentre, due to the gravitational pull of the gas giants.
Here are some unmodified, regional surface temperature charts from around the world. They also show it was just as warm in the Early Twentieth Century as it is today.
Tmax charts
US chart:
China chart:
India chart:
Norway chart:
Australia chart:
Add south Africa to that list
And Chile
That chart does display the 1930s as warmest.
Eastern USA has been cooling since 1900.
.
Same with Illinois
.
Texas has the same pattern as the chart above. Warmer around 1930
One of the reasons I have been so hard on the accuracy of the Global Average Temperature is precisely what you have here. A friend of mine and I have been doing this all over the globe on individual stations/regions that have long records. By far, the vast majority all show cooling. What this means is that someone must find offsetting stations/regions that have 3+ degree warming in order to have an average of an 1.5 deg increase. The only way to do so is to include localities that have an amazing amount of UHI. GAT obviously smears UHI all over the place.
I don’t think it matters one bit if the warmists can find enough ‘warming” records to offset those that show cooling. The GHE is supposed to be global due to uniform mixing of CO2. Thus, finding any significant regions where cooling is documented falsifies the GHG warming theory. If this was about science, the argument would end right there and the climatologists could go back to trying to doing meteorology and trying to do a better job of getting rain and temperature forecasts for 3-4 days ahead right.
While CO2 may be well mixed, things like TSI, clouds, water vapor, altitude, etc. all have affects on temperature. GAT as it is done, hides all of the variance in the calculations. Pure propaganda.
I pulled the past nine years of cooling degree-day monthly data for Tullahoma, TN. The data doesn’t go back any further there but the trend over the past nine years is down, not down greatly but down.
Tom, the fact that it was just as warm 100 years ago does not prove that current warming is not CO2 based, just as there is no proof that it is CO2 based
What it shows is the weakness of the climate scientologists argument is so apparent that they feel they need to engage in all sorts of fraud like the hockey stick and claim it’s never been this hot, which is an obvious lie to anyone with brain cells
I may be wrong but wasn’t it the work of Steve McIntyre that forced Hansen to admit that the hottest years in the 20thC in the US were in the 1930s?
No, Hansen declared 1934 to be the hottest year in the United States in 1998.
The year 1998 was the hottest year since 1934, and Hansen was expecting that the temperatures would continue to climb and exceed the heights of 1934, so at the time, Hansen had no reason to hide the fact that up to that time, 1934 was the hottest recorded year.
Read the dialogue at the link below where Hansen speaks about 1934 and the 1930’s being the hottest decade in recorded history. And then tries to justify the fact that the fraudulent global temperaure chart looks so much different from the US chart. His explanation is laughable.
https://www.giss.nasa.gov/research/briefs/hansen_07/
It wasn’t until after 1998, and the temperatures instead of continuing to climb, actually cooled, that the Data Manipulators started getting serious about bastardizing the global temperatures and trying to erase the warmth of the 1930’s.
Also note that Hansen, being a Big Deal, in the climate game, already had a US surface temperature chart that he stood by, so after 1998, the Data Manipulators started manipulating temperature charts all over the globe, but they left the US surface temperature chart alone because it was already an established record done by the Big Deal guy.
In recent years, the Data Manipulators have taken to manipulating the US surface temperature chart, trying to make it look “hotter and hotter” but that’s not going to do them much good because we have the actual data to compare their bastardizations with. The only people they fool with these charts are the uninformed.
Here is a comparison of the US temperature record before (raw) and after it was bastardized:
Notice how the bastardizers managed to keep 1934 warmer than 1998, in the bastardized chart, while at the same time making everything after 1998 warmer. So they preserved Hansens basic chart, they just moved it down the temperature scale a little bit, and then added all the hot years after 1998. The actual temperature readings before manipulation show a temperature decline.
One good thing about it is we have the “raw” data so we can call them on their lies every time. Now, if we could just call them on it on a national/global basis. Everybody ought to know how these Manipulators are manipulating them.
*Something* made in warmer in the 30’s than it is today. It can’t be CO2 because CO2 is higher today. So what made it warmer in the 30’s?
If you look at the charts it is *not* warming currently. How can you look at the charts and say that is so?
“Something* made it warmer in the 30’s than it is today. It can’t be CO2 because CO2 is higher today. So what made it warmer in the 30’s?”
That’s my question, too.
The UN IPCC says CO2 was a minor factor during the 1930’s and before, so if that is the case, then something other than CO2 caused the warming in the 1930’s.
We have about three cycles over the last 150 years, where the temperatures warm for a few decades and then the temperatures cool for a few decades.
We had a high temperature point in the 1880’s, and then the temperatures cooled down untl about the 1910’s, and then the temperatures warmed up again through the 1930’s reaching a highpoint not much different from the highpoint in the 1880’s, and then the temperatures cooled from the 1940’s to the late 1970’s, and this cooling in the 1970’s was labeled “The Ice Age Cometh” as climate scientists were starting to think the Earth was entering another ice age because the temperatures were so cold. Then the temperatures started warming up and did so up to the early years of the 21st century and have basically flatlined since then.
The cold of the 1970’s was equal to the cold of the 1910’s. The warmth of the 1930’s was equal to the warmth of today.
So we have a cycle that alternates between cold and warm and the changes are of about the same magnitude in both directions.
The warming from 1910 to 1940, is equal to the warming from 1980 to the present.
One cycle, from 1910 to 1940, according to everyone, even the IPCC, was not affected by CO2, and the other cycle from 1980 to the present, according to alarmists, was affected by CO2.
It’s just not logical. The alarmists are trying to pound a square peg into a round hole. If the 1930’s warming was equal to today’s warming and wasn’t caused by CO2, then there is no need for CO2 to be the control knob of temperature today.
It seems there is a psychological need for CO2 to be the control knob, even when we have an example of a case where CO2 is not the control knob. Some people just want to fit in.
I think the fraudulent Hockey Stick chart has a lot of people mesmerized, in a bad way. It causes them to assume things not in evidence.
The establishment just can’t help themselves. Setting aside the US temperature for a second, I wonder why they could not have been consistent in their Y axis between the 2 charts of US and global temperatures. Of course that would have involved some honesty, of which they were in short supply even 20 years ago . For them it has always been about shaping the narrative.
The UAH Lower Troposphere Global Temperature for January is +0.12 deg. C, down from +0.15 in December. That’s half a degree cooler than the high reached in 1998. The planet is cooling despite CO2 levels continuing to increase.
UAH is still wrong. It needs a Version 7 to remove the obvious bias.
Looking at UAH above the Nino34 region still has the Pacific in El Nino. It has been in La Nina for about 8 months now and Australia is experiencing the result with rainfall up and temperature down.
UAH LT measures something way up in the atmosphere around 270K. If it has to have any relevance to ground temperature, the bias needs to be removed.
I don’t see any evidence of bias in the UAH temperature. It is almost exactly the same as the SSTs. Both show some warming over the last 40 years. The AMO mentioned above is the most likely source of much of that warming.
https://woodfortrees.org/plot/uah6/from:1979/to/plot/uah6/from:1979/to/trend/plot/hadsst3gl/from:1979/to/offset:-0.35/plot/hadsst3gl/from:1979/to/offset:-0.35/trend
To be in El Nino, the anomally in the Nino34 region needs to be below zero. The UAH LTT for the region is stuck above zero, which implies El Nino. Australia is currently experiencing La Nina conditions in line with the SST anomaly for the Nino34 region:
http://www.bom.gov.au/climate/enso/monitoring/nino3.png
But the Maldives now have a revenue stream entrenched, and it would be discriminatory (didn’t want to use the r word) to interrupt that for mere facts.
1,500 years to the next Ice Age?
The descents to ice ages appears to be slow. So even 1,500 year from now, it may not appear any different than normal Holocene variability for another 10,000 years.
”He also calls the climate-alarmists’ belief they can tell us the temperature in a century, just because they have added the CO2 control knob “delusional”.
I’m so happy.
”thinking they are able to forecast a precipitation regime 100 years ahead is a joke.”
Someone’s gotta pay.
Thanks to the author for making his ebook freely available. This will take some digesting, but I think he’s on the right track. As it happens, I’m a fellow geologist & geochemist.
Sadly, E-books carry absolutely zero weight, no matter how correct.
Directly? Probably right. Indirectly (meaning they might influence someone who has a platform), they might have some weight.
Dumb question I really want to know.
The rise in CO2 from 1850 to 1900 looks too much to be caused by the man made burning of fossil fuel.
Q. Have the alarmists actually proven this rise was caused by the man?
Thanks in advance.
“The rise in CO2 from 1850 to 1900 looks too much to be caused by the man made burning of fossil fuel.”
It’s set out here:
https://moyhu.blogspot.com/2014/08/co2-accumulation-accounted-for-by.html
The dominant human source of CO2 before 1900 was land clearing, and it was big. Overall the rise of CO2 matches human production very well, with about half going into the sea.
”The dominant human source of CO2 before 1900 was land clearing…”
Thing is Nick, grass also feeds on CO2, and the animals that eat it are carbon neutral.
Grass does not provide a store of CO2. The mass of land plants contains about as much C as the atmosphere. When you reduce that mass, the C goes into the air.
ROFLMAO.
There is very little “C” in the atmosphere Nick
Nick still thinks “C” goes into the air.
All green plants store “carbon” in one form or another, not much as CO2, though.
Your knowledge of basic plant biology is totally warped, Nick.
‘All green plants store “carbon” in one form or another,’
Yes, and so it depends on the mass of plant material standing. That is reduced by land clearance. Cutting down a forest to grow grass puts a lot of stored carbon in the air.
“Cutting down a forest to grow grass puts a lot of stored carbon in the air.”
Hmmm…… Cutting down the trees that were used for building my house put a lot of stored carbon in the air?
BTW, just how much land west of the Mississippi in the US was covered with trees that were cleared? Trees were a precious commodity when the pioneers moved west. They have been such ever since.
What do you suppose the trees cut down in the Amazon get used for? Huge bonfires?
But you never say it puts twice as much oxygen in the air as well, do you? Thats the problem with CO2, we have to call it carbon to demonize it, as you just did. Because we cannot demonize oxygen with the general public, can we?
Forests that have been regrown.
Let alone trees planted where brush and grass lived previously.
Anywhere one drives in the Western USA, distant trees are marks of man.
The same goes for Australia.
The Amazon was a thriving multi-metropolis when Columbus found the Caribbean. Spanish conquest, captured natives for slaves and introduced European diseases. Allowing the jungle to return and reclaim South American city states.
Nope.
Forest levels today are quite likely similar if not greater than forests of the 1500s.
Peat continues to grow and leave peat deposits.
Grass grows and their roots form deep mats. Grass eaten by wildlife increases carbon in the biosphere; e.g. massive herds of deer throughout America. And that is just one example where there are many.
Quite typical, argumentum ad ignorantium.
Those who do not know, assume and argue their points from ignorance.
Man cut down all of the, allegedly virgin, forests… whine whine whine.
Grow up and stick to known facts!
ROFLMAO…
Carbon in the air ?????
You really have LOST THE PLOT, Nick
Your ignorance and senility is progressing.
ROFLMAO TOO! How much “C” do you think is stored is plants? The last I knew each molecule of glucose has 6 Carbon atoms. C6H12O6
You do know that herbivores don’t eat plants just for the cellulose, right? The last I knew, photosynthesis absorbs CO2 and spits out O2 and the product is sugar.
I mean to also provide a link.
https://phys.org/news/2018-07-grasslands-reliable-carbon-trees.html
Thanks for the link, aussiecol. However, it was hard to read past the first sentence, due to my gag reflex:
My guess is that the anonymous UC Davis environmental journalist who wrote it doesn’t even recognize how oxymoronic (and just plain moronic) it is. Translation:
No, it doesn’t. The word for substances which make plants grow better is not “pollution,” it is “fertilizer.”
I really, really wish “science communicators” and “science journalists” would have to learn a little bit of science. Unfortunately, merely knowing how to write does not require knowing how to think, and does not enable a person to understand and communicate scientific information.
Anyhow, here’s the paper that the UC David press release is based on:
https://iopscience.iop.org/article/10.1088/1748-9326/aacb39/meta
Oops, I overlooked this typo until it was too late to fix it:
s / UC David / UC Davis /
Thanks Dave, I knew it may have had its misgivings. Just wanted to show Stokes he was wrong.
HUH?
How can that be?
With human contribution to the carbon cycle being only about 3% of Mother Nature’s?
The rise in atmospheric CO2 is much more likely due to warming oceans (since the Little Ice Age) outgassing.
This is confirmed by the fact that a 17% reduction in human emissions due to COVID lockdowns has had no discernible effect on atmospheric CO2 levels.
[Please no garbage about some inbuilt “delay”]
And I don’t want to hear IPCC claptrap that there is some genie up there picking out half of human emissions and fixing it in the atmosphere.
All Mother Nature sees is an ocean of CO2 and she cannot distinguish between manmade CO2 and the “natural” variety.
So an extra 3% in emissions from human sources is insignificant. It’s the warming oceans outgassing which is driving a steady rise in CO2.
“ It’s the warming oceans outgassing which is driving a steady rise in CO2.”
That kind of thinking is not going to get you an invite from John Kerry, the climate 💩.
“How can that be?
With human contribution to the carbon cycle being only about 3% of Mother Nature’s?”
Yes, but it’s 3% that wouldn’t otherwise be there. It’s enough to push natural carbon sinks above capacity, so the residue accumulates in the atmosphere.
Proof? Tumbleweed.
Look at the reabsorption of CO2 by the oceans every Southern hemisphere winter.
It’s clearly nowhere near saturation.
Ocean absorption is proportional to the amount of C in the atmosphere. Oceans are absorbing more at the surface because there’s more to absorb.
CO2, I should say.
“Ocean absorption is proportional to the amount of C in the atmosphere.”
.
ROFLMAO.. There goes that inherent IGNORANCE yet again..
So funny that you keep EXPOSING yourself at every post.
As CO2 goes up in the atmosphere natural CO2 sinks grow in capacity. It’s why the Earth has seen an increase of green areas by 30% since 1980. More green, more CO2 sinking!
It’s not ‘sinking’ though. Observations confirm that CO2’s atmospheric content is not falling; it’s growing. This has consequences for other systems: more ‘food’ for plants; more diffusion into the oceans.
And the green area on the earth is growing also! And temperatures are actually cooling! Doesn’t that lead you to question the assumption that CO2 is causing heating?
Take a look at the Tmax charts Tom Abbot has posted. If CO2 is higher now than in the 30’s and Tmax was greater in the 30’s then how can CO2 be the control knob?
Maybe the answer is that it is Tmin that is going up. That would drive the so-called average global temperature up just as much as increasing Tmax would. And Tmin going up lengthens growing seasons, increases nighttime growth of green, and is fueled by increasing CO2.
Don’t fall prey to the typical CAGW alarmist tripe that “the average global temp is going up so we are all going to burn up!”.
What’s going to happen is that we will be living in a better climate with more food because it is Tmin that is going up!
“And the green area on the earth is growing also!”
I just said that.
It bears repeating!
.
THANK GOODNESS.
Its been WAY TOO LOW for way too long
PLANTS LUV CO2
CO2 provides for ALL LIFE ON EARTH
What a load of ANTI-SCIENCE tosh
You are living in a hallucinogenic-based fantasy la-la-land, rusty.
Carbon sinks will expand as fast as extra CO2 becomes available.
Can someone explain the law of partial pressures to freddie please? It’s been around since 1802 but he’s a slow reader.
I thought the partial pressure depended on the concentration of a gas in a mixture.
As the mole fraction of CO2 goes up the partial pressure of the CO2 in a mixture goes up. In other words the partial pressure is the product of the mole fraction times the pressure of the whole mixture.
Poor little rusty, cannot make sense of basic science .
Thinks oceans are the only sinks roflmao….
Where they are, in fact, a major source
Thinks expanding biosphere is a limited sink.. SO DUMB !!!!
Your IGNORANCE is unbounded , rusty !!
ILUVCO2 wrote, “The rise in atmospheric CO2 is much more likely due to warming oceans (since the Little Ice Age) outgassing.”
I luv CO2, too, but that is wrong. The oceans are a net carbon sink. The ongoing rise in atmospheric CO2 concentration is not due to ocean outgassing, it is entirely due to mankind’s CO2 emissions.
ILUVCO2 wrote, “This is confirmed by the fact that a 17% reduction in human emissions due to COVID lockdowns has had no discernible effect on atmospheric CO2 levels.”
That’s wrong, too.
1. In the first place, the CO2 emission reduction was nowhere near 17%. GDP is a pretty good proxy for CO2 emissions, over the short term. The USA was hit much harder by Covid than most other countries but, even so, the U.S. economy only contracted about 3.5% in 2020, not 17%.
2. The reason that contraction hasn’t noticeably affected atmospheric CO2 levels is that it is dwarfed by usual seasonal cycles, ENSO variations, and other normal fluctuations.
Even if Covid lockdowns reduced anthropogenic CO2 emissions by twice that, a 7% reduction (compared to 2019) would only reduce CO2 emissions to between the 2011 & 2012 rates. A 5% reduction would only reduce CO2 emissions to about the 2013 rate.
Here are the data:
https://sealevel.info/global.1751_2014_2019.ems5_v07d.html
The effect is so slight that it isn’t even noticeable in the CO2 trend. A 7% reduction would lower CO2 concentration by only about 0.33 ppmv, and the typical year-to-year change in CO2 level varies from less than 2 ppmv to more than 3 ppmv: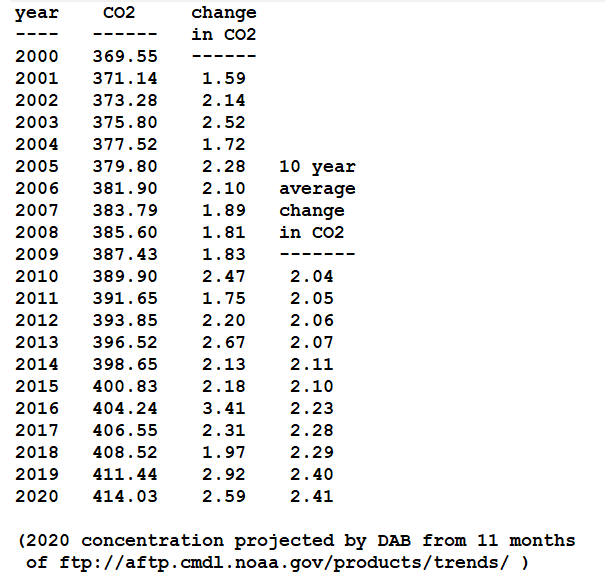
Roy Spencer has written several good articles about this:
https://www.drroyspencer.com/2020/06/covid-19-global-economic-downturn-not-affecting-co2-rise-may-2020-update/
https://www.drroyspencer.com/2020/05/why-the-current-economic-slowdown-wont-show-up-in-the-atmospheric-co2-record/
http://www.drroyspencer.com/2019/04/a-simple-model-of-the-atmospheric-co2-budget/
Again that Moh-who site.. of propaganda nonsense
STOP IT !!
Nick
So the answer is you don’t know???
I interpret that you are implying that no land was cleared before 1850 and no land after 1900.
Doesn’t stop him guessing, and claiming he’s right.
Land was not cleared of grass and trees then just allowed to sit unused! The land was either planted to crops or to grass that has more sugar making ability for grazing.
Waza,
Your original question was not a dumb question at all. The simple answer is that there is no proof whatsoever that the rise in CO2 from 1850 to 1900 was due to fossil fuel burning, or to land clearing as suggested by Nick. Further, as I vaguely recall advising Nick on a previous occasion, his statement “with about half going into the sea” is not supported by any AGW models that I have seen. Check out the Global Carbon Budget for details. In the vast majority of cases, it is less than a quarter that is absorbed by the oceans, according to their models. The other quarter (on average) is allegedly taken up by the terrestrial biosphere, though this is highly variable due to model assumptions about ENSO (i.e. natural) variations. Please note that I am absolutely not endorsing these models, just passing on the information.
Simply showing that you can create a model that could possibly be an explanation for the observed data relationships does not constitute proof. A model is no more than one possible hypothesis and is totally dependent on the validity of the model’s initial assumptions. It must also demonstrate consistency with related data, such as the 13C/12C data for Law Dome. Perhaps Nick has done this with his hypothetical model?
Agree. The models are at best hypotheses to be tested. That is how scientists use models.
Thanks for the useful link, Nick. The discussion you hosted there, in the comments section, is also constructive.
I’ve added a link to your blog article on my web page about the topic, under “Additional Resources.”
BTW, the CDIAC Houghton land use data link on your blog page has gone dead; the new one should be:
https://cdiac.ess-dive.lbl.gov/trends/landuse/houghton/1850-2005.txt
In general, I don’t have high confidence in estimates of CO2 emissions from land use changes. However, from 1850 to 1900, according to ice core data, atmospheric CO2 concentration rose by 10.5 ppmv (285.2 → 295.7), even though fossil fuel use emitted a total of only about 5 ppmv (11 PgC). So I agree that a major source of rising CO2 levels, during that period, was probably land use changes.
Changing topics… did you notice this comment, addressed to you, about the logarithmically diminishing effect of CO2 concentration changes on radiative forcing [and Hansen (1988)‘s remarkable blunder]?
OK, Dave, let’s look at this without any preconceived ideas. The nearest samples from Law Dome that come close to your values for 1850 and 1900 are: 284.0 ppmv and 294.22 ppmv (I just love those 5 significant figures – not). Do you agree? Anyway, the respective δ13C values for the same samples are -6.651 and -6.754 per mil. So, WE KNOW that that average incremental CO2 from 1850 to 1900, which you say comes from land usage changes, has a δ13C of about -10 per mil. This is nowhere close to the value expected for vegetation changes (-24 per mil). Please explain.
Jim, I used figures from this GISS source (coincidentally, 1850 & 1900 are both on the first row). They show CO2 going from 285.2 → 295.7, rather than from 284.0 → 294.22, from 1850 to 1900 (seems close enough for gov’t work).
I know little about how δ13C variation reflects different carbon sources and sinks. Perhaps you can educate me?
CO2 from coal & oil combustion and CO2 from land use change are ultimately biologically sourced, just from very different times. So am I correct in assuming that δ13C can’t distinguish between them?
(I understand that natural gas can have weird δ13C signatures, but there was little natural gas used in the 1800s, so we can probably ignore that, right?)
What about δ13C from the oceans? How does it compare to biological, soil, and oil & coal sources?
The arithmetic seems non-trivial, to me.
IF there were no ongoing exchanges of carbon between various reservoirs (air, ocean, biosphere), then you could do simple weighted averages: a 10.5/285.2 = +3.68% increase in CO2 would mean that if all the additional CO2 were at -24 per mil then the atmospheric δ13C would change by .0368×-24 = -0.88.
But we’re dealing with a 50 year interval, and in that amount of time most of the carbon in the atmosphere will have been exchanged for carbon in other reservoirs, much of it several times.
So, what do the δ13C figures from the ice cores tell us about atmospheric CO2 sources & sinks?
Dave,
The data I quoted were actual sample measurements by CSIRO and included both CO2 and δ13C for the exact same samples. I was just highlighting how the δ13C of the incremental CO2 can easily be calculated. However, the ice core data suffer from some ‘scatter’ and it is better to do a longer term determination based on all the values through the relevant period of 1850-1900 or, indeed, for all values from the point of initial growth of CO2 in about 1750 (which, incidentally, gives a value of -13 per mil). Also, you cannot use % change in CO2 to determine % change in δ13C, since you are mixing quantities with ratios (see equation 2, below). For a constant net δ13C value for the incremental CO2, the relationship is linear between δ13C and the reciprocal of CO2, and is the basis for the Keeling plot (more on this in a moment).
An aside: as a scientist, I do not like to consider potential hypotheses until I have learnt as much as I can from the actual data (observations, measurements). As you say, the situation with multiple sources and sinks could be very complicated. On the other hand, if the data demonstrated a very simple relationship, such as all of the incremental CO2 from 1750 up to the present day having a constant net δ13C (averaged over a few years to avoid the influence of ENSO), that would be an important constraint on any hypothesis – agreed? In addition it would definitely be a ‘wow’ moment. What follows are extracts from a much longer paper, which is still work in progress.
The mathematical basis for the Keeling plot is based on conservation of mass principles and is set out in equations 3, 4 and 5 in Kőhler et al (2006):
https://bg.copernicus.org/articles/3/539/2006/bg-3-539-2006.pdf
1. CO2(new) = CO2(old) + CO2(addition)
2. δ13C(new)*CO2(new) = δ13C(old)*CO2(old) + δ13C(add)*CO2(add)
These two equations make no assumptions about sources and sinks, and simply reflect the mass balance in the atmosphere of CO2 and 13C respectively and the ‘add’ terms may be the net effect of a combination of fluxes. The second equation contains a very small (insignificant) approximation. Since we are multiplying CO2 and δ13C (effectively the 13C/12C ratio) to get the quantity of 13C, we should be using 12CO2 rather than total (measured) CO2. However, since 12CO2 is 99% of total CO2 this is not material when applied to all three terms in the equation.
Finally, combining these two equations, we get:
3. δ13C(new) = (δ13C(old) – δ13C(add))*CO2(old)/CO2(new) + δ13C(add)
So, provided that δ13C(add) is constant, a plot of δ13C(new) against 1/ CO2(new) will yield a straight line with an intercept of δ13C(add). This equation 3 is the basis of the Keeling plot. Kőhler et al (2006) then state that: “There are two basic assumptions underlying the Keeling plot method: (1) The system consists of only two reservoirs. (2) The isotopic ratio of the carbon in the added reservoir does not change during the time of observation”. Point 2 is certainly true, but point 1 is not strictly a requirement. There could be more than two reservoirs (sources/sinks) but the method will still work provided that point 2 is maintained. Of course, the probability of such a multi-reservoir system having a constant net δ13C(add) ratio over time would be extremely small. Conversely, if the Keeling plot does show a strong linear relationship, that can only occur if the net δ13C of additional CO2 is not changing significantly over time.

Figure 1 in Kőhler et al (2006) shows the Keeling plot of the Law Dome data, where they derive a δ13C of -13.1 per mil (r-squared 0.96) based on ice data from 1750 to 1977 and firn data thereafter. Next, here is the Keeling plot for the South Pole direct observations from 1977 to 2019 (monthly data downloaded from the site of the Scripps CO2 program at https://scrippsco2.ucsd.edu/, seasonal cycle removed by Scripps):
In this case, we see a δ13C of -13.0 per mil (r-squared 0.99). Incidentally, the ‘steps’ on the graph coincide with ENSO events and Pinatubo, but that’s for another day as part of an ongoing assessment based on ‘listening to the data’.
Wow!
Dave, sorry, I forgot to add the link to the δ13C flux info:
https://www.esrl.noaa.gov/gmd/outreach/isotopes/c13tellsus.html
(scroll to bottom of page and note that these are relative to an atmospheric value of -8 per mil).
Dave,
Sorry I didn’t get back to that thread. Yes, I think both Hansen and I mis-spoke. The forcing is linear with temperature, not CO2 concentration.
However, I don’t think it makes a substantial difference in what Hansen is saying, whether the increase is linear or exponential. But he (and I) should have got it right.
You are too modest when you equate Hansen’s mistake with your own, Nick. Anyone can make a mistake. I make them all the time. Hansen’s mistake was far worse than yours, because it took you just days to admit your mistake, and to the best of my knowledge, Hansen still has never admitted his error.
And it wasn’t just Hansen, either. He made his error in collaboration with seven highly credential coauthors, and with the review of both peer-reviewers and an editor of a prestigious journal, which has left the error uncorrected for more than thirty years.
You’re mistaken in thinking that his error was of little consequence. It made a huge difference in the implications of anthropogenic global warming. Here’s the quote again:
If that statement were true it would mean that under the “business as usual” scenario A we could expect exponentially rising radiative forcing & temperatures.
Translation: Something Had Better Be Done!
Like all the mistakes in that paper, it greatly exaggerated the negative consequences of normal GHG emissions, thereby making manmade climate change sound scary, despite the preponderance of scientific evidence which, then as now, indicated that manmade climate change is modest and benign, and CO2 emissions are beneficial, rather than harmful.
“Hansen’s mistake was far worse than yours,”
No, on the contrary. My statement was explicitly wrong. Hansen’s is not exact, but substantially right. The log behaviour of CO2 has quite small influence in the range we have experienced to date. The increase that Hansen is talking about is exponential in increment. It would, if sustained since industrialisation give a CO2 ppm of something like 280 + A*exp(0.15*t). The forcing would go as
log(280 + A*exp(0.15*t)), which is not linear; in fact for our still relatively small increments is would be about log(280)(1+A*exp(0.15*t)/280+…). Since Hansen is talking about increments, that is very close to exponential increase.
But you are following your usual gotcha process of finding some words that can possibly be misinterpreted. In fact Hansen gave calculations and graphs, which used the log relation. That is correctly shown in Fig 2 in his paper. The increase isn’t strictly exponential, but pretty close.
Yes the temperature is FORCED to comply with CO2 rise.
Its called “adjustments”
.
Now that would be a first. !!
WTF does that even mean ???
Are you saying it gets warmer as temperature rises ???
About your level !!
Much of the CO2 rise over a century ago was due to oceans becoming saltier and warming. This is primarily in the Atlantic where this warming also leads to reductions in Arctic ice.
I downloaded the Poyet paper a few weeks ago and have read much of it. A good summary of many of the factors that convinced me there is no climate problem.
I have also recently read another paper, Seim/Olsen 2020. This is a physics paper on the greenhouse effect. It seems to experimentally falsify the claims that CO2 causes any major warming. Might be a good paper to review on WUWT.
https://www.scirp.org/journal/paperinformation.aspx?paperid=99608
Abstract
The Greenhouse Effect was simulated in a laboratory setup, consisting of a heated ground area and two chambers, one filled with air and one filled with air or CO2. While heating the gas the temperature and IR radiation in both chambers were measured. IR radiation was produced by heating a metal plate mounted on the rear wall. Reduced IR radiation through the front window was observed when the air in the foremost chamber was exchanged with CO2. In the rear chamber, we observed increased IR radiation due to backscatter from the front chamber. Based on the Stefan Boltzmann’s law, this should increase the temperature of the air in the rear chamber by 2.4 to 4 degrees, but no such increase was found. A thermopile, made to increase the sensitivity and accuracy of the temperature measurements, showed that the temperature with CO2 increased slightly, about 0.5%.
Richard M
Very interesting paper. I note that they also say in the conclusion
“These findings might question the fundaments of the forcing laws used by the IPCC.
Another possibility is that our set up has unexplained heat losses that cancel the effect of the increase backscatter IR and prevent higher temperatures in the rear chamber, but after testing this and finding only slight losses, we do not see this could be the case.”
It is easier than the above experiment.
Take two identical masses of dry air. Supply enough energy to bring both to -18 C. The energy can contain no IR at 15 micro. Now pick one and supply same amount of energy but with IR. According to theory the IR mass should be at 15 C.
You can do this from specific heat tables.
However, according to thermodynamics the specific heat of dry air is fixed at specific temperatures and the energy can be in “any form”. So there will be no difference.
There is no climate sensitivity in regards warming. The increased mass caused by CO2 may cause very slight cooling. More mass more energy required to attain same temperature.
The one thing they have not accounted for is thermalization. CO2 colliding with another molecule happens 1000 – 10000 times faster that re-emitting 15 um radiation with the concentrations at the surface. A lot of energy could be floating around the CO2 front chamber simply by collisions if there is not enough radiation to saturate all of the CO2 molecules.
Since we are also dealing with CO2, the measuring devices should be “tuned” to only 15 um.
I also note that there were no controls on the heating plate other than trying to make it a “black body”. Painting a substance black isn’t enough to guarantee that it radiates at all wavelengths like a Planck curve. The chemistry of the plate, i.e. aluminum, etc. is no guarantee that any 15 um energy is radiated. It will basically radiate at whatever the emission characteristics of the underlying substance is.
The cavalier attitude that the earth is a black body is entirely taken as a given by too many people. The earth is made up of elements and molecules having discreet energy absorption/emission wavelengths. It is funny how this is constantly treated this way for the atmosphere but not for the earth. If radiative physics means anything, it means the same thing everywhere. Yet try to find any research on what substances make up the earth and are heated by the sun and then emit 15 um EM waves. Better yet, what substances making up the soil of earth absorb “back radiation” from CO2.
Lastly, CO2 radiates Electromagnetic waves as a point source. This means they are spherical and follow an inverse power law based on distance. These authors “seem” to make the mistake of thinking they are emitting “photon bullets” that should ricochet back into the heated chamber like a bullet. It just doesn’t work that way. There is probably a lot of standing waves bouncing around in the front box that never return or leave.
OK, now I’ve removed duplicates and relaxed the BI Restriction and now I’m up to 140 sites that show no continuous uptrend over the past 120 years. The screen shows that there are 1121 Stations that have data since Dec 1900. That means that over 10% of weather stations show no warming, and I’ve just started looking. Rarely do I find a station that shows a definitive uptrend, and they are mostly city locations. Regression trends on this kind of volatile data are worthless. The R-Squares are near or at 0.00. People that see trends in these charts simply don’t know how to read charts.
https://data.giss.nasa.gov/gistemp/station_data_v4_globe/
Steveston (49.1333N, 123.1833W) ID:CA001107710
Maiduguri (11.8500N, 13.0830E) ID:NIM00065082
Zanzibar (6.222S, 39.2250E) ID:TZM00063870
Laghouat (33.7997N, 2.8900E) ID:AGE00147719
Luqa (35.8500N, 14.4831E) ID:MT000016597
Ponta Delgada (37.7410N, 25.698W) ID:POM00008512
Wauseon Wtp (41.5183N, 84.1453W) ID:USC00338822
Valentia Observatory (51.9394N, 10.2219W) ID:EI000003953
Dombaas (62.0830N, 9.1170E) ID:NOM00001233
Okecie (52.1660N, 20.9670E) ID:PLM00012375
Vilnius (54.6331N, 25.1000E) ID:LH000026730
Vardo (70.3670N, 31.1000E) ID:NO000098550
Port Blair (11.6670N, 92.7170E) ID:IN099999901
Nagpur Sonegaon (21.1000N, 79.0500E) ID:IN012141800
Indore (22.7170N, 75.8000E) ID:IN011170400
Enisejsk (58.4500N, 92.1500E) ID:RSM00029263
Vladivostok (43.8000N, 131.9331E) ID:RSM00031960
Nikolaevsk Na Amure (53.1500N, 140.7164E) ID:RSM00031369
Nemuro (43.3330N, 145.5830E) ID:JA000047420
York (31.8997S, 116.7650E) ID:ASN00010311
Albany (35.0289S, 117.8808E) ID:ASN00009500
Adelaide West Terrace (34.9254S, 138.5869E) ID:ASN00023000
Yamba Pilot Station (29.4333S, 153.3633E) ID:ASN00058012
Wilsons Promontory Lighthouse (39.1297S, 146.4244E) ID:ASN00085096
Mount Gambier Post Office (37.8333S, 140.7833E) ID:ASN00026020
Cape Otway Lighthouse (38.8556S, 143.5128E) ID:ASN00090015
Lencois (12.567S, 41.383W) ID:BR047571250
Eagle (64.7856N, 141.2036W) ID:USC00502607
Orland (39.7458N, 122.1997W) ID:USC00046506
Bahia Blanca Aero (38.733S, 62.167W) ID:AR000877500
Punta Arenas (53.0S, 70.967W) ID:CI000085934
Brazzaville (4.25S, 15.2500E) ID:CF000004450
Durban Intl (29.97S, 30.9510E) ID:SFM00068588
Port Elizabeth Intl (33.985S, 25.6170E) ID:SFM00068842
Sandakan (5.9000N, 118.0670E) ID:MY000096491
Aparri (18.3670N, 121.6330E) ID:RP000098232
Darwin Airport (12.4239S, 130.8925E) ID:ASN00014015
Palmerville (16.0008S, 144.0758E) ID:ASN00028004
Coonabarabran Namoi Street (31.2712S, 149.2714E) ID:ASN00064008
Newcastle Nobbys Signal Stati (32.9185S, 151.7985E) ID:ASN00061055
Moruya Heads Pilot Station (35.9093S, 150.1532E) ID:ASN00069018
Omeo (37.1017S, 147.6008E) ID:ASN00083090
Gabo Island Lighthouse (37.5679S, 149.9158E) ID:ASN00084016
Echucaaerodrome (36.1647S, 144.7642E) ID:ASN00080015
Maryborough (37.056S, 143.7320E) ID:ASN00088043
Longerenong (36.6722S, 142.2991E) ID:ASN00079028
Christchurch Intl (43.489S, 172.5320E) ID:NZM00093780
Hokitika Aerodrome (42.717S, 170.9830E) ID:NZ000936150
Auckland Aero Aws (37.0S, 174.8000E) ID:NZM00093110
St Paul Island Ap (57.1553N, 170.2222W) ID:USW00025713
Nome Muni Ap (64.5111N, 165.44W) ID:USW00026617
Kodiak Ap (57.7511N, 152.4856W) ID:USW00025501
Dawson A (64.0500N, 139.1333W) ID:CA002100402
Atlin (59.5667N, 133.7W) ID:CA001200560
Juneau Intl Ap (58.3567N, 134.5639W) ID:USW00025309
Skagway (59.4547N, 135.3136W) ID:USC00508525
Hay River A (60.8333N, 115.7833W) ID:CA002202400
Prince Albert A (53.2167N, 105.6667W) ID:CA004056240
Kamloops A (50.7000N, 120.45W) ID:CA001163780
Banff (51.1833N, 115.5667W) ID:CA003050520
Mina (38.3844N, 118.1056W) ID:USC00265168
Merced Muni Ap (37.2847N, 120.5128W) ID:USW00023257
So Entr Yosemite Np (37.5122N, 119.6331W) ID:USC00048380
Santa Maria (34.9500N, 120.4333W) ID:USC00047940
Maricopa (35.0833N, 119.3833W) ID:USC00045338
Ojai (34.4478N, 119.2275W) ID:USC00046399
Death Valley (36.4622N, 116.8669W) ID:USC00042319
Rio Grande City (26.3769N, 98.8117W) ID:USC00417622
Beeville 5 Ne (28.4575N, 97.7061W) ID:USC00410639
Carlsbad (32.3478N, 104.2225W) ID:USC00291469
Burnet (30.7586N, 98.2339W) ID:USC00411250
Mtn Park (32.9539N, 105.8225W) ID:USC00295960
Williams (35.2414N, 112.1928W) ID:USC00029359
Needles Ap (34.7675N, 114.6189W) ID:USW00023179
Loa (38.4058N, 111.6433W) ID:USC00425148
Priest River Exp Stn (48.3511N, 116.8353W) ID:USC00107386
Republic (48.6469N, 118.7314W) ID:USC00456974
Rangely 1E (40.0892N, 108.7722W) ID:USC00056832
Lovelock (40.1906N, 118.4767W) ID:USC00264698
Pendleton (45.6906N, 118.8528W) ID:USW00024155
Nevada City (39.2467N, 121.0008W) ID:USC00046136
Culbertson (48.1503N, 104.5089W) ID:USC00242122
Indian Head Cda (50.5500N, 103.65W) ID:CA004013480
Sherman (33.7033N, 96.6419W) ID:USC00418274
Ballinger 2 Nw (31.7414N, 99.9764W) ID:USC00410493
Ocala (29.1639N, 82.0778W) ID:USC00086414
Akron 4 E (40.1550N, 103.1417W) ID:USC00050109
Yates Ctr (37.8786N, 95.7292W) ID:USC00149080
Alfred (42.2497N, 77.7583W) ID:USC00300085
Georgetown (6.8000N, 58.15W) ID:GYM00081001
Casa Blancala Habana (23.1670N, 82.35W) ID:CUM00078325
Ft Kent (47.2386N, 68.6136W) ID:USC00172878
Moosonee (51.2833N, 80.6W) ID:CA006075420
Jackman (45.6275N, 70.2583W) ID:USC00174086
Columbia Rgnl Ap (38.8169N, 92.2183W) ID:USW00003945
Srinagar (34.0830N, 74.8330E) ID:IN008010200
Olekminsk (60.4000N, 120.4167E) ID:RSM00024944
Turkestan (43.2700N, 68.2200E) ID:KZ000038198
Shimla (31.1000N, 77.1670E) ID:IN007101600
Silvio Pettirossi Intl (25.24S, 57.519W) ID:PAM00086218
El Golea (30.5667N, 2.8667E) ID:AG000060590
Salamanca Aeropuerto (40.9592N, 5.4981W) ID:SP000008202
Kahler Asten Wst (51.1817N, 8.4900E) ID:GME00111457
Coloso (18.3808N, 67.1569W) ID:RQC00662801
Nassau Airport New (25.0500N, 77.467W) ID:BF000078073
Tarpon Spgs Sewage Pl (28.1522N, 82.7539W) ID:USC00088824
Cape Hatteras Ap (35.2325N, 75.6219W) ID:USW00093729
Hamburg (40.5511N, 75.9914W) ID:USC00363632
Charlottetown A (46.2833N, 63.1167W) ID:CA008300301
Saint Johnsbury (44.4200N, 72.0194W) ID:USC00437054
Lake Placid 2 S (44.2489N, 73.985W) ID:USC00304555
Elmira (42.0997N, 76.8358W) ID:USC00302610
Franklin (41.4003N, 79.8306W) ID:USC00363028
Sparta (43.9364N, 90.8164W) ID:USC00477997
La Harpe (40.5839N, 90.9686W) ID:USC00114823
Ashley (46.0406N, 99.3742W) ID:USC00320382
Tooele (40.5353N, 112.3217W) ID:USC00428771
Lander Hunt Fld Ap (42.8153N, 108.7261W) ID:USW00024021
Green River (41.5167N, 109.4703W) ID:USC00484065
Kennebec (43.9072N, 99.8628W) ID:USC00394516
Cooperstown (42.7167N, 74.9267W) ID:USC00301752
Marshall (39.1342N, 93.2225W) ID:USW00013991
Imperial (40.5208N, 101.655W) ID:USC00254110
Milan 1 Nw (45.1219N, 95.9269W) ID:USC00215400
Grundy Ctr (42.3647N, 92.7594W) ID:USC00133487
Laramie Rgnl Ap (41.3119N, 105.6747W) ID:USW00024022
Curtis 3Nne (40.6742N, 100.4936W) ID:USC00252100
Laketown (41.8250N, 111.3208W) ID:USC00424856
Springview (42.8222N, 99.7467W) ID:USC00258090
Culbertson (40.2333N, 100.8292W) ID:USC00252065
Deseret (39.2872N, 112.6519W) ID:USC00422101
Lamoni (40.6233N, 93.9508W) ID:USC00134585
Vestmannaeyjar (63.4000N, 20.2831W) ID:IC000004048
Akureyri (65.6800N, 18.0794W) ID:IC000004063
Maliye Karmakuly (72.3794N, 52.7300E) ID:RSM00020744
Torshavn (62.0170N, 6.767W) ID:DAM00006011
Oestersund (63.1831N, 14.4831E) ID:SWE00100026
Karlstad (59.3500N, 13.4667E) ID:SW000024180
Linkoeping (58.4000N, 15.5331E) ID:SW000008525
Torungen Fyr (58.3831N, 8.7917E) ID:NO000001465
It is also no knowledge whatsoever of how to trend time series that have different variances (there is that fowl word again) and even different means.
“The Sorry State Of Climate Science”
It’s total garbage, so yeah, I guess you could say that’s a sorry state.
Maybe some good stuff, but sadly also partly overcooked concerning ECS. Lindzen and Choi 2011 is provably flawed.
There are several ways to derive an observational ECS, starting with Guy Callender’s 1938 curve, which gives 1.67. The curve and calculation is in essay Sensitive Uncertainty in ebook Blowing Smoke. There is energy budget, for example the Lewis and Curry papers. There is Moncktons equation with properly observed inputs. There is Lindzen’s feedback curve off a no feedback base of 1.2C (Monckton’s equation no feedback is 1.16). All produce estimates between about 1.6 to 1.8C.
Anything lower is just a flawed analysis, as here with Peyote.
Although I agree that 1.6 to 1.8°C is a reasonable estimate of ECS, the true value might be even lower. If you estimate climate sensitivity by comparing atmospheric CO2 level changes to measured temperature changes, you can easily find plausible ECS estimates below 1.4°C, depending the details (such as whose temperature index you trust).
The Berkeley Earth folks did that exercise and tweeted about it:
https://twitter.com/BerkeleyEarth/status/1265595986942058497
They wrote:
I replied with an 11-part tweetstorm (and in comments on their YouTube video, which were initially shadowbanned, but eventually appeared).
Here’s the tweetstorm (unrolled here):
[1/11] BerkleyEarth’s figures imply MUCH LOWER climate sensitivity than IPCC claims.
You show, “About 2.3°C of warming per doubling of CO2 (ignoring the role of other greenhouse gases and forcings).”
But to deduce climate sensitivity (to CO2), you CANNOT ignore other GHGs.
[cont’d]
[2/11] Even if we assume that none of the warming is natural, if 30% of the warming is due to increases in minor GHGs like O3, CH4, N2O & CFCs, then “climate sensitivity” from a doubling of CO2, according to BerkleyEarth’s figures, is only 0.7 × 2.3 = 1.6°C.
[cont’d]
[3/11] That’s a “practical estimate” of climate sensitivity, from surface station measurements. However, if the best satellite data were used, instead of BerkleyEarth’s surface temperatures, sensitivity would be almost 30% lower: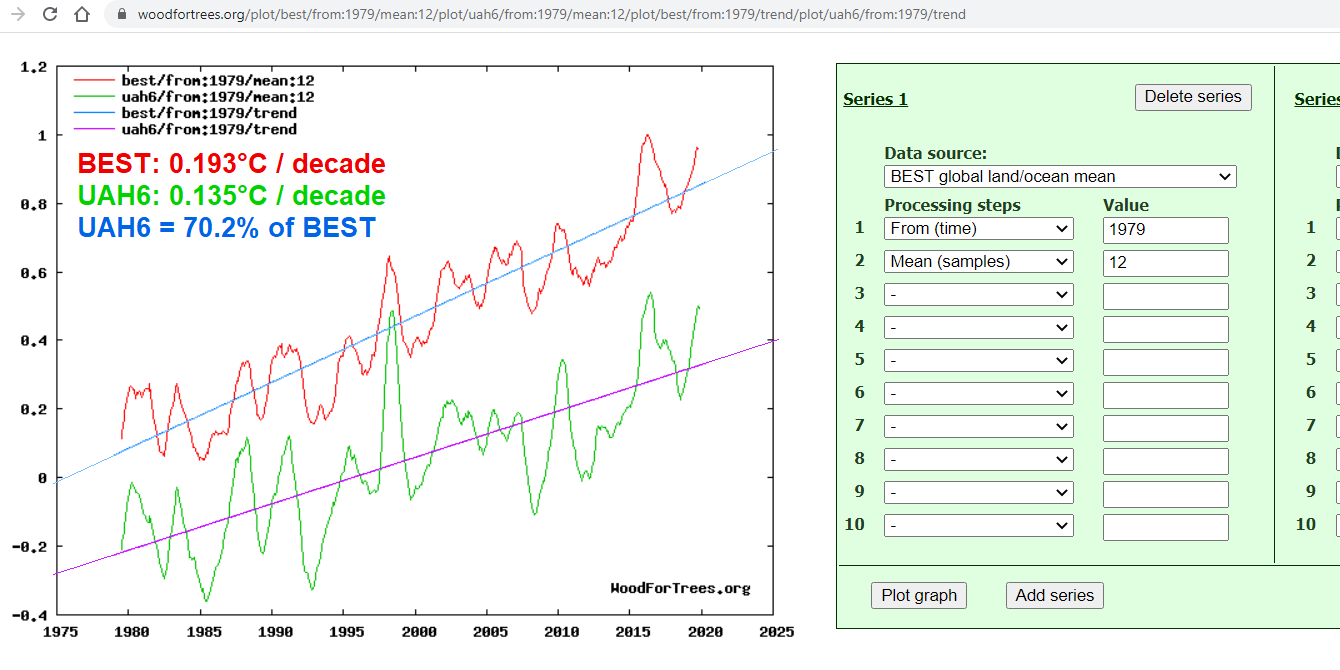
https://woodfortrees.org/plot/best/from:1979/mean:12/plot/uah6/from:1979/mean:12/plot/best/from:1979/trend/plot/uah6/from:1979/trend
https://sealevel.info/BEST_vs_UAH_2020-06-14h_digitization_notes.txt
[cont’d]
[4/11] That makes climate sensitivity to a doubling of CO2 only 1.23°C.
Since that’s based on real-world forcing (instead of the faster rise used for the TCR definition), the 1.6°C or 1.23°C per doubling is “between TCR & ECS” (probably about an average of TCR & ECS).
[cont’d]
[5/11] ECS is usually estimated at 1.25× to 1.6× TCR. So:
If 1.6°C is avg of TCR & ECS (BerkleyEarth), it means TCR is 1.23 to 1.42°C, and ECS is 1.77 to 1.97°C.
If 1.23°C is avg of TCR & ECS (UAH6), it means TCR is 0.95 to 1.09°C, and ECS is 1.37 to 1.51°C.
See: https://sealevel.info/BEST_vs_UAH_2020-06-14h_digitization_notes.txt
[cont’d]
[6/11] That gives an overall TCR range of 0.95 to 1.42°C, and an overall ECS range of 1.37 to 1.97°C.
Those sensitivities are obviously FAR BELOW the assumptions baked into most CMIP6 models and IPCC reports, which means their warming projections are much too large.
[cont’d]
[7/11] You say, “About 1.1°C of warming has already occurred,” and “if carbon dioxide concentrations keep rising at historical rates, global warming could more than triple this century.”
That’s wrong, for two reasons.
[cont’d]
[8/11] 1. It assumes WILDLY accelerated warming, from an approx linear continuation of forcing, for which there’s no basis. Even BerkleyEarth’s 0.192°C/decade yields only 1.536°C of add’l warming by 2100. UAH6’s 0.134°C/decade yields only 1.072°C by 2100.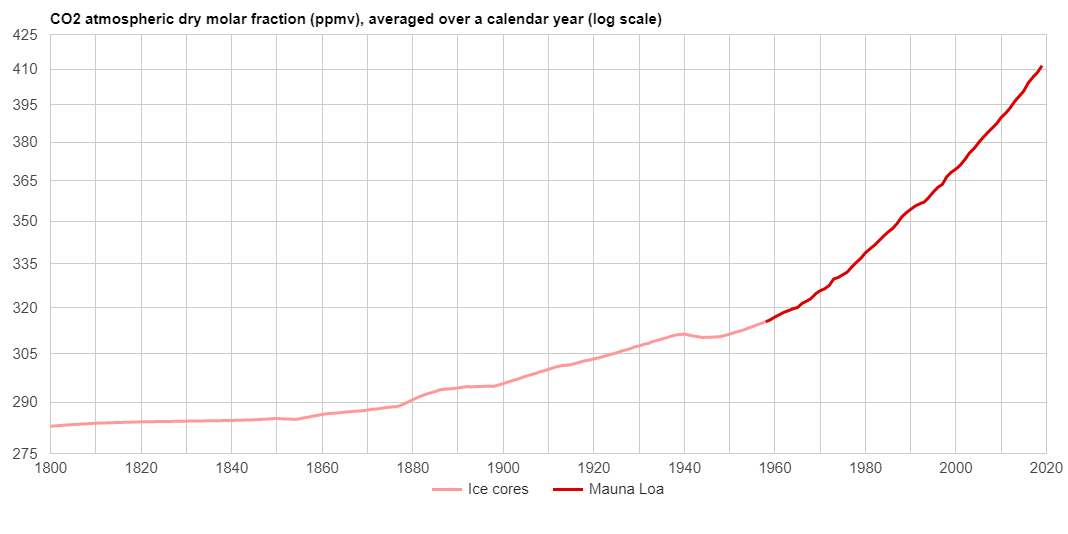
https://www.sealevel.info/co2.html?co2scale=2
[cont’d]
[9/11] 2. It assumes an implausible continuation of exponentially increasing CO2 level growth (necessary for continuation of the linear trend in forcing). But resource constraints ensure the forcing trend will fall below linear long before 2100.
https://www.researchgate.net/publication/303621100_The_implications_of_fossil_fuel_supply_constraints_on_climate_change_projections-A_supply-side_analysis
[cont’d]
[10/11] Also, negative feedbacks (mainly terrestrial “greening,” and oceans) are removing CO2 from the air at an accelerating rate.
https://sealevel.info/feedbacks#greening
So (unfortunately!) it’s unlikely that mankind’s use of fossil fuels can ever drive CO2 level above 700 ppmv.
[cont’d]
[11/11] Since CO2 forcing trend log(level) is almost certain to fall below linear later this century, rate of temperature increase, which is already too slow to reach the temperatures you project, should slow BELOW even the current slow 0.134°C to 0.192°C/decade linear trend.
###
[12/11] @BerkeleyEarth, do you not have have any comment on the fact that your data implies a much lower climate sensitivity to rising CO2 levels than the IPCC claims?
[13/11] @BerkeleyEarth, are you there?
@RichardAMuller @stevenmosher @RARohde @hausfath @JudithSissener @BerkeleyPhysics
[14/11] @BerkeleyEarth, will you please reply?
The temperature measurements imply TCR between 0.95 & 1.42°C, and ECS between 1.37 & 1.97°C. Will you at least acknowledge that your measurements imply climate sensitivity well below IPCC estimates?
[15/11] @BerkeleyEarth team: @RichardAMuller, @stevenmosher, @RARohde, @hausfath, @JudithSissener —
Will you please acknowledge that your data shows ECS climate sensitivity to a doubling of CO2 is <2°C, and TCR is <1.5°C?
@BerkeleyPhysics, how about a response?
https://sealevel.info/learnmore.html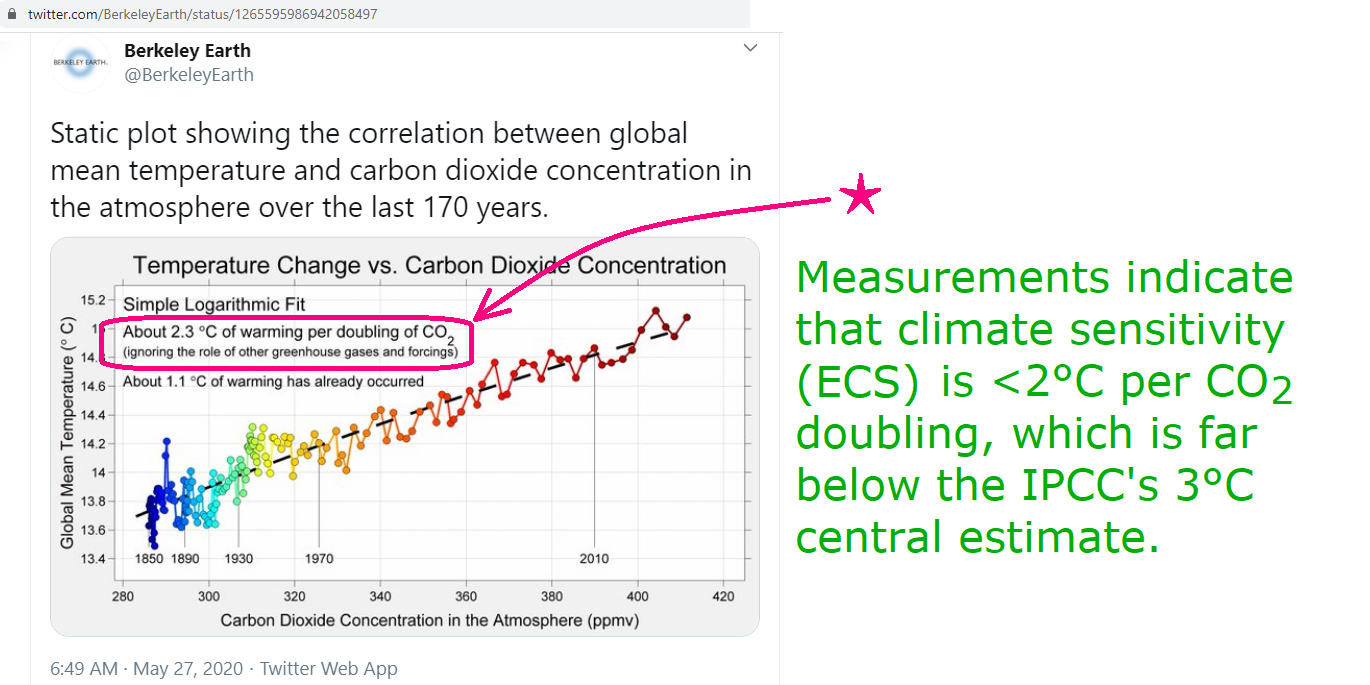
They never replied. I don’t know whether they deliberately ignored my attempts to get them to respond, or maybe they never saw my tweets, perhaps because of censorship by the Twitter Thought Police (who routinely “reply-deboost” me, and sometimes shadowban me).
The solar mechanisms plot by Javier is missing the main solar influence, TSI, only saying ‘Solar Spectral Irradiance 200-315 nm’. Let’s see which wavelengths water really absorbs the most from sunshine, is it UV below 400 nm?
CO2 radiates LWIR between 13 and 18µ. Those wavelengths don’t penetrate or warm water.
“Coastal Waters”, by which I suppose you mean the green waters caused by intermingling of rivers and estuarine waters with ocean waters.
Where rivers are few and small, there is minimal green water; e.g., The west coast of Florida.
Your charts make clear that the higher energy wavelengths penetrate the deepest, imparting their energy to waters up to 200 meters deep.
Infrared wavelengths, that is, the lowest energy wavelengths are strictly surficial.
The book is free as in costing no money. So, download it.
The UK citizens were tired of having people on the continent dictate every aspect of their lives, so they traded in the EU bureaucratic bullies for a home grown bully.
Large tropical volcanic eruptions typically cause a slight warming of the following 1-2 northern hemisphere winters, as they have a positive influence on the North Atlantic Oscillation. So they are not the cause of any little ice age extreme cold winters.
“Source: Javier” over the years 2017-2018.
Welcome back, Javier!