
by Natasha Vizcarra
On the prowl for food, Adelie penguins scan the ice ceiling. They peck at silverfish and hunt for polynyas, gaping holes in the sea ice where shoals of krill and bug-like copepods graze on clouds of algae. When spring comes, the huge plates of sea ice start to melt and later in the brief Antarctic summer all but disappear. Then, algae blooms unfurl: a bacchanalian feast for krill and critters all the way up the Antarctic food chain. Sea ice, sunlight, and food—they all come and go with the seasons in the Southern Ocean.
Paul Holland, a climate modeler with the British Antarctic Survey, has spent the last ten years studying Antarctica’s sea ice and the Southern Ocean. Lately, he has been scrutinizing the seasons of Antarctica and how fast the ice comes and goes. Holland thinks these seasons may be a key to a conundrum: If Earth’s temperatures are getting warmer and sea ice in the Arctic has been shrinking fast, why then is sea ice in the Antarctic slowly increasing?

Opposite poles
Sea ice is simply frozen seawater. Although found only in the Arctic and the Antarctic, it influences Earth’s climate in big ways. Its bright surface reflects sunlight back into space. Icy areas absorb less solar energy and remain relatively cool. When temperatures warm over time and more sea ice melts, fewer bright surfaces reflect sunlight back into space. The ice and exposed seawater absorb more solar energy and this causes more melting and more warming.

Scientists have been watching this feedback loop of warming and melting in the Arctic. To them, Arctic sea ice is a reliable indicator of a changing global climate. They pay the most attention in September when Arctic sea ice shrinks to its smallest extent each year. Measured by satellites since 1979, this minimum extent has been decreasing by as much as 13.7 percent per decade. Antarctic sea ice, on the other hand, has not been considered a climate change indicator. Whereas Arctic sea ice mostly sits in the middle of land-locked ocean—which is more sensitive to sunlight and warming air—Antarctic sea ice surrounds land and is constantly exposed to high winds and waves.
According to climate models, rising global temperatures should cause sea ice in both regions to shrink. But observations show that ice extent in the Arctic has shrunk faster than models predicted, and in the Antarctic it has been growing slightly. Researchers are looking much closer at Antarctica, saying, “Wait, what is going on down there?” Holland is one of those intrigued.
“The Antarctic case is as interesting as the Arctic case,” Holland said. “You can’t understand one without understanding the other.”
Minding the models
To Holland, the discrepancy calls parts of the climate models into question. Modeling groups from around the world collaborate on the Coupled Model Intercomparison Project Phase 5 (CMIP5), which simulates Earth’s climate and predicts how it will change in the near future. World leaders and policy makers rely on it to decide how much countries should limit carbon emissions, known to cause some aspects of climate change.
“Almost all of the CMIP5 models produce a decrease in Antarctic sea ice,” Holland said. “There is a problem in the bit that reproduces the last 30 years of sea ice variability.” Holland was searching for data to improve and verify his own modeling of trends in Antarctic ice when he noticed that other researchers were finding that the trends varied in strength in the different seasons.
Most studies on Antarctic sea ice trends focus on changes in ice extent. For Holland, it was more important to look at how fast the ice was growing or shrinking from season to season. “Changes in climate forcing directly affect the rate of ice growth,” he said, “not the amount of ice.” Year to year cooling in autumn, for example, may cause faster ice growth during autumn, but not necessarily an increase in the amount of autumn ice.

Spring surprise
Holland used data from NASA’s National Snow and Ice Data Center Distributed Active Archive Center (NSIDC DAAC) to calculate the ice concentration rate of growth for each single day, which he called intensification; and the total ice area rate of growth, which he called expansion. “I did that for all thirty years of data and plotted the trends,” he said. Holland’s plots showed that the different regions in the Southern Ocean contributed to the overall increase, but they had very diverse trends in sea ice growth. This suggested that geography and different wind patterns played a role. So to gain more insight Holland looked at seasonal wind trends for the different regions.
Holland found that winds were spreading sea ice out in some regions and compressing or keeping it intact in others and that these effects began in the spring. It contradicted a previous study in which, using ice drift data, Holland and Ron Kwok from the NASA’s Jet Propulsion Laboratory (JPL) found that increasing northward winds during the autumn caused the variations.
“I always thought, and as far as I can tell everyone else thought, that the biggest changes must be in autumn,” Holland said. “But the big result for me now is we need to look at spring. The trend is bigger in the autumn, but it seems to be created in spring.”
“Paul has created two more sea ice metrics that we can use to assess how Antarctic sea ice is responding,” said researcher Sharon Stammerjohn, referring to the measures of intensification and expansion. The new metrics help assess how the system is responding as opposed to simply monitoring the state of the system. “Say your temperature is at 99.2 degrees Fahrenheit,” Stammerjohn said. “You don’t have any insight to that temperature unless you take it again an hour later and you see that it changed to 101 degrees. Then you can say, okay, my system is responding to something.”

Partial explanations
Holland continues to study the Antarctic spring to better understand why Antarctic sea ice is changing. While Holland’s work helps researchers begin to see the problem in more detail, scientists continue to develop ideas about why the ice is expanding.
One study paradoxically suggests that ocean warming and enhanced melting of the Antarctic ice sheet is causing the small but statistically significant sea ice expansion in the region. Another study suggests that rain caused by a warmer climate has been causing an influx of fresh water into the Southern Ocean, making it less dense and inhibiting oceanic heat from reaching sea ice in the Antarctic. To date, there is no consensus on the reason for the expansion.
“Partial explanations have been offered, but we don’t have the complete picture,” said Ted Scambos, a scientist at NSIDC DAAC. “This may just be a case of ‘we don’t know yet.’”

References
Bintanja, R., G. J. Van Oldenborgh, S. S. Drijfhout, B. Wouters, and C. A. Katsman. 2013. Important role for ocean warming and increased ice-shelf melt in Antarctic sea-ice expansion. Nature Geoscience 6: 376–379, doi:10.1038/ngeo1767.
Cavalieri, D. J., C. L. Parkinson, P. Gloersen, and H. Zwally. 1996, updated yearly. Sea Ice Concentrations from Nimbus-7 SMMR and DMSP SSM/I-SSMIS Passive Microwave Data. Southern Hemisphere. Boulder, Colorado USA: NASA National Snow and Ice Data Center (NSIDC) DAAC.
Holland, P. R. 2014. The seasonality of Antarctic sea ice trends. Geophysical Research Letters 41, doi:10.1002/2014GL060172.
Holland, P. R. and Kwok, R. 2012. Wind driven trends in Antarctic sea-ice drift. Nature Geoscience 5: 872–875, doi:10.1038/ngeo1627.
Holland, P. R., N Bruneau, C. Enright, M. Losch, N. T. Kurtz, R. Kwok. 2014. Modeled trends in Antarctic sea ice thickness. Journal of Climate 27: 3,784–3,801, doi:10.1175/JCLI-D-13-00301.1.
Kirkman, C. H., C. M. Bitz. 2011. The effect of the sea ice freshwater flux on Southern Ocean temperatures in CCSM3: Deep-ocean warming and delayed surface warming. Journal of Climate 24: 2,224–2,237, doi:10.1175/2010JCLI3625.1.
Scambos, T. A., R. Ross, T. Haran, R. Bauer, and D.G. Ainley. 2013. A camera and multisensor automated station design for polar physical and biological systems monitoring: AMIGOS. Journal of Glaciology 59(214): 303–314, doi:10.3189/2013JoG12J170.
Stammerjohn, S., R. Massom, D. Rind, and D. Martinson. 2012. Regions of rapid sea ice change: An interhemispheric seasonal comparison. Geophysical Research Letters 39, L06501, doi:10.1029/2012GL050874.
For more information
NASA National Snow and Ice Data Center Distributed Active Archive Center (NSIDC DAAC)
| About the remote sensing data | |
| Satellites | Nimbus 7 and Defense Meteorological Satellite Program (DMSP) F8, F11, F13, F17 |
| Sensors | Scanning Multichannel Microwave Radiometer (SMMR), Special Sensor Microwave/Imager (SSM/I), Special Sensor Microwave Imager/Sounder (SSMIS) |
| Data set | Sea ice concentrations from Nimbus-7 SMMR and DMSP SSM/I-SSMIS Passive Microwave Data |
| Resolution | 25 kilometers |
| Parameter | Sea ice concentration |
| DAAC | NASA National Snow and Ice Data Center Distributed Active Archive Center (NSIDC DAAC) |
The photograph in the title graphic shows sea ice in the Bellingshausen Sea, off the coast of Antarctica, as seen from a NASA Operation IceBridge flight on October 13, 2012. (Courtesy M. Studinger/NASA)
Sorry- off topic- but I think significant:
“World Scientists’ Warning of a Climate Emergency”
https://academic.oup.com/bioscience/article/70/1/8/5610806
One of the senior authors is Bill Moomaw- who I’ve tried to debate here in Massachusetts where he lives but he refuses. He often talks about locking up forests- which is when I try to debate him. I don’t know enough about the other topics to know exactly what he and his cronies have wrong. He’d like to drive us all into poverty to save the Earth- but he won’t go hungry as he has his nice pension from Tufts- thanks to powerful academic labor unions. Perhaps one of the experts here will try to deconstruct this paper as a post to the site.
Let’s start with Figure 1
Most indicators are of a world becoming more prosperous. This is GOOD
f. World is greening because of enhanced CO2
g. total area of Brazilian rainforest is some 5500 million hectares, why shouldn’t a country be allowed to use a small part of its resources ?
o. Fossil fuel subsidies.. are generally NOT subsidies except in third world countries so people can actually afford them.
“Fossil fuel subsidies.. are generally NOT subsidies except in third world countries so people can actually afford them.”
Moomaw and others cry about subsidies for fossil fuels but never if they’re for solar and wind. He’s put solar on his roof and almost certainly gotten subsidies and tax breaks- so he’ll say nothing about them.
subsidies lol
subsidies for fossils and solar are both in the billions
subsidies for fossils per kwh are roughly 1% of those for solar
Now figure 2.. a load of alarmist mis-information and cherry picking
may need a few posts , bear with me.
a. CO2 increase.. absolutely needed by the planet
b. converts to CO2.. not a problem
c. N2O.. .. its in ppb… tiny amounts.
d. Surface change.. some warming after the cold scare of 1970s.
GISS is not representative of reality.
Warming is far better than cooling
e. 1970’s was a year of extreme sea ice, similar to LIA.
Current levels are still far above the Holocene average
Recovery of sea ice slightly towards lower Holocene noms has been a boon for Arctic sea life
f. Greenland ice mass since 1900.
g. Antarctic Ice MAss since 1900
h. Many glaciers didn’t exist before the LIA, retreating glaciers uncover tree stumps, human artifacts etc.
i.. OHC is modelled, could not have been measured, and represents a TINY warming of some 0.07 C (iirc) In perspective.. look at the little red squiggle
j. Ocean acidity (lol).. Oceans are alkaline and highly buffered by carbonates.
Here is the Aloha data against the Flinders Reef reconstruction
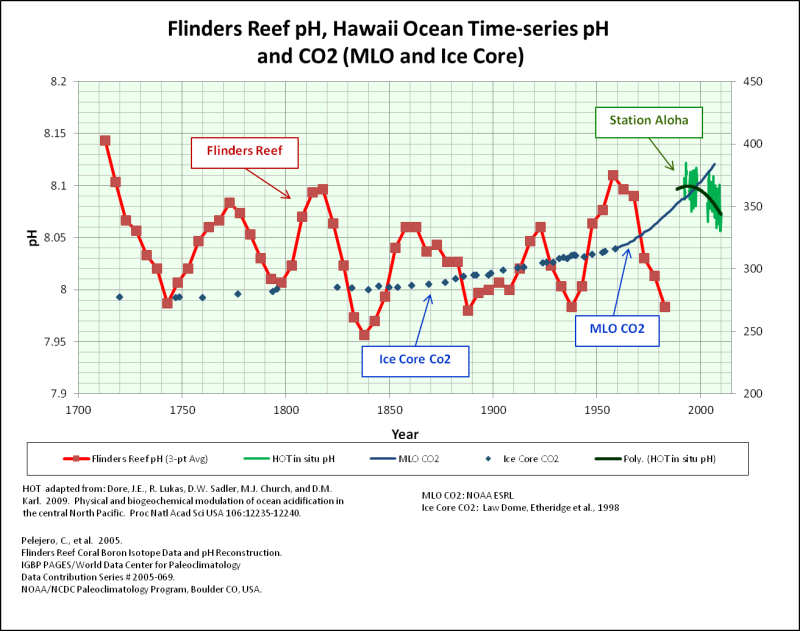
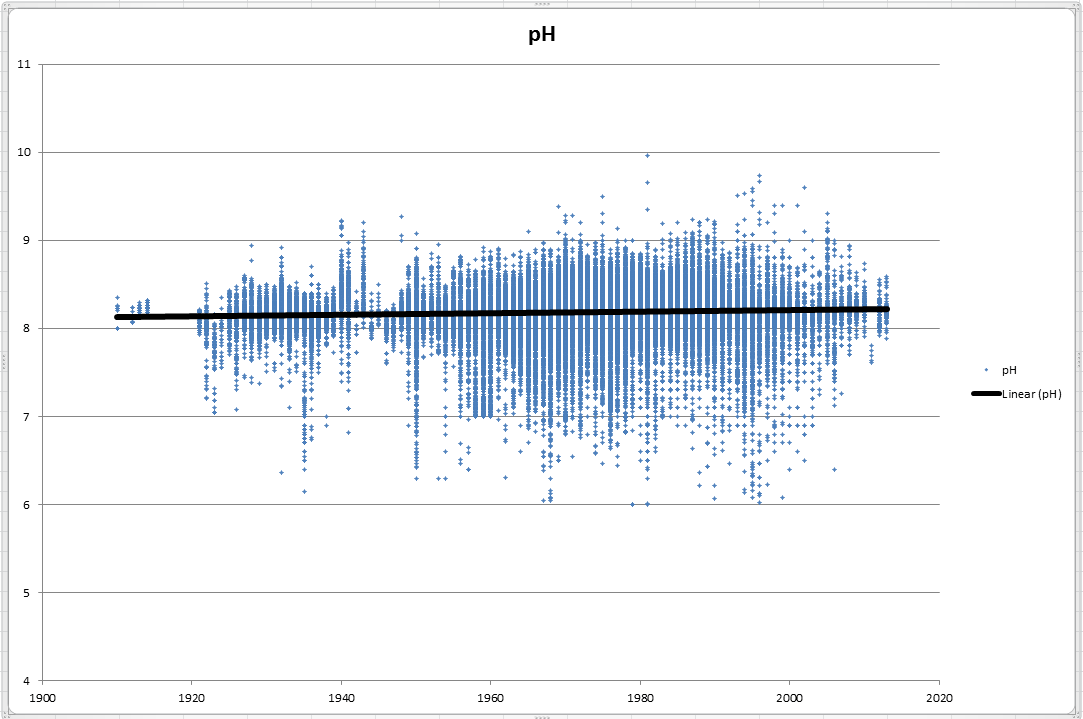
and a compendium of ALL ocean pH measurements since 1900.. slight but insignificant rise in pH
k. global sea level change tide data shows less than 2mm/year and NO acceleration
Acceleration only shows if you use adjusted satellite data at the end of tide data.. a mathematical farce tantamount to fraud..
l Area burnt in USA was FAR greater in the 1930,40s.
m. Extreme weather events ?? Basically a LIE.. all climate data shows basically nothing changng , just natural variability
n.. much larger populations near the coast, increased population third world countries also becoming more prosperous.. so basically nothing to do with climate.
Other may wish to expand on these.
ps, one day I should do a correlation of that Flinders Reef pH and the PDO
see if there is anything there.
“Oceans are alkaline and highly buffered by carbonates.”
And borates!
What Borat got to do with it? 😉
The climate fraudsters like Moomaw know not to publicly debate an informed climate skeptic. They typically get their ass handed to them.
3 years ago, Moomaw wrote an item in the Dogwood Alliance propaganda journal (they’re based somewhere in the American south)- against forestry. I wrote to him with several questions- which I made a point of being ultra polite so he couldn’t say he wouldn’t reply due to my bad attitude- but he refused to respond and continues to not respond despite reminding him periodically. I won’t debate with him on many of the other climate issues but his comments on forests are dead wrong. The same with Bill McKibben who often mentions forests in his books- totally wrong. I deconstruct what he says but he wouldn’t dare reply.
Now some of their “wish-list”
RUBBISH! Wind and solar are unreliable and cause grid instabilities, increasing costs.. They are also massively polluting in their manufactire and short time period disposal. There is absolutely ZERO need to reduce reliance on fossil fuels.
.
Real pollution HAS been massively reduced over the last few decades and continues to be reduced.
Yes we need to protect natures ecosystem.. Stopping biofuels would be a good start.. Continued increase atmospheric CO2 would be another great benefit of all life on Earth.
DOES NOT improve human health, nor would it reduce GHG emissions
Cattle, sheep etc are CARBON NEUTRAL
Is what would happen if the world went full-on renewables The products required would increase mining extraction by a huge amount
https://www.youtube.com/watch?v=RqppRC37OgI&feature=youtu.be
Populations stabilise as populations become developed and have reliable electricity supply
These twerps have sucked fully of the climate trough and kool-aide.
They have ZERO grasp of reality, and are trying to CON those that know even less.
To date, there is no consensus
You don’t see that every day
Ya think maybe the current Interglacial Warming Period has peaked? Once the glaciers start advancing in earnest again, just watch how fast folks start digging up coal and drilling for oil just to stay warm. Let’s see how well solar panels and windmills keep NYC warm today.
Ya think maybe the current Interglacial Warming Period has peaked?
Let me controversial here and give you my honest non-Mannian reply
I don’t know. Possibly.
The Holocene interglacial peaked during its climatic optimum over 5000 years ago.
Until they succeed in sending into the memory-hole.
“Let’s see how well solar panels and windmills keep NYC warm today.”
I would like to see the data on that. They are supposed to get about 12 inches of snow.
We know solar panels don’t work with 12 inches of snow covering them. Do they have to shut down the windmills in this kind of weather?
Do they shut down windmills in this kind of weather? Yes, indeed. Snow and ice on the blades create unbalanced blades which could self-destruct if spinning (plus throwing off lethal amounts of snow and ice). Worse, even stopped, icing on the blades can add enough weight to cause blade failure.
The most ironic thing is one of the methods of de-icing the blades. Not exactly a ‘green’ solution. Check it out:
https://notalotofpeopleknowthat.wordpress.com/2016/12/08/helicopter-de-icing-for-wind-turbines/
So people would be up a creek without a paddle, if the alarmists had their way and everything was powered by windmills and solar panels. People will have to burn their funiture to keep warm.
It’s a stupid, unworkable idea to think windmills and solar panels can power society.
Today? As in solar cells completely covered in snow, today?
Not to worry. The follow on cold front should drive their wind turbines… until the turbines are taken offline due to high winds.
Surrounding states and Canada should refuse to supply backup energy to CYA NYC idiocy.
They will just go back to the 1970’s garbage of blaming the cooling on all of the “soot” they see coming out of the stacks and blocking the sun.
There’s no Climate consensus but then somehow they know there is a Climate Crisis. Complete nonsense.
As Crichton said, “If it’s consensus, it’s not science. If it’s science, it’s not consensus.”
Consensus is the realm of politics and religion, of which climate change is now both.
I don’t understand why the people insist on looking at the Arctic upside down. It isn’t melting. it is just beginning to form ice. Where do they think over a meter of sea level went in the last few thousand years?
It’s arguably not about melting either. Several scientists are of the opinion that severe storms have broken up Arctic sea ice in some of those years leading to losses rather than it due entirely to heat. I’m not sure either way tbh but it’s all very interesting.
Depends on the weather and the flow rate through Fram Strait,
In 2012, a severe storm or hurricane broke up the sea ice and pushed a lot of it out through Fram Strait into warmer waters.
A lot of the ice never melted, it was just turned to slush and as a result wasn’t visible to the satellite.
It’s no surprise that 2012’s re-freeze was one of the fastest on record,
Steve: Sea ice formation and sea ice loss don’t affect sea levels because the ice is floating. Remember Archimedes?
Sea levels having fallen by 2 to 3 metres since the Holocene Thermal Optimum means that an equivalent amount of ice has been added to ice caps in Greenland, but (probably) mostly in Antarctica. Maybe a bit in the Himalayas.
A study on the area covered by the Greenland ice sheet concludes the same thing
Area was LESS during the Holocene optimum, and is currently a small amount down from its peak in the LIA.
“We don’t know yet” is not the research finding that will get more funding, although it is spot-on correct. Looks like the combination of ocean currents and atmospheric wind patterns are affecting the north pole more than the south pole. As I sit here in Argentina, our month equivalent to August in the northern hemisphere, we are in the thjrd day pf cold rain, 18 deg C, and not only the pass to Chile closed by snow but also snow visible in the nearby foothills. Can somebody send me some of that global warming deal? Nice picture of the penguins, I hope the polar bears don’t get them all.
Valparaiso experienced a deluge Sunday morning.
Yeah those Antarctic Polar Bears are hungry beasts aren’t they?
We just had some of our fruit trees treated here in Florida by an arborist who has lived here for years. He commented that while the past few winters have been on the warm side, this winter is back to typical Florida winter cold. My personal observation, having lived here for only a few years, is yes, this winter is Florida COLD!
Ja. Ja. I told you so.
https://breadonthewater.co.za/2021/01/26/am-i-a-climate-denier-denialist/
At least they got the penguins and polar bears right.
ha!!
When a study starts with a falsehood, how can you trust anything else it says.
During the Arctic/Antarctic summer, the albedo differences between water and ice are small.
During the Arctic/Antarctic winter, ice acts as an insulator keep sea waters warmer.
Averaged over the whole year, loss of sea ice is a negative feedback, not the strong positive that the activists want it to be.
I have always felt that “feedback” bogus as they never seem to account for incident angle albedo – it is always assumed that “dark” sea water will absorb more insolence than “reflective” snow and ice.
However at Arctic incident angles the albedo of water is lower than ice and snow.
Insolation, but I like the auto filled typo “insolence”, too.
That depends on where in the Arctic you are. Near the Arctic circle, definitely. Getting close to the pole, much less so.
Beyond that, there’s the issue of how much different. For most of the Arctic, the extra energy absorbed by the ice free sea, is less, to much less, than the extra heat that is being released by the ice free seas, year round.
Ken
It is an optical illusion. While the albedo (diffuse reflectance) of Arctic sea water is less than ice and snow, the total reflectivity can exceed that of snow! Part of the evidence is that the sea water looks so dark from all positions save the special position looking into the sun where the angle of reflection equals the angle of incidence of the sunlight. As the reflectivity of the water increases, there is less sunlight penetrating into the water and able to be reflected by suspended mineral particles and plankton. At 100% surface reflectance, there is 0% available to be reflected internally by diffuse reflectance.
So, the AMO has moved from its (minimum temp) cold phase (North Atlantic Basin) in the 1970s to its (maximum temp) warm phase (North Atlantic Basin) currently. Coincidentally, the Arctic sea ice has tended to melt during this shift in extremes of the cycle from cold to warm. Strangely enough, at the same time the warm surface water was migrating north, the ice at the other end increased. I’m sure there must be some sort of connection there that the “experts” are missing. If only they didn’t already know it was because of CO2 – the science is settled after all.
The more informed Climate Priests understand the 35 year window of opportunity to scam the public that “man’s CO2 wot dunnit ” blame is rapidly closing.
The Antarctic isn’t warming, so no surprise that it’s sea ice has grown since 1979.
So-called global warming isn’t global. It’s supposedly most pronounced in the Arctic, but who knows? The temperature “data” from that zone are largely made up.
The North Temperate Zone has allegedly enjoyed the next most warming, but the data there have been adjusted beyond recognition.
The North and South Tropics should theoretically warm the least, but the South Temperate Zone, mainly ocean, has also not warmed much, if at all. Oz wildfires weren’t caused by summers hotter than in the past.
Temperatures at the South Pole haven’t changed since continuous recording began there in 1958. Antarctic sea ice set a satellite record high in 2014. The record low in Arctic sea ice remains 2012.
The most important non-warming is the tropical warm pools. They are within 1 degree of 30C and will be that way in the Pacific and Indian Ocean indefinitely.
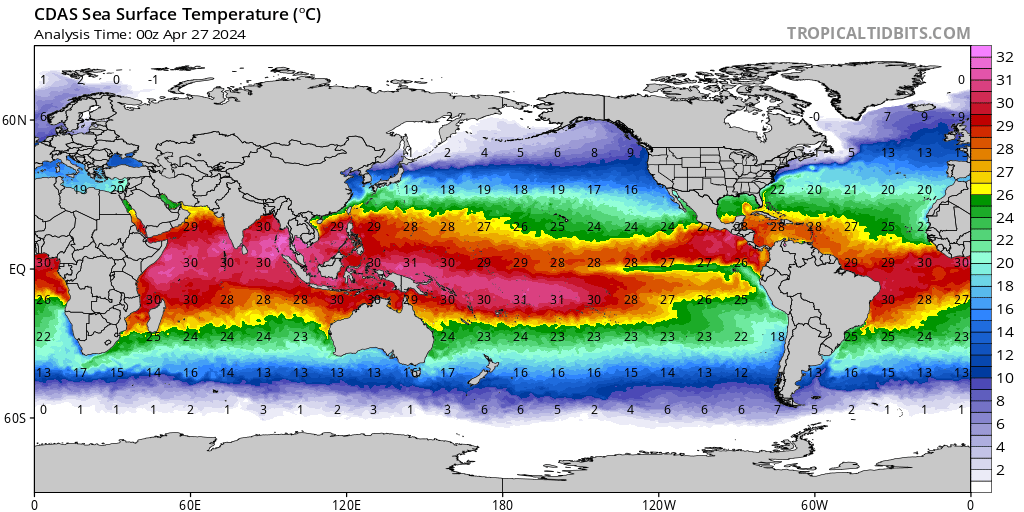
Not sure about The Atlantic. It depends on the Pacific to stay warm and struggles to maintain temperature when the Bering Strait shuts down the heat transfer from Northern Pacific to North Atlantic.
Moral of this article – Climate models are not fit for purpose and the only way to see what is actually happening is to get out into the field and take a good look.
do any of the climate modelers ever describe in complete detail their model? Formulas and flow diagrams and sources of data and the data?
***Measured by satellites since 1979, this minimum extent has been decreasing by as much as 13.7 percent per decade***
Nothing like starting with a false statement. There has been NO decrease in the last decade.
No decrease in trend since 2006, with record low in 2012.
And there are satellite measurements from the early 1970’s as reported by Parkinson’s and Cavaliers.
That earlier satellite data shows 1976 a lot less than 1979 (can’t find graph at this time)
Climate modeler = mathematical onanist. He should stop before he goes blind.
I stopped reading right there. It is porno manga for climate junkies. a truly meaningless exercise.
Like the lad who got caught by his Mom with his pants down – “Can I just do it until I need glasses Mom?”.
This guy already needs coke bottle lenses. He needs to stop now.
When the only tool on your tool belt is a hammer, you can only deal with every problem by striking it with the hammer. To the CAGW carpenters, the only tool they have to support their catastrophe is their models. A result of this is the nearly frantic search for “positive feedback”. Real scientists look for explanations with an open mind. Could it be that known historical “oscillations” can explain 30 years of data?
Exactly, the word “oscillation” should be a clue, but I guess clues aren’t clues to clueless people, or to people pretending to be clueless to fit in.
Oscillations are not data. Only clear trends are.
Admitting that you have a problem is the first step to recovery. Now if only they could let the data drive hypothesis development rather than only looking for explanations that fit the failed AGW narrative.
And why would I trust anyone named Ted ScamBoss?
They seem to have missed out Harald Yndestad’s work.
The influence of the lunar nodal cycle on Arctic climate
I thought Jerry Brown was the expert on Antarctic ice– or was that just a ploy for more revenues.
I might have missed it but I don’t see modeling or discussion of “mushy, crummy, slushy” ice in this. Is there a statement from the trolling “experts”?
Did I miss something? I tried to boil down this article and it came out to”Something happens in the Antarctica that isn’t in our models, but we don’t really understand it…”
Is this what passes for Climate Science?
What a rambling empty flood of words with no firm idea in sight except this Antarctic expanding ice must have a Catastrophic Anthropo Global War
ming cause and we will find it.
Virtually all of climate research of the last 40 years is ‘Whack a Moley’ science, driven by the intractable falsification level criticisms put forth by sceptics. How huge a presence do sceptics have? Well, for one the consensus learned that sceptics never lose a debate! Do I hear a correction? Second, although dissenters apparently make up only 3%, they are bullied, insulted, denied a platform, blocked from publication, and, more menacingly, threatened (Greenpeace: “We know who you are, we know where you live and work, you be few and we be many!”) and considered for facing Nuremburg-type trials….Dusted up in debate, they turned to silencing critics.
Yet, virtually all the research seeks to “debunk” sceptics criticisms of CAGW. And where research can’t do this, they go to data adjustment, ham-handed statistical manipulation and even disappearing of data.
Greenland settlers must have tilled ice and snow because there was no MWP. Hannibal made snowshoes for his elephants and horses and the Romans wore fur-lined togas because there was no Roman Warm Period nor no Holocene Optimum. Record cold in recent years in Chicago, frozen sharks beached in Massachusets and hypothermic tturtles had to be rescued in the Gulf of Mexico because of global warming.
Yes we must find out how gullible warming causes record snow in NE USA, Saudi Arabia, Morocco, South Africa, Israel…
Model mania and the refusal to conform them to observation rather than to each other (as in the CMIP) is just one of many ways this “Climate Dowsing” in the modellers’ divinations of future climate states is nothing but junk science.
“One study paradoxically suggests that ocean warming and enhanced melting of the Antarctic ice sheet is causing the small but statistically significant sea ice expansion in the region.”
–
a paradox is where one view is wrong but one is not allowed to accept the obvious.
iebAntarctica is not warming.
Well not unexpected really, just what you would expect for the phase of AMO.
Arctic Sea ice is currently just above the 15 year mean for this day of year.
And FAR above the Holocene norm, probably in the top 5-10%
AndyG. Looking at this blog over the last few days I’ve come to realize that your name change is all about ambition. So are you trying to post 250 comments? 250 profanities? 250 capitalised words?
Oh look , a little worm from somewhere else.
Cannot argue against FACTS, whoever you are.
You have fantasies about that guy, whoever he is, don’t you. !
Such clever use of language. Do you also wear a false mustache?
Delusional – Only PARTS! Climate models are a limitless load of manure. They are unphysical claptrap based on a fairytale.
It is so sad to think that public funds are directed to the chosen based on the unscientific garbage.
One explanation is heat piracy.
A consequence of the AMOC is that warm surface equatorial water flows from south to north of the equator in the Atlantic. To balance the cold deep current flowing the other way (south). Heat is siphoned from the SH to NH. (It happens around the Caribbean – you couldn’t make it up!) Interhemispheric heat piracy is well known and linked to the related phenomenon of the bipolar seesaw.
https://ptolemy2.wordpress.com/2020/09/12/widespread-signals-of-southern-hemisphere-ocean-cooling-as-well-as-the-amoc/
There was a SF movie with Robert Uhrich (Ice Pirates). At the time I referred to it as “Ice Pirates of the Carribean”. Who would have guessed that it was a thing?
l have my own climate puzzle. Over the last 44 years the claim is that there has been rapid warming in the Arctic. With that been the case, then why has there been no clear warming trend in my record of the date of the first snow of winter since 1977.Because here in the UK in order to get early season snow (pre December) we are very dependent upon a supply of cold coming from the Arctic. As the cold in western Russia is rarely bedded in enough to cause (a beast from the east) this early in the season. So that been the case there should have been at least some trend over that time showing a shift of the first snow turning up later in the season. But this has not been the case.
UAH shows cooling in NoPol from 1980-1995
.
A step up during the 1998 El Nino period
And so far this century no warming except the big 2015-2019 El Nino/ Big Blob event.
.
.
Tales of a rapidly warming Arctic are a FANTASY.
“Its bright surface reflects sunlight back into space. Icy areas absorb less solar energy and remain relatively cool. When temperatures warm over time and more sea ice melts, fewer bright surfaces reflect sunlight back into space. The ice and exposed seawater absorb more solar energy and this causes more melting and more warming.”
Once again, an assertion made by NASA without even a citation to support it. As I’ve argued before, the claim overstates the difference between the reflectivity of snow/ice and sea water at high latitudes.
https://wattsupwiththat.com/2016/09/12/why-albedo-is-the-wrong-measure-of-reflectivity-for-modeling-climate/
The only explanation for growth in Antarctic ice is one that is consistent with prevailing theories of global warming.
Or it could be that Svensmark’s theory applies to the Southern Hemisphere where there are very few humans to add sulfuric acid to the atmosphere and where most of the cloud condensation nuclei form from biological aerosols, the kind predicted by CERN to be enhanced by galactic cosmic rays.
“shrunk faster than models predicted”?
Really? Over two decades of repeated predictions that that Arctic sea ice was going to all melt?
Along with predicted concurrent dooms for animals they claim are dependent upon sea ice?
Easy to write this kind of alleged articles.
A) Rewrite history to establish a red herring lie.
B) Claim to provide a correction to the red herring.
Never mind that Antarctica has refused to melt according to climate modeler and climate alarmist predictions.
Tripe, pure tripe.
Ah but, its rotten ice. Nothing to see here, move along!
“Scientists have been watching this feedback loop of warming and melting in the Arctic. To them, Arctic sea ice is a reliable indicator of a changing global climate.”
It’s a negative feedback to weaker solar wind states since 1995. While a net increase in climate forcing cools the AMO and Arctic, but the Antarctic warms. That’s the polar see-saw effect. AMO and Arctic warming is normal at least during each centennial solar minimum.
“This suggested that geography and different wind patterns played a role.”
I’m shocked, I tell you. Shocked!
The entire effort to model polar ice is doomed to failure because they can only see it through one lens: it’s all due to AGW plus a bit of noise. They “know” the answer before they ask the question.
The models failed to predict the rapid decline from 1997-2007: because it was not caused by CO2.
They then tweaked their models to produce more melting by arbitrary fiddling with feedbacks and parameters. When arctic ice bottomed out in 2012 and recovered to 2007 levels by 2019 they totally failed capture that too: because they only have one hammer and see everything as a nail.
The fact that the Antarctic showed an increase over the same period, totally contrary to what their models predicted shows that they have zero skill in modelling the real world.
But that does not matter because they are not doing science they are playing politics. Something at which they are equally unskilled but their hubris allows them to consider that their cloistered space in academia, protected from the realities of life, somehow makes them qualified to dictate global politics and energy policy.
The fabled albedo feedback is clearly not a dominant factor in the Arctic, despite it always being wheeled out as the OMG argument.
There is little sunlight in the Arctic, NONE for much of the year. What there is is glazing incidence and mostly reflected. This is countered by more heat loss from open water ( no insulating ice layer ) ; increased evaporation and increased IR heat loss all year round.
The idea of run away melting was consistent with the data over the limited period 1978-2012. However, it is totally inconsistent with the following decade. Once you have a positive feedback, the “falling vase” cannot slow and back up a bit.
The albedo feedback, run away melting, tipping point hypothesis is DEAD.
Now apply that admission the the rest of climate pseudo-science.
Some of you might be interested in this graph:
1) it is getting cooler in the antarctic
2) there is very little warming in the SH (when measured on the ground)
3) there is demonstrative warming in the NH
4) there is extra ordinary warming in the arctic.
Click on my name to read my report
<em>‘Antarctic sea ice, on the other hand, has not been considered a climate change indicator.’ </em>
OK a cold ‘snap’ is weather; heatwaves indicate climate change.
Maybe that is why the HadCRUT ‘data’ product now has more Arctic data in it and very little Antarctic data?
So just to make sure we’ve got it correct, they’re unsure of the nature of the build-up and loss of polar ice but either way ‘settled science’ says it’s humanity’s fault!
All of it is just more Politics and less science.
NSIDC for the arctic. Month of March, max extent.
2015 14.51 Million square kilometers.
2016 14.52
1017 14.42
2018 14.48
2019 14.78
2020 15.05
I would suggest that Antarctic sea ice increase is caused by sea surface temperature decrease, or rather that both have the same cause.
This may help Paul Holland – it is certainly a very interesting temperature pattern –
https://wattsupwiththat.com/2019/04/10/the-curious-case-of-the-southern-ocean-and-the-peer-reviewed-journal/