JANUARY 15, 2021
From Not A Lot Of People Know That
By Paul Homewood

There has been much alarum about last year being a “record Atlantic hurricane season”. As I pointed out at the time, the claim was based on the number of named tropical storms, which includes both hurricanes and weaker storms. The number of Atlantic hurricanes alone was not a record.
Because of a tendency to name all sorts of small storms nowadays, not to mention the ability of satellites to spot them, the claim was always a spurious one.
Now we fortunately have the Accumulated Cyclone Energy (ACE) data available for the year, the claim is proven to be nonsensical and deceitful.
Briefly, ACE is a measurement of the intensity of the intensity and duration of Tropical Storms and Cyclones. [Tropical Cyclone is a generic name for storms which are called hurricanes in the Atlantic and typhoons in the W Pacific].
Reliable data for the Atlantic, both number of storms and ACE, is only available since the era of satellites in 1966, as NOAA explain:

https://www.aoml.noaa.gov/hrd-faq/#tcs-to-1930
However, scientists at the Hurricane Research Division of NOAA have diligently examined older meteorological records to re-analyse hurricanes prior to 1966 – details here.
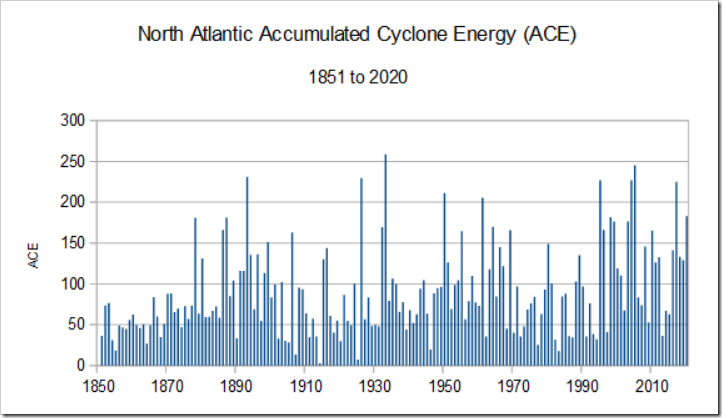
This allows us to make much more meaningful long term comparisons. Their data shows that last year was a long way from being a record hurricane season, or tropical storm for that matter.
In terms of ACE, it was only the 10th strongest, The record year was 1933.

https://www.aoml.noaa.gov/hrd-faq/#tcs-to-1930
http://climatlas.com/tropical/
There is a clear cyclical pattern, with more intense activity in the 1930 to 1970 period, less between 1970 and late 1990s, and an increase since. This is directly related to the Atlantic Multidecadal Oscillation (AMO), a natural cycle which switches from warm to cool over a 50 to 60 year cycle. It was in warm phase in the 1930s to 60s, and has also been in warm mode since the mid 1990s.

NOAA explain the relationship between AMO and Atlantic hurricane activity:

https://www.aoml.noaa.gov/phod/faq/amo_faq.php
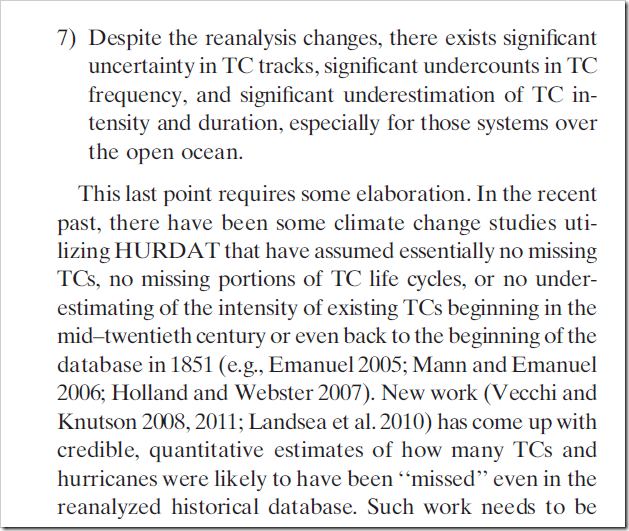
It is also worth pointing out that hurricane activity, even after re-analysis, still likely under records hurricane activity prior to the satellite era. Chris Landsea of the National Hurricane Centre, who has carried out much of the re-analysis work, explained in his paper, Reanalysis of the 1921–30 Atlantic Hurricane Database,

Note how the names of Emmanuel and Mann crop up!
In reality, we are never going to be able to record all of the hurricane activity in the past, as we can now. Nevertheless, it is manifestly clear that there is nothing unprecedented about either last year’s hurricane activity, or that of other recent years.
Hurricanes and Storms will break my bones but names will never hurt me,
Thanks Paul, Good article!
“…there is nothing unprecedented about either last year’s hurricane activity, or that of other recent years.”
I disagree. The MSM’s chicken little wailing and gnashing of teeth is continually reaching record new and unprecedented heights.
Chickens have teeth?
“Chickens have teeth?”
Of course. Just like frogs have very fine hair.
Vestigial teeth Although, it might be more apropos to refer to a “gnashing of gizzard stones.”
Chickens (chicks) have A Tooth … Egg Tooth or Hatching Tooth … that it uses to crack through it’s eggshell on hatching day
Apparently they have breasts, too. Maybe they’re mammals with feathers.
Perhaps related to the duck billed platypus.
The warming AMO is poised to begin its declining phase. Counterintuitively, we can expect Hurricane strikes on the US East Coast to increase as a result. Weaker storms, forming with less oceanic heating, will be marching westward across the Atlantic and will become hurricanes later in their life. Coriolis effects diminish with lesser storm strength, contributing to the situation of slower northward turns, allowing the US East Coast to become a proportionately larger target zone.
There is a very good correlation between annual ACE (Global) and ENSO (13 mo Centered Average centered on August of the same year). R=0.54, R^2=0.29. Because the variations are coincidental, it looks like ACE and ENSO both have a common driver.
It also looks as if the ACE (Global) cycle follows the solar cycle with a delay of about 5 years, i.e. peak cyclone activity followed the peaks in the last three solar cycles with a delay of about 5 years..
So then the peak cyclone activity matches the troughs of the solar cycle?
No, not really. More like the cyclone activity coincides with the back half of the solar cycle.
For example:
So in all three cases, high ACE (Global) showed up about 4 years after the high activity in the solar cycle began, but 2 – 3 years before the trough in the solar cycle.
Earth’s surface temperature is thermostatically controlled. Its control precision is more accurate than any system yet devised to measure it.
Cyclones represent a major source of heat rejection from ocean surface through increase in reflected sunlight and transfer of ocean heat via evaporation to be released over land as precipitation occurs.
The sea surface in the wake of cyclones can be as much as 3C cooler than the temperature before the cyclone.
The net radiation balance at the top of the atmosphere can average -50W/sq.m in the presence of a cyclone. The record 24 hour rainfall measured on land during the passage of a cyclone is 1825mm indicative of very high rates of evaporation from the adjacent ocean surface.
When they started naming anything that looked like a storm, I said then, it was so down the line they’d claim it was getting worse because of “most named storm ever!” They played the same game with “Highest $$$ in damages ever?” as well, but I don’t see that much anymore. Must have stopped being effective.
A single season in a single cyclone basin contains information about global warming???
What about Knutson etal 2010?
https://tambonthongchai.com/2020/03/04/agwcyclones/
2020 Hurricanes were the worst ever and we are all going to die in a burning hell on earth. Paul, you need to get woke and realize that feelings have more importance than those crazy facts that the deniers spout. In a possibly related sense my wife says my sarcasm is getting worse, and I am sure that is a compliment.
I hope that isn’t the best laugh of my day. It could be, but I hope not.
The MSM and The Storm Channel and the AOraCles out there LOVE to use superlatives to give false impressions!
“The worst flooding since…”, “the highest temp since…” etc.
They never mention what happened before the “since”.
Emanuel with one M.
The Mike Mann, Kerry Emanuel 2006 paper was a statistical analysis to try to show it was (is) CC “wot dun it.”
Anyone who has been paying attention for the last 15 years knows that Mannian statistical analyses should be taken with great heapings of skepticism (or scorn?) after the M&M take down of Mikey Mann’s statistical chicanery in his treemometer hockey stick and tortured use of PCA. A disgrace to the profession of science indeed he is.
There tends to be more hurricanes during La Niña and AMO warm cycles, and both of these phenomena are, unfortunately, currently in effect…
If there are more numerical and intense hurricanes this year, there is 100% certainty Leftist CAGW hacks will blame Trump and CO2 for it.
Also, since God seems to have his smite button set on full-automatic hair-trigger mode these days, celestially, a record hurricane season seems inevitable..
Chris Landsea’s work over the decades has always showed great integrity.
Thank you Chris.
From the article: “In terms of ACE, it was only the 10th strongest, The record year was 1933.”
Yes, the 1930’s holds a lot of weather records. That would be because the 1930’s were some of the warmest times in recent human history.
When NASA Climate and NOAA claim this is the “hottest year evah!” don’t believe them, because it was just as warm in the recent past as it is today.
NASA Climate and NOAA are distorting the truth for political purposes.
Indeed, they’ve just released their usual garbage. NASA claims 2020 the hottest evah’ while NOAA claims it’s a tie with 2016. You have to dig deep into the appendices to find that the error bars on their global temperature measurements are larger than the differences. That means they can only claim that there is a *chance* that 2020 was the hottest. Of course, these claims are based on ‘adjusted’ temperatures. GIGO
They have to “name things” whether they are real or imaginary, because it makes them feel important – something like that.
Why not name blizzards? Don’t blizzards deserve names, too? You can’t just single out tropical this ‘n’ that and give it names and think it’s okay if you neglect the cold side of the plate. Not fair! Not fair AT ALL!!!
Actually, the Weather Channel began using a naming scheme for winter storms a few years ago. And Clement Wragge named polar lows near Australia back in the 1890s. But the practice hasn’t had the public attention tropical storm names have had.
Truth is, extra tropical storms are more frequent but less severe than their tropical cousins. Naming them seems less important.
Yes, The Storm Channel has been naming winter weather fronts for years now. The first time it snows, they name it and track the name as it moves across the country, highlighting all the furious flurries and traffic jams produced.
However, they do not name blizzards.
(Not enough of them I’d guess.)
Well, here is Sarf London, we had Snowstorm Franz-Fritz-Ferdinand this morning (16th). Left a couple of centimetres of Global Warming white stuff.
Succeeded this afternoon by Sunny Interval Jacqui-Joy. Only locally – utterly different in the City.
Auto,- enjoying Dark Evening Maya-Britt
I have mentioned this before, but I’ll repeat it again. The ‘rules of thumb’ that NHC hurricane specialists have used over the years have changed. These are not written down procedures, but rather an informal set of practices that morphs over time as personnel change and data quality and observation platforms improve. Many of the short-lived, hybrid systems that were named in 2020 would NOT have been named 20-30 years ago. Either they wouldn’t have been ‘caught’ by satellite as being strong enough to be classified or the specialist would’ve waited to see if the disturbance maintained coherence for 24 hours before bothering with it.
Since these ‘rules of thumb’ were never written down it’s hard to document them post facto. But there has been a slow ‘name inflation’ over the years that contributes to increasing named storms that has nothing to do with climate.
wrote about this back in fall on Weatherbell.com and for the public,CFACT. https://www.cfact.org/2020/09/30/is-wapo-unaware-of-hurricane-history/. https://www.cfact.org/2020/11/27/summing-up-the-northern-hemisphere-tropical-season/. Notice the second article. Our preseason impact forecast issued April 7 showed where they would go. This season was not rocket science. When the MJO flipped in April and May, the gauntlet was thrown down for a high impact season, which is what we are concerned with. You can name a ham sandwich in the middle of nowhere, which appears to be happening. If you want to do this right, have an objective criteria of storms that either originate or pass over water warmer than 25C. Not naming warm core systems ( which we see all the time in the winter) over cooler water ( They have warmed centers relative the cooler conditions around them, and entrain dry air for eye appearances. What drives my nuts is sometimes its like pulling teeth to get a feature named near the coast if it was not seen in advance, but have some eyesore near the azores and its all hands on deck
BTW it was the highest impact season on record for the US. if one is totalling up ace index at landfall I believe I noted that in the second article