Press release from Columbia Engineering
New Columbia Engineering study—first to investigate the long-term effect of soil moisture-atmosphere feedbacks in drylands—finds that soil moisture exerts a negative feedback on surface water availability in drylands, offsetting some of the expected decline
JAN 04 2021 | BY HOLLY EVARTS | PHOTO CREDIT: COLUMBIA ENGINEERING

New York, NY—January 4, 2021—Scientists have thought that global warming will increase the availability of surface water—freshwater resources generated by precipitation minus evapotranspiration—in wet regions, and decrease water availability in dry regions. This expectation is based primarily on atmospheric thermodynamic processes. As air temperatures rise, more water evaporates into the air from the ocean and land. Because warmer air can hold more water vapor than dry air, a more humid atmosphere is expected to amplify the existing pattern of water availability, causing the “dry-get-drier, and wet-get-wetter” atmospheric responses to global warming.
A Columbia Engineering team led by Pierre Gentine, Maurice Ewing and J. Lamar Worzel professor of earth and environmental engineering and affiliated with the Earth Institute, wondered why coupled climate model predictions do not project significant “dry-get-drier” responses over drylands, tropical and temperate areas with an aridity index of less than 0.65, even when researchers use the high emissions global warming scenario. Sha Zhou, a postdoctoral fellow at Lamont-Doherty Earth Observatory and the Earth Institute who studies land-atmosphere interactions and the global water cycle, thought that soil moisture-atmosphere feedbacks might play an important part in future predictions of water availability in drylands.
The new study, published today by Nature Climate Change, is the first to show the importance of long-term soil moisture changes and associated soil moisture-atmosphere feedbacks in these predictions. The researchers identified a long-term soil moisture regulation of atmospheric circulation and moisture transport that largely ameliorates the potential decline of future water availability in drylands, beyond that expected in the absence of soil moisture feedbacks.
“These feedbacks play a more significant role than realized in long-term surface water changes,” says Zhou. “As soil moisture variations negatively impact water availability, this negative feedback could also partially reduce warming-driven increases in the magnitudes and frequencies of extreme high and extreme low hydroclimatic events, such as droughts and floods. Without the negative feedback, we may experience more frequent and more extreme droughts and floods.”
The team combined a unique, idealized multi-model land-atmosphere coupling experiment with a novel statistical approach they developed for the study. They then applied the algorithm on observations to examine the critical role of soil moisture-atmosphere feedbacks in future water availability changes over drylands, and to investigate the thermodynamic and dynamic mechanisms underpinning future water availability changes due to these feedbacks.
They found, in response to global warming, strong declines in surface water availability (precipitation minus evaporation, P-E) in dry regions over oceans, but only slight P-E declines over drylands. Zhou suspected that this phenomenon is associated with land-atmosphere processes. “Over drylands, soil moisture is projected to decline substantially under climate change,” she explains. “Changes in soil moisture would further impact atmospheric processes and the water cycle.”
HT/Clyde Spencer
Earth’s climate is thermostatically controlled. Variation in temperature is just noise. There are tight limits on ocean surface temperature. Cannot be less than -2C because it becomes solid. Cannot be warmer than 32C in open water because shutters are closed tight to sunlight at 30C such that the surface energy balance goes negative – more OLR from the surface than insolation arriving at the surface.
Three disparate oceans all with the same maximum temperature. Only one body of water considered part of the sea surface, Persian Gulf, that regularly exceeds 32C; uniquely it has never experienced a tropical cyclone despite being north of 10N. It rarely experiences cloudburst; only on the southern and southwestern shores near the Arabian Sea.
“Cannot be warmer than 32C in open water because shutters are closed tight to sunlight at 30C such that the surface energy balance goes negative – more OLR from the surface than insolation arriving at the surface.”
Thanks for that tidbit, I Learn something new everyday (-:
“Earth’s climate is thermostatically controlled”
You are mistaken and endlessly repeating your mistake doesn’t change that.
The patches of ocean already at 32C may be “thermostatically controlled” but that does not apply to the whole globe. The area of high water temps can expand and the cold areas shrink. So until the entire sea surface hits 32 the global average can continue to rise.
The main reason you seem to want to cling to this delusion is it fits your meme of “there is no such thing as global warming” and so if you were to concede that (observation) then your pet hypothesis evaporates. Too bad.
Loydo; Your ignorance of the thermodynamic property’s of water & the basic water cycle is astounding !
Really? You still get astounded at Loydo’s ignorance? I’m astounded lol!
I agree with SE,
every time we think Loy[snip] can’t get any more ignorant..
…… he/she/it makes another post…
…… and proves that he/she/it has a lot more ignorance stored up.
[Let’s leave the name calling to the children on other blogs. -mod]
Read it and thought nonsense, then realised it was loydo. Ignorant of everything.
Huh? Where are the cold area’s that can shrink? The Arctic? That’s not a huge area compared to the rest of the oceans. The cold areas around the Antarctic are cooling further thus generating more sea ice.
Tell me again who is delusional?
Umm. You may have posted this to entirely the wrong site Loydo. Most, if not all, here accept that there is, has been, and will continue to be a certain amount of daily, yearly and decadal natural fluctuations in climate both locally and globally. The problem occurs when illiterati try to dictate their religious dogma that the end times are a’coming due to catastrophic man-made thermageddon, unsupported by any proof just fervent faith and belief. Frankly you’d have better luck if you believed in the Easter Bunny!
“… your meme of “there is no such thing as global warming”
Loydo, I think you pressed the wrong [Reply] button, I said no such thing.
You heard about the cooling effect of evaporation ?
And that evaporation is the starting point for cloud building with a cooling effect ?
I haven’t yet found anyone here who thinks “there is no such ting as global warming”. Where did that idea come from? Oh, right. From global warming alarmists trying to mischaracterise the scientific conclusions to which they have reasonably arrived: that there is no reason for alarm at all. Global warming catastrophes exist only in computer simulations – bad ones at that.
Poor loy[snip]
Northern Atlantic SSTs are FALLING
Southern Ocean SSTs are FALLING
AS ALWAYS, you are totally EMPTY of anything to back up your mindless zero-evidence conjectures.
Rick,
It’s not the temperature that’s controlled, otherwise it would be independent of the incident solar energy. What is controlled is the ratio between emissions of the surface and the emissions at TOA whose converged ratio is about 1.62. This ratio ends up being largely independent of temperature, topology, latitude and GHG concentrations and is the only metric that’s the same across both hemispheres.
Clear skies under high pressure results in a lower ratio as more surface emissions escape, while at the same time, less cloud reflection means more solar arrives. Low pressure regions promote cloud formation which has the opposite effect of reflecting solar energy and increasing the ratio between surface emissions and emissions at TOA. Instantaneously, this ratio varies between about 1.3 and 1.8 with a maximum theoretical value of 2 and a minimum theoretical value of 1. The only thing that prevents this ratio from emerging locally is if there is insufficient cloud variability to span the required ratio, however; globally, local deviations from the desired mean are always offset elsewhere.
The result of air pressure equalizing across the planet establishes an average ratio by establishing average clouds. It’s a complex nonlinear passive feedback control system, rather than the oversimplified active linear feedback amplifier the IPCC requires to fudge a climate sensitivity large enough to justify their existence. Since the passive control system model has no internal power supply (this is what passive means), the massive amplification said to arise from positive feedback is not a property of this type of feedback model.
Given a fixed amount of air, the average air pressure must be constant as the chaotic self organization of the atmosphere by clouds driven by differential air pressure results in a predictable average ratio of TOA to surface emissions. While it seems too good to be true, and I thought so until I discovered the math, the converged ratio is the solution to the quadratic equation, g^2 – g – 1 = 0. The math is clear that this is the only possibility for quantifying the average behavior of a chaotic transfer function representing the RADIANT behavior of the atmosphere which is all that matters relative to the radiant energy balance of the planet.
A constant ratio of TOA emissions to surface emissions is representative of a gray body with a constant emissivity given as 1/g. The subsequent sensitivity of T to W/m^2 becomes the derivative of the Stefan-Boltzmann Law using an emissivity of 1/g applied to the average surface temperature. This is about 0.3C per W/m^2 (alpha = 3.3 W/m^2 per degree), and is below the IPCC’s lower limit of about 0.4C per W/m^2. All W/m^2 can perform the same amount of work (Joules are the units of work and Watts are Joules/sec), so this is the 1 and only sensitivity, rather than the plethora of alpha’s claimed by the IPCC in AR6. Also note that maintaining a constant emissivity will minimize the change in entropy as the system changes state and this is a common goal of self organized systems.
http://www.palisad.com/co2/chaos2golden.pdf
No doubt, many may have trouble accepting the elegance of this hypothesis. A challenge for those who can’t accept it is to come up with a better explanation for why despite being a strong function of clouds, this ratio is so incredibly constant and shows no discernible trend across decades of measurements. BTW, this is highly testable and I have yet to find a test that falsifies it.
The server palisad.com can’t seem to find the file.
Your math is persuasive. I have never encountered a positive feedback system that, sooner or later, doesn’t run away (or at least hits the limit of the power supply). Yet we are expected to believe that a positive feedback loop in the atmosphere won’t run away. It’s contrary to the math!
Does your “g” independent variable represent the gain equation of the system?
Tim,
Yes, gain is the ‘amplification’ of W/m^2 of solar input to W/m^2 of surface emissions whose reciprocal is the attenuation (emissivity) of TOA emissions relative to the surface temperature. Sorry, the url is:
http://www.palisad.com/co2/chaos2gold.pdf
The only way that positive feed back can cause runaway is when the implicit power supply is present. When this is there, the output power is limited by the power supply and not the input power. This is one of the flaws with feedback analysis as applied to the climate which assumes an implicit power supply powering the gain which doesn’t actually exist.
A passive system can never run away since the output power is ultimately limited by the input power. The purpose of the precondition of an implicit power supply for applying Bode’s feedback amplifier analysis is that COE need not be considered between the input and output of the open loop gain block. For the climate feedback model, COE must apply between between W/m^2 of forcing and W/m^2 of incremental surface emissions, but it isn’t. The abstraction of calling the output a temperature is the fundamental problem since T is not linear to W/m^2 and strict input to output linearity is also a precondition for using Bode’s linear feedback amplifier analysis.
co2,
I have to admit that I simply do not understand how you can have positive feedback with no power supply. No power supply implies a passive network and with a passive network your output simply cannot be greater than your input. No amount of feedback can change this. Stealing power from the output to provide “positive” feedback would lower the output power. The feedback would do nothing more than try to bring the output power back up to equal the input power.
This is why I’ve never understood how CO2 can be a positive “feedback” generator. If CO2 increases water vapor then that extra water vapor decreases the power being transmitted from the sun to the earth. That’s a negative feedback process not a positive one.
In addition, CO2 in the atmosphere does not have a very direct relationship with the water vapor in the atmosphere. More water vapor doesn’t mean more CO2, at least not very much. A feedback loop requires taking output power to drive the input power higher. If the output (water vapor) does not drive the feedback loop (CO2) then how can it be called a feedback loop? CO2 might be considered a second input to the system but it can’t be a feedback unless it is directly dependent on the output – water vapor.
Tim,
You are right and relative to Bode’s linear feedback amplifier analysis, which is the feedback analysis cited by climate science, neither positive or negative feedback is relevant without a power supply. What is also not possible without a power supply is an open loop gain greater than 1. Your analysis considering that without a power supply, feedback power is mutually exclusive with output power is also correct and not accounted for by climate science.
We can still model the Earth in a feedback like manner with W/m^2 from the Sun as the input and W/m^2 emitted by the surface as the output. For example, the 240 W/m^2 arriving is ‘amplified’ to 390 W/m^2 at the surface. The 150 W/m^2 extra is the ‘feedback’. Bode’s gain equation is:
g = 1/(1/G – f)
where G is the open loop gain, g is the closed loop gain, f is the feedback fraction and each of f, G and g must be dimensionless ratios.
For G = 1 (the only possible value) and g = 390/240 = 1.62, the required value of f is +0.38 which represents 38% positive feedback. The source of the feedback power is not new power from a power supply, but old surface emissions absorbed by the atmosphere and returned to the surface at a later time. It’s the consequence of delay, not power supply driven amplification.
The gain equation derived by Schlesinger (and Roe) assumes G = 1. In another place, they both assume G is a nebulous transformation of W/m^2 into temperature and this bogus, dimensional, non unit G is the basis for the many non physical feedback coefficients. They both confused the feedback factor (f*G) with the feedback fraction (f) providing the false flexibility to have a G with dimensions converting W/m^2 into a temperature. This happened because f*G was incorrectly considerd the dimensionless fraction between -1 and 1, The dimensionless feedback fraction, f, was incorrectly considered to have the reciprocol dimensions of the bogus, dimensional G. It’s a classic case errors accepted by confirmation bias.
Note that the so called ‘water vapor’ feedback is just as bogus as the feedback analysis used to support it.
The feedback control system (clouds) that maintains a constant emissivity is more like the centrifugal governor in a steam engine which is also a passive feedback control device.
co2,
“For example, the 240 W/m^2 arriving is ‘amplified’ to 390 W/m^2 at the surface. “
This is where I always have a problem. W/m^2 is a rate, not an amount. The actual heat amount (i.e. joules) transferred in either direction is a function of time, not rate, and it is the heat (joules) transferred that determines temperature.
The earth emits radiation both during the day as well as at night. So the total heat radiated out by the earth is done so over a much longer period of time (night) than is heat transferred in from the sun (day(. This is for a point location on the earths surface.
So for Qin to equal Qout the heat going out has to be at a lower rate, not a higher rate.
Heat radiated toward the earth from the atmosphere, be it CO2/H2O or something else, has to be a damped sine wave (what gets sent toward the earth gets sent back toward space. each time the cycle happens more heat is lost to space – i.e. the damping factor). The quantity of intercepting atmosphere determines the damping factor (more CO2/H2 means less to space during each cycle, i.e. a lower damping factor). If the damping factor is low enough that the sine wave doesn’t get to zero, then there will be a remnant left over, causing nighttime temperatures to rise. During the day the sun’s input swamps everything and the daytime maximum temps can actually go down if the increased H2O reflects away enough heat.
None of this ever seems to quite make sense to me. Thanks for letting me use you as a sounding board.
Tim,
In the steady state, W/m^2 are all that need be conserved since by definition, the net change in stored Joules is zero.
Stored joules manifests temperature (i.e. 1 gram, 1 calorie, 1 degree C), but in the steady state, the average temperature has already changed, so the only work required is to maintain the temperature which requires providing enough Joules as are being radiated away by an amount proportional to T^4.
Whether we are talking about Joules (energy) Watts (a rate of energy) or W/m^2 (a rate density of energy), energy is always conserved. Watts are integrated over time and W/m^2 are integrated over time and space in order apply conservation. Average W/m^2 are implicitly averaged over time as the equivalent constant rate would have the same effect.
“So for Qin to equal Qout the heat going out has to be at a lower rate, not a higher rate.”
The rate coming from the Sun is indeed higher, but when averaged over 24 hours including when the night time rate is zero, the average rate is equal to the lower rate being emitted.
What you are considering the dampening factor is more easily quantified by bulk properties and geometry. The atmosphere is a mostly isotropic radiator, and what is absorbed by the atmosphere from the surface is roughly evenly split between being sent into space and returned to the surface.
For a simplified bulk model, consider that the atmosphere absorbs about 300 W/m^2 of the 390 W/m^2 emitted by the surface, leaving 90 W/m^2 to escape into space. Half of the 300 absorbed (150) is added to the 90 that passed offsetting the 240 W/m^2 average from the Sun. The remaining half is added to the 240 W/m^2 from the Sun offsetting the 390 W/m^2 of average emissions.
Cloudburst occurs regularly when sea surface temperature reaches 24C. However sunlight still gets to the surface on a daily basis. The moisture taken above the cloud base level is around 5mm. That can be condensed within a day.
As the temperature increases, the cloudburst results in more cloud. By 28C the moisture taken above the cloud base increases to 6.5mm and is more than can be condensed in a day so the cloud persists for longer than a day and sunlight does not reach the surface every day. By 30C the clouds are so persisten that the energy balance actually goes negative; more outgoing radiation from above the cloud level than insolation making it to the surface.
There are patches of sea surface that get higher than 30C but they are not in open water. The only sea surface warmer than 32C is in the Persian Gulf. There, the high level moisture is constantly being replaced with dry desert air from the north such that cloudburst rarely occurs despite the high sea surface temperature and low level humidity.
Look at every tropical ocean surface across the three oceans. They all regulate to a maximum close to 30C despite having completely different circulations and net energy uptakes.
Rick,
This is more like an upper limit and not a regulated value. At about 300K, water vapor as a function of temperature starts to increase exponentially.
http://www,palisad.com/co2/sens/st_wc.png
The incremental latent heat quickly becomes enough to offset the incremental solar energy, setting an effective upper limit on ocean temperatures.
The above plot is the water column as a function of land+ocean temperatures. The relationship is even more defined when applied only to ocean pixels.
It is water vapour above the cloud base that shuts off the surface level insolation. It a very sharp cut off. The surface energy uptake starts falling after 29C and there is next to zero surface area actually at 30C in any of the oceans because the surface is cooling by the time it reaches 30C in open ocean. It is a very precise temperature control related to the water above the cloud base level after cloudburst has occurred. The rain stops but the the cloud persists. Once the water vapour exceeds the daily condensation rate above the level of free convection of 5.6mm, the cloud persists for more than 24 hours. The cloudburst usually requires some surface warming then cooling to trigger the cloudburst but the cloud becomes persistent.
Outgoing long wave radiation is strangled as well due to the cloud as OLR is radiated at about 250K; well above cloud base. But the loss of surface insolation is greater than the loose in OLR.
The role of cloudburst is much more precise with regard to temperature than anything to do with evaporation. Latent heat leaving the surface still has to find its way out to space but the OLR drops down to about 200W/sq.m once the shutters go up.The loss of surface insolation trumps the reduction in OLR by a huge margin. The sea surface can actually be cooling under the midday sun being reflected from the clouds above.
“Latent heat leaving the surface still has to find its way out to space”
Latent heat is not radiant and only radiant energy can leave the planet. Only the liquid and solid water in the clouds can radiate latent heat away, but to do so, the latent heat must have been returned to the water. Keep in mind that for the water in clouds to be considered in the steady state, it must be absorbing the same as it’s radiating, otherwise, it would cool or warm without bound.
To the extent that a Joule leaving the planet can trace its origin to latent heat, surface energy that would otherwise leave the planet must be returnd to the surface to offset the lost latent heat. In principle, latent heat plus it’s offset to the surface has a zero sum influence on the radiant balance at TOA or the surface.
Trenberth did a great disservice by lumping together the energy transported by photons with the energy transported by matter. Only the energy transported by photons has anything to do with the RADIANT balance to which the sensitivity is a consequence. The inclusion of latent heat is a red herring designed to confound and confuse and it does a good job at that.
I wouldn’t go so far as “closed tight”. Most of the world’s cloud cover is caused due to “advection”, lateral movement of air parcels, “weather fronts” to the rest of us. Have a look at the daily EPIC satellite pics.
Simplistically, top of troposphere air is very dry, 10ppm water or so, while surface air is thousands of ppm water content. The cold TOT air is always trying to fall, and warm surface air trying to rise. When the two mix, there is always a sub-dewpoint region on their “mixing line”. Since half rises and half falls, our planet will have at least 50% cloud cover. In reality more, because advection forces the cloud cover over more of the surface than the moisture originally evaporated from…reflecting heat back into outer space…cooling…less evaporation…fewer clouds…etc….
It is very apparent that cloud above the tropical warm pools close tight. The net surface energy uptake goes negative. More energy is lost to outgoing long wave than incoming insolation reaching the surface. There is very little sea surface warmer than 30C. If you look at the track of a cyclone you will see the surface has a negative radiation balance od around 50W/sq.m.
Attached shows actual net energy uptake as a function of sea surface temperature.
Personally, I like “pan evaporation” data, and the various predictive curvefits of that data. Thousands of sites worldwide. The best correlations show evaporation is proportional to wind velocity as well as the difference in water vapor saturation pressure at water surface temp and the water partial pressure in the air 2 meters above. This data shows you can achieve much higher evaporation rates than is explainable by the energy input of solar insolation alone. Obviously evaporation is cooling the surface as well as the resultant clouds blocking out sunlight.
Yup.
Or global warming is not about making the global heat engine {tropical ocean} becoming
“hotter”.
It simple terms it’s about making drier areas become wetter.
We are living in an Ice Age, and that “means” we are living in drier world.
If argument was making global heat engine, wider, that has some merit. Or one could expect
if world became cooler, the global heat engine would shrink in area covered {smaller area functioning as well as a heat engine}.
But main think with global warming is increasing average temperature by the most amount in polar regions. And widening the size of earth heat engine, does do this to some extent.
BUT the entire reason we are in an Ice Age is because our entire ocean is cold- it has average temperature of about 3.5 C. And this cold ocean has biggest effect in terms ocean surface waters nearer and in polar regions. And warmer ocean surface water nearer and in polar regions, will cause these currently dry regions, to become wetter, particularly in the winter {and Fall and Spring}. And quite possible to get more snow, and more snow in polar region, could indicate “global warming”. And in same sense that hottest air day ever measured occurred over century ago, also indicate, we had “global warming” over last 100 years.
Or dry air has more extreme air temperatures, and wetter air has more uniformity or moderated temperatures.
Or place with most greenhouse gases and the most sunlight and the most uniform temperature is the tropical ocean.
Or what does a tropical island paradise, mean?
Trapped on some island? Less people? Or nice weather?
If trapped in traffic jam, maybe not the weather, beaches and warm ocean.
“The team combined a unique, idealized multi-model land-atmosphere coupling experiment with a novel statistical approach they developed for the study”. I don’t think the real world is necessarily “idealized” though. “Novel statistical approach”. Sounds like they just made something up to be different.
In this context, “novel” is the same as “unproven”.
Zhou, et al, have their heads stuck in the soil. The cause for their research theme is increasing atmospheric CO2, which in their world means droughts and floods and existential threat. However, the increasing CO2 helps plants grow faster and bigger and needing less water, so more soil moisture is retained. So the obvious is to examine the interaction between soil moisture changes against the increase in atmospheric CO2. Some “scientists” only look down, others only look up, the correct ones look up and down as needed to acquire actual data appropriate to the topic.
Bigger, faster growing plants would need more water wouldn’t they?
Nope
There have been several studies done showing that increased temperature, water and Co2 improve plant growth – increase one and you get bigger faster growing plants even if the other factors stay the same. Do your research.
Loydo? Research? 🤣
I have a dream. A dream that one day, one momentous day, Loydo will actually have done some flippin’ research on a subject rather than appearing on here like a proselytizing minister of an obscure cult of apocalyptic doomsayers. On the other hand, life’s too short to wait around for a miracle to happen.
Evapotranspiration goes down with higher CO2 thus the plant makes more efficient use of soil moisture. I.e. the plant actually sucks less moisture from the soil.
Yep, more drought tolerant, more frost tolerant, etc…
Loydo, it is long known that increased CO2 grows more food on the SAME amount of land with the SAME amount of water.
( Plants become more land, water, and nitrogen efficient). How can you not know this?
Loydo works very hard to avoid knowing things it’s not supposed to know.
LloydO drinks, and does not know things. It’s what he does.
More CO2 means plants use less water.
Increased air quantity CO2 relieves stressors on plant transpiration allowing the plant to use less water to sustain itself. Lower levels of CO2 is like asphyxiation for plant life. Stress increases and they blow through the water trying to wring out every bit of CO2 they can get.
CO2 makes the world green.
More CO2 leads to less opened stomata, less evaporation, well known since decades.
Make your homework
ROFLMAO.
YET AGAIN… loy-dumb PROVES his abject ignorance
… this time its about plant biology.
So funny
PLEASE keep posting, Loy 🙂
Everyone needs to see just how SCIENTIFICALLY ILLITERATE the run-of-the-mill climate apologist really is.
It would be better if their heads had been in the soil. Everything they described can be measured, yet they resorted to a “multi-model study”. They need to go get their boots dusty and set up a lot of long-term measuring sites.
And they wonder why people don’t believe models. The models can not tell you why, only boots on the ground with real physical measurements can do that. With models that have “novel” approaches that have never been validated, why should one believe?
These “kids” have grown up with Sim City and other games where reality is what you make it to be. Probably most of their teachers have only “blackboard” experience to their credit. Reality will bite you, hope they learn this soon.
Dry land wheat farmers here on the Great Plains could have told them some of this from simple experience. And no, winter wheat is not irrigated, it survives and grows on simple soil moisture. More CO2 means more growth with less water. When are the CAGW proponents going to understand this?
Speaking of “boots on the ground” people, there’s a growing consensus among those who study such things that 3 to 5 thousand years ago the oceans were 1 to 3 meters higher than at present. Further, CO2 levels at that time were around 265ppm, much lower than today; wow, once again I call attention to that flaming ball of fire seen daily as to a primary source of global warming. lol
Here’s something that’s simultaneously amazing and really rather sad.
Quote:
“”Benefits include increased income from greater yields, which results from improvements in soil quality, fertility, and soil-water relations due to cover cropping. Benefits also include reductions in expenses associated with soil erosion control, nutrient cycling, weed control, mycorrhizal fungi colonization, and reduced tillage operations. Almond growers may also benefit from lower beehive prices.””
[What amazes me (also) is that throwaway bit about almonds
wtf is that about? What Is Going On Here????!!!]
Back on topic, its from here:
https://californiaagnet.com/2020/11/24/assessing-the-costs-benefits-of-winter-cover-cropping-in-ca/
What is amazing and lovely is they actually have sussed out something so big and epic regarding climate – thus effectively knowing what’s causing the present thermometry upset and how to fix it.
What is sad is that they have such tiny, self-centred & profit-motivated little minds that they don’t realise.
Unless a few people around this world get out of their (sugar & booze induced) slumbers, we are fooked
Save earth by low carbon
The old models & theories don’t match observations. They don’t understand the real physics & observations. So they used complicated climate model(s) with many attempts with randomly guessing the parameters each time hoping to get lucky ie. find one that gives the results they wanted. If they wanted to honestly be paid for wasting computer resources blindly trying to guess a parameter to solve a complicated equation when you know the result but not the missing parameter, they should be mining crypto-currencies.
Maybe there should be more reporting of observations & emperical evidence than nonsensical guesswork models that may as well be programmed by monkeys with typewriters.
Are any of the climate models thoroughly explained? That is- all the variables it includes, all formulas, all assumptions, all software? I’d like to look at them. I know Mann won’t show his stuff but maybe others do. If it’s not all out in the open- it should have zero value.
“slight P-E declines over drylands.”
“Over drylands, soil moisture is projected to decline substantially under climate change,”
Talk about cognitive dissonance!
Oooops!
Are the deserts getting warmer at night? I doubt it, or the warmunists would be shouting it from the rooftops.
I wonder how the feedback would be modeled when discussing drylands in the short summer, cooler subarctic, boreal regions of the northern hemisphere?
”….. strong declines in surface water availability (precipitation minus evaporation, P-E) in dry regions over oceans”….complete nonsense, the evaporation rate is proportional to wind speed and (1-rel.humidity) of the wind…read up on “pan evaporation rate”….so any decline in surface water availability is counteracted as quickly as the weather changes….
this type of thinking is what happens when people believe CO2 is the Earth’s thermostat, instead of Antoine/Dalton’s laws for water and Cloud cover reflection of sunlight, which is what everyone should have been taught in school.
These guys shut down their “Global integrated drought monitoring and prediction system” when their funds dried up:
https://www.nature.com/articles/sdata20141
Maybe climate monies flow more freely if you churn out garbage computer modeling studies predicting catastrophe, instead of actual measurements showing that things aren’t getting any worse.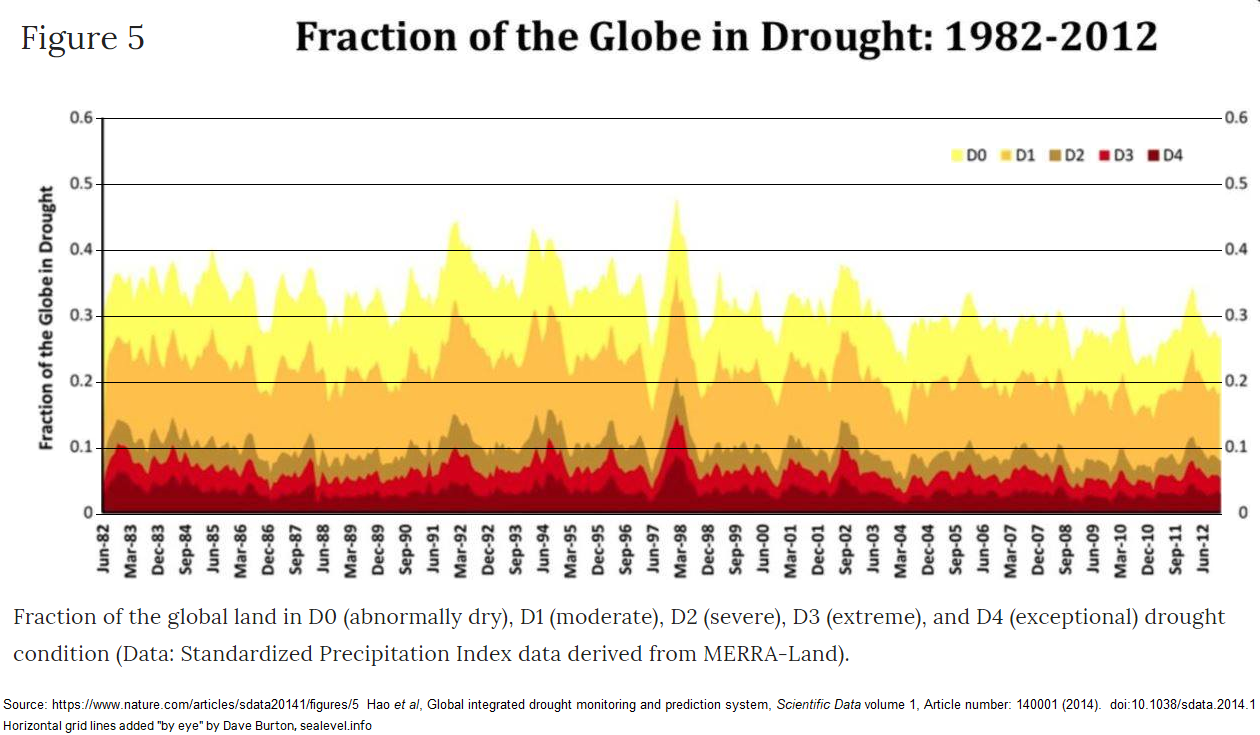
“Because warmer air can hold more water vapor than dry air”
Umm. Right.
I think something might have gone astray in that sentence.
“Surprising News: Drylands Are Not Getting Drier As Predicted by Climate Scientists”
That makes it sound like some measuring was done. Comparisons were made!?
Yet all I read in the article was of models, algorithms, feed back and predictions! Typical!
Stopped reading at “model”. Has anybody measured anything in those drylands lately?
shockingly, warmer temperatures on a nearly-icebound world tend to increase precipitation
doesn’t anyone read about the last Ice Age? it was cold… and dusty
“Idealized”?
“Multi-Model”?
“Novel statistical approach”!?
What novel non-scientific research…
Yet, this team never mentions use of surface and ground water to supply potable water for residents in those dryland areas.
It’s all the fault of that mostly inactive CO₂ molecule! Our idealized multi-model with the novel statistical approach proves it! /sarcasm
Riiigghht.
We are supposed to be surprised when a prediction by “climate scientists” fails?
The surprise would come if they got one right.