Guest “putting it in context” by David Middleton
Our friends at the CO2 Coalition have published another excellent report.
This white paper by Richard Lindzen and John Christy explores the global mean temperature anomaly record. Their focus isn’t on whether it’s right or wrong; it’s on its significance relative to natural variability and its inherently low signal-to-noise ratio. Here’s the executive summary:
STUDIES AND RESOURCES, WHITE PAPERS AND OTHER PUBLICATIONS
4 DEC, 2020
The Global Mean Temperature Anomaly Record
How it works and why it is misleading
by Richard S. Lindzen and John R. ChristyThe CO2 Coalition is honored to present this Climate Issues in Depth paper by two of America’s most respected and prolific atmospheric physicists, MIT professor emeritus Richard Lindzen, who is a longtime member of the Coalition, and University of Alabama in Huntsville professor John Christy.
Professor Lindzen has published over 200 scientific articles and books over a five-decade career. He has held professorships at the University of Chicago, Harvard University and MIT. He is a fellow and award recipient of the American Meteorological Society and the American Geophysical Union. He is also a member of the National Academy of Science and was a lead author of the UN IPCC’s third assessment report’s scientific volume. His research has highlighted the scientific uncertainties about the impact of carbon dioxide emissions on temperature and climate more generally.
Professor Christy, the director of the Earth System Science Center at The University of Alabama in Huntsville, began studying global climate issues in 1987. He has been Alabama’s State Climatologist since 2000 and a fellow of the American Meteorological Society since 2002. He and CO2 Coalition member Dr. Roy W. Spencer developed and have maintained one of the key global temperature data sets relied on by scientists and government bodies, using microwave data observed in the troposphere from satellites since 1979. For this achievement, they were awarded NASA’s Medal for Exceptional Scientific Achievement.
The purpose of this paper is to explain how the data set that is referred to by policy-makers and the media as the global surface temperature record is actually obtained, and where it fits into the popular narrative associated with climate alarm.
Executive Summary
At the center of most discussions of global warming is the record of the global mean surface temperature anomaly—often somewhat misleadingly referred to as the global mean temperature record. This paper addresses two aspects of this record. First, we note that this record is only one link in a fairly long chain of inference leading to the claimed need for worldwide reduction in CO2 emissions. Second, we explore the implications of the way the record is constructed and presented, and show why the record is misleading.This is because the record is often treated as a kind of single, direct instrumental measurement. However, as the late Stan Grotch of the Laurence Livermore Laboratory pointed out 30 years ago, it is really the average of widely scattered station data, where the actual data points are almost evenly spread between large positive and negative values.
The average is simply the small difference of these positive and negative excursions, with the usual problem associated with small differences of large numbers: at least thus far, the one-degree Celsius increase in the global mean since 1900 is swamped by the normal variations at individual stations, and so bears little relation to what is actually going on at a particular one.
The changes at the stations are distributed around the one-degree global average increase. Even if a single station had recorded this increase itself, this would take a typical annual range of temperature there, for example, from -10 to 40 degrees in 1900, and replace it with a range today from -9 to 41. People, crops, and weather at that station would find it hard to tell this difference.
However, the increase looks significant on the charts used in almost all presentations, because they omit the range of the original data points and expand the scale in order to make the mean change look large.
The record does display certain consistent trends, but it is also quite noisy, and fluctuations of a tenth or two of a degree are unlikely to be significant. In the public discourse, little attention is paid to magnitudes; the focus is rather on whether this anomaly is increasing or decreasing. Given the noise and sampling errors, it is rather easy to “adjust” such averaging, and even change the sign of a trend from positive to negative.
The common presentations often suppress the noise by using running averages over periods from 5 to 11 years. However, such processing can also suppress meaningful features such as the wide variations that are always being experienced at individual stations. Finally, we show the large natural temperature changes that Americans in 14 major cities must cope with every year. For example, the average difference between the coldest and warmest moments each year ranges from about 25 degrees Celsius in Miami (a 45-degree Fahrenheit change) to 55 degrees in Denver (a 99-degree Fahrenheit change). We contrast this with the easily manageable 1.2-degree Celsius increase in the global mean temperature anomaly in the past 120 years, which has caused so much alarm in the media and in policy circles.
CO2 Coalition
The full paper is here: Global Mean Temperature Anomaly Record 12.20
This is from their concluding remarks:
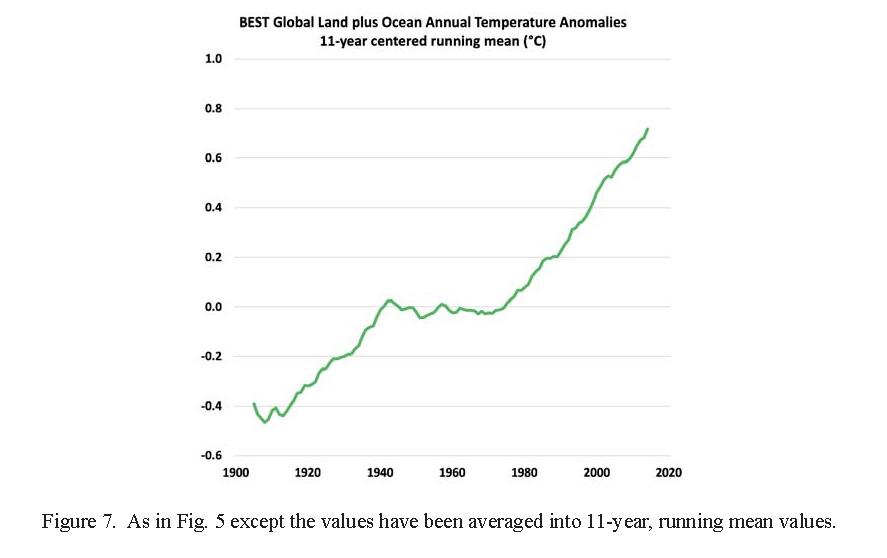
Indeed, the 1.2 degree Celsius global temperature change in the past 120 years, depicted as alarming in Figure 7, is only equivalent to the thickness of the “Average” line in Figure 9. As the figure shows, the difference in average temperature from January to July in these major cities ranges from just under ten degrees in Los Angeles to nearly 30 degrees in Chicago. And the average difference between the coldest and warmest moments each year ranges from about 25 degrees in Miami (a 45 degree Fahrenheit change) to 55 degrees in Denver (a 99 degree Fahrenheit change).
Global Mean Temperature Anomaly Record 12.20
Here’s Figure 7:
Here’s Figure 9:

I think an even better way to put the record of the global mean surface temperature anomaly into proper context, is to plot it at the same scale as a common household thermometer.


In the plot above 0 °C on HadCRUT4 is plotted at 15 °C on the thermometer, the approximate average surface temperature on Earth. Both have a range of 80 °C.
We know the agw schtick is just a pretext for engineering one-world government, but with the help of a complicit media cabal, they’re getting away with it.
Do not minimize the adverse effect of, now 2 1/2 generations of, public school programming along with advanced indoctrination at college campus safe zones around the world (test scores and GPAs optional). This is the real secret to their success.
The media simply reinforces the mandatory ALGORE documentary brainwashing for the 21st century BORG drones. They have gotten away with it already. as the last of the baby boomers are put to ground the Central Authoritarians will announce their new world order.
And we have John Dewey to thank for the dumbing down of American education and the indoctrination of the students. He pushed hard for public education of all students to eliminate the superstition of their parents and make them ideal employees for business.
I’m a baby boomer not yet put to rest. How can I help in the meantime?
Neither my UV meters nor my total solar SWIR meters have shown any significant changes in 30 years. But I can’t make a LWIR meter. It is too weak intensity to allow any existing photodiode/filter to measure it. And too weak to heat either surface or troposphere imo.
Any temperature measurement purporting to show a a global trend over the last 40 years or so is suspect.
The energy balance on Earth is controlled by two temperature extremes. 271.3K at the sea ice interface and 305K in open ocean water. When the lower is reached the surface ices over and slows heat loss. The upper can never be exceeded because the net energy uptake drop rapidly once the SST exceeds 28.5C. The average of these two extremes of 288K is about where the global average sits give or take noise; will remain in that range until the orbital geometry changes significantly from the current situation.
The temperature of the Nino34 region has been stable for 4 decades:
https://1drv.ms/b/s!Aq1iAj8Yo7jNg3j-MHBpf4wRGuhf
The period it has been accurately measured using moored buoys.
“until the orbital geometry changes”
Nope, whether your temperature parameters are correct or not, none of that stops the area of 307K increasing, the area of 271.3K shrinking and land temperatures increasing. All three have and that has resulted in the average is rising.
You didn’t read the comment properly, or you’d realise how stupid your reply reads.
I doubt loydo understands the comment.
When has that not been true?
As we recover from the Little Ice Age when hundreds of thousands of humans died of cold.
No evidence that CO2 causes that.
But you are aware of that , aren’t you.
The warming since the LIA has been sporadic with periods of cooling (1940-1970) and non warming (1980-1997 then 2001 – 2015) and is totally natural in nature.
Atmospheric warming has occurred ONLY at El Nino events
There is absolutely NO CO2 signature in any warming
Plenty of “agenda” signature in the surface fabrications though.
fix…..
Atmospheric warming in the satellite era has occurred ONLY at El Nino events
There was a significant warming from the LIA to the 1930s in most unadjusted NH data.
The only sea surface with temperature above 305K is the Persian Gulf. It cannot form convective available potential energy that drives cloudburst so never gets the thick, reflective cloud cover that occurs in open ocean. It is the only tropical water above 10 degrees latitude with surface temperature above 28C that has never recorded a tropical cyclone. It cannot form the energy relief like open ocean surface.
The measurement of land temperatures has increased; hugely artificially tweaked by the magic of homogenisation. In reality it has not changed this century.
Not quite. When I was a weather forecaster in the Navy, I noticed two ships one day in the Sea of Cortez (Gulf of California) who were reporting sea surface temperatures of 95℉ (308.2K). Also, like the Persian Gulf because of the surrounding topography, no tropical cyclones have ever formed there. To get SSTs that hot (in both places) the bodies of water have to be nearly landlocked and under the subtropical high for an extended period of time (little to no wind). I don’t think the Red Sea meets those conditions. If I remember correctly, the Red Sea has fairly good prevailing winds (NW or SE depending on the season) which keeps the waters well mixed.
Loydo,
You didn’t understand the report at all, did you? How do you know the land temperatures are increasing when the anomaly is within the uncertainty interval of the actual temperatures themselves?
More significantly, how do you know that the land temperatures are increasing when the adjustments exceed the claimed warming trend?
👍👍👍👍
Loydo, if our orbital changes to that similar to Mars then the freeze line will head farther south and 307 k area will decease. Orbital changes matter.
In the eighteen hundreds a bunch of British scientists went all over the world observing and cataloging everything they saw. They calculated at the time that the average world temperature was 14.7C. To this day it is used as a baseline to test the output of jet engines and for aircraft takeoff weight calculations. It would appear that the world is now around15C. Very scary rise .3C in around 150 years. This info is real from an aircraft engineer flight engineer.
W.S. Job L.A.M.E F.E.O
Note that the swings in the Nino 3-4 regions are about +/-2ºC
Must be the fluctuating CO2 , I guess. 😉
RickWill,
Sorry, you are ignoring the basics of what causes planetary albedo. And the effect of the Clausius Clapeyron equation. A 1 degree change in sea surface temperature causes a 7% increase in water vapor molecules above that surface, and significant buoyancy of the warmed air parcel, and 2545 KJ/Kg of ocean evaporative cooling.
As the water vapor convects to top of troposphere which is -55 C, where CO2 content is 400 ppm, but water is only 20 ppm, having all rained and snowed out, …that water vapor forms clouds, clouds, and more clouds also from condensation described again by the Clausius-Clapeyron equation….
Clouds reflect sunlight away from the planet at hundreds of watts per square meter. A few minutes of clouds reflect much more SW than all day of CO2 LW forcing. CO2 is limited to its actual absorption of about 1.2 degrees per doubling, but probably much less due to cloud increase. Clouds bring the heat balance back to a balance within hours or days depending on which way the wind is blowing.
The Albedo of clouds is .5 to .8, ocean is .06, land is .12….Because clouds cover 55% of the planet, the Earth’s Albedo averages 0.3. The average radiative temperature of the Earth is about the temperature half the way up the troposphere. That equation is T=278(1-Albedo)^.25
For A= .3, the temp is 254 K, If A=.06 for ocean, that temp is 274 K, .12 for land gives 269 K, and say .7 for a cloud covered planet gives 206 K which is much colder.
CLOUDS control the planet’s temperature, not CO2….
Mmm, its why body temperature isn’t measured in Kelvin or mountain heights aren’t measured from the centre of the earth. Why would you bother with such a meaningless graph except to obsfucate or disinform?
Why bother with a global average temperature when a global average temperature is not only meaningless but doesn’t exist since we haven’t measured the global temperature for much of the last 1000 years?
Body temperature could simply be measured by Kelvin just as easy as Celsius.
Celsius thermometers for measuring body temp exist today. Just change the scale 35c – 40c to 308k – 313k and 310k is normal.
So, why would it be meaningless to measure body temperature in Kelvin?
To give the numbers context
Calculate a mean of the New York Phone book numbers and find out, if you get a meaningful number 😀
That done, reflect about the meaning of a global mean temperature 😀
Obfuscation is the obscuring of the intended meaning of communication by making the message difficult to understand, usually with confusing and ambiguous language.
The article has done the exact opposite by very clearly putting reality in context.
No, its just doubt-mongering. There is very little doubt the ocean and atmosphere is warming, caused entirely by human activity. Very. Little. Doubt.
The “concluding remarks” above are doubt-mongering 101:
“Indeed, the 1.2 degree Celsius global temperature change in the past 120 years, depicted as alarming in Figure 7, is only equivalent to the thickness of the “Average” line in Figure 9. As the figure shows, the difference in average temperature from January to July in these major cities ranges from just under ten degrees in Los Angeles to nearly 30 degrees in Chicago. And the average difference between the coldest and warmest moments each year ranges from about 25 degrees in Miami (a 45 degree Fahrenheit change) to 55 degrees in Denver (a 99 degree Fahrenheit change).”
None of that has anything to do with the admitted “1.2C” of global warming. The difference between the depths of an ice-age stadial and the Holocene is only 8 or 10C too. That’s less than the diurnal difference, but so what? Didn’t stop a km of ice crushing what’s present day Chicago.
Your so-called “reality” is the ocean’s mixed zone showing accelerating warming, now 10 years above the long-term trend. .https://www.data.jma.go.jp/gmd/kaiyou/english/long_term_sst_global/glb_warm_e.html
Chicago? ffs.
YOU are the one continually casting doubt on the AGW farce, loy
Your inability to produce one single bit of evidence is legendary. 🙂
Thanks for all your assistance. 🙂
There is ABSOLUTELY NO DOUBT that human released CO2 has absolutely nothing to do with the highly beneficial warming.
YOU have made that perfectly clear. 🙂
And 0.7ºC in 130 years …. SCARY !!!!
Must be time to go into a MANIC PANIC, hey 😉
And that’s using a HIGHLY ADJUSTED , agenda driven temperature fabrications which bear ABSOLUTELY NO RESEMBLANCE to reality..
(please don’t pretend you don’t know it uses much adjusted GHCN data. That would be just too ignorant even for you)
And pretending a strong El Nino is “acceleration”…
WOW… talk about MIS-INFORMATION. !!!
Here is actual data for Japan…
Then a slight step between 1995 and 1998.. then…
How SCARY is that , hey !!!!
Now..
…. have you got any empirical evidence at all, that is tiny amount of beneficial warming, which has you SCARED SENSELESS, was caused by human released atmospheric CO2 ???
“admitted “1.2C” of global warming”
Since the COLDEST period in 10,000 years
And HOW GREAT that has been for the planet, hey, loy ! 🙂
And with a bit more warming and a LOT more atmospheric CO2, maybe eventually we can get back, at least partly, to the warmth and ecological abundance of the MWP, RWP or even the Holocene Optimum.
“caused entirely by human activity.”
ROFLMAO
There you go again…..
Making NONSENSE statements when you KNOW you haven’t got even the slightest real evidence to back them up.
You do it just as a CHILDISH attention-seeking attempt, don’t you.
Very SAD and PATHETIC sort of behaviour.
You always forget, the oceans warming is only due to the suns radiation. The oceans warm the atmosphere, proof: Golf Stream.
Loydo,
Climate is determined by the ENTIRE temperature profile, not the average. That means you *must* know what is happening to the minimum and maximum temperatures in order to know what is happening to the climate.
An average hides what is happening with the temperature profile. Thus it is *not* a meaningful metric to use for determining climate impacts. Anomalies from the average of the averages is even less meaningful!
The fact that *you* don’t even know if the average is increasing because of an increase in maximum temperatures or in minimum temperatures is telling evidence that the average is meaningless when it comes to climate.
Tim
Which is why climatologists should be using time-series of min and max daily temps instead of the mid-range value!
Unmitigated horst schist. Not being able to explain something by other causes is not proof that humans are entirely responsible for something. That is an “appeal to ignorance” (argumentum ad ignorantiam) fallacy.
Known natural forcing mechanisms can account for all of the warming from the depths of the Little Ice Age up until The Ice Age Cometh.
If humans caused all of the warming since 1975 (an unprovable assertion), we only made Earth a little warmer than when the Chicken Little cackle du jour was “The Ice Age Cometh.” If the climate models are right (they aren’t), without anthropogenic forcing, it would be colder now than when The Ice Age Cometh.
“Unmitigated horst schist.”
Ah, good old Horst. I knew him well. I was there when he coined the phrase, “Ja ja, das is Scheiße!”
Sadly, Horst is no longer with us, having been run over by a Scheißewagen when he failed to look both ways when crossing the street, on his way to the public bathroom. A great loss to humanity.
Here is what the research shows:
Tett et al. (2000)
Meehl et al. (2004)
Stone et al. (2007)
Lean and Rind (2008)
Stott et al. (2010)
Huber and Knutti (2011)
Foster and Rahmstorf (2011)
Gillett et al. (2012)
From a review of these papers at https://skepticalscience.com//a-comprehensive-review-of-the-causes-of-global-warming.html
“Over the most recent 25-65 years, every study put the human contribution at a minimum of 98%, and most put it at well above 100%, because natural factors have probably had a small net cooling effect over recent decades.
Additionally, in every study over every timeframe examined, the two largest factors influencing global temperatures were human-caused: (1) GHGs, followed by (2) human aerosol emissions” – a cooling effect, reduce those and we get even more W/m2 of forcing.
Can you produce a link to a peer-reviewed study, published in a credible journal, that specifically refutes any of these research papers? And no, I don’t mean images cut and pasted from your WUWT folder.
Defending an Appeal to Ignorance fallacy with a Bandwagon fallacy… Priceless.
But, you did give an idea for my next post.
ROFLMAO
Loydo regurgitates a whole list of AGW cultists/scammer, ALL BASED ON FARCICAL AGENDA-DRIVEN UNVALIDATED MODELS
MODELS ARE NOT EVIDENCE
Anyone with even the tiniest science education KNOWS THAT.
But you obviously don’t.
YOU STILL HAVE NO ACTUAL EVIDENCE OF WARMING BY ATMOSPHERIC CO2
These scammers are as ignorant as you of natural forcings, so their FAKE attribution studies and FAKE correlation studies are just a LOAD OF GARBAGE.
Sorry you don’t have the education to realise that.
Tett et al. (2000) “used an “optimal detection methodology” with global climate model simulations”
MODELS SCIENCE FAIL.
Meehl et al. (2004) “running global climate model simulations…..”
MODELS SCIENCE FAIL.
Stone et al. (2007) “examined a set of 62 climate model simulation…”
MODELS SCIENCE FAIL.
Lean and Rind (2008) “Analyzing what is left over after summing the various contributions shows whether the most significant contributions are being considered’…
….Argument from IGNORANCE of atmospheric actions SCIENCE FAIL.
Stott et al. (2010) “to constrain simulations from five different climate models.”
MODELS SCIENCE FAIL.
Huber and Knutti (2011) “estimated global heat content increase since 1850, calculated how much of the increase is due to various estimated radiative forcings,”
…. Argument from IGNORANCE of atmospheric actions SCIENCE FAIL.
Foster and Rahmstorf (2011) “FR11 found that the three natural effects in their analysis exerted a small net cooling effect from 1979 to 2010,”
…. UTTER BS
Deliberate ignorance of solar effects MASSIVE SCIENCE FAIL.
Gillett et al. (2012) “pplied a statistical multiple linear regression approach to a climate model – the second generation Canadian Earth System Model (CanESM2)”
MODELS SCIENCE FAIL.
NON-Skeptical NON-Science….
Probably the LOWEST form of climate scientists in the world
The UTTER DREGS of the claimate scammers.
The very bottom of the ANTI-SCIENCE climate sewer.
Run by a FAILED cartoonist and psycho who should never have been given a broom, let alone anything even pretending to be actual science.
Just Loydo’s type.
The SUN can account for all UK warming
The SUN can account for ALL NH warming
AMO, and PDO (both SOLAR driven) account for all real NH temperature variations
Cloud cover over the tropics can account for ALL warming since 1983
2 year lagged ocean seismic activity is a FAR better correlation to atmospheric temperatures than CO2
In the Vostok cores, when CO2 was at its highest, temperatures were always decreasing.
ie.. peak CO2 COULD NOT maintain peak temperature.
There is NO EVIDENCE ANYWHERE that atmospheric CO2 causes warming
and I’m guessing you KNOW that, right Loy 😉
You missed this bit: Can you produce a link to a peer-reviewed study, published in a credible journal, that specifically refutes any of these research papers?
Poor loy.
STILL RUNNING AROUND LIKE A HEADLESS CHOOK
HILARIOUS !!!
1… Do you have any empirical scientific evidence for warming by atmospheric CO2?
2… In what ways has the global climate changed in the last 50 years , that can be scientifically proven to be of human causation?
Everyone is STILL WAITING….. and laughing at your childish antics.
Refute what ?
THEY ARE NOT EVIDENCE……
THEY ARE UNVALIDATED, ASSUMPTION-DRIVEN MODELS
Glorified computer games… and not very good ones !
Next you will be asking me to refute a Grimm Bros fantasy.
Only on WUWT could citing research papers be described as a fallacy. Let me take a wild guess about your next post – you’re going to cut and paste the same old images from your WUWT folder again.
No… I’m going to demonstrate how utterly self-defeating your comments to this post have been.
Your bandwagon is simply applying the same Appeal to Ignorance fallacy:
We can’t think of anything else that caused x degrees of warming over y years.
We can build models that explain the warming with anthropogenic CO2.
Therefore, anthropogenic CO2 caused the warming.
https://judithcurry.com/2014/09/16/jc-at-the-national-press-club/
I’ve worksed with the output of “climate model” Loy-dumb, Have you ?
They are UNIFORMLY USELESS.
All over the place, so you could NEVER know if they were correct or not.
A shoot-em-up computer game would have more “science” in it
Pal-Review is meaningless in climate science .
You can tell that by the amount of nil-science climate trash that gets through.
You are NO SCIENTIST, you are a mindless pleb, so you wouldn’t know the difference.
Now, do you want to try, just one little bit of evidence.. come on…
Evidence that isn’t modeled GARBAGE or faked pre-judged attribution nonsense.
1… Do you have any empirical scientific evidence for warming by atmospheric CO2?
2… In what ways has the global climate changed in the last 50 years , that can be scientifically proven to be of human causation?
Everyone is STILL WAITING and laughing more and more at your puerile attempts at evasion and distraction
A 5year old chuckling a tantrum would be less obvious. 🙂
You do a HUGE amount of damage to your cult by your actions, just too DUMB to realise it. 🙂
STILL WAITING !!
STILL WAITING !!
Attribution studies are quite fun to watch. I have seen them being done.
THEY ARE NOT SCIENCE. !
They know what they want the cause to be, so do everything they can to discount contributions by other factors.
Then , as David says, they build a model with their prejudged causation built in, ignoring any effects of other causes, and their model, does exactly what they programmed it to do.
Hey presto, write a paper, submit it to like-minded peers who won’t question the result,and publish. Another worthless, non-science climate paper.
If you think your flashlight cut and paste is representative of the science you are truly clutching at straws.
It could be anything, anything but CO2.
Loydo must be Latin for “point missed”.
O, great Loydo!’Doubt mongering’? Yeah! I’m with you!
‘Nullis in Verbia’? What can this mean?
‘Take no-one’s word for it’ is the motto of the Royal Society. What a shower!
‘I will radically doubt everything I see, because the stick in the water appears broken’ says Descartes, Rene. Who he? He invented something called ‘analytical geometry’ and said scientists should always be skeptical? Unbelievable! Moron!
Then there is this ‘Albert Einstein’ person, who recommended fairy tales to make your child bright. He thought you only needed one person to prove a hypothesis wrong. He-llo-o! Anyone there? The lights are on but there’s no-one at home!
Wise up Albert and Rene (and Isaac): ‘The science is settled’! OK? ‘Suck it up’ (as leading intellectual ‘Whoopi’ (sic) Goldberg tells it). So get used to it.
Or else….
Loydo < "There is very little doubt the ocean and atmosphere is warming, caused entirely by human activity. Very. Little. Doubt."
Naughty, you can't bundle the two together like that.
No ones saying the average global temperature hasn't gone up a tiny amount, to which I would say…. and?
…but, many people have something to say about the cause being "entirely human activity".
What's your solution? every year CO² goes up, and every year some new hashtag is invented to "combat climate change".
Whatever your solution it's not happening anytime soon is it?
Ah yes, the classic progressive whine. Any fact that casts doubt on whatever it is they want to believe today is pure evil and must be destroyed.
“There is very little doubt the ocean and atmosphere is warming, caused entirely by human activity. Very. Little. Doubt.”
When you decide to lie, you go all in.
Loydo
Forgot the important part.
“Very. Little. Doubt.” In, My. Mind.
To doubt is heresy, we get it, and we understand the constraints you operate under.
Walk toward the light Loydo, its nice here
Ha…they are too invested. This is their world view and their religion.
Loydo
“… caused entirely by human activity.”
Then explain why it has been warming on Earth for approximately 20,000 years before the industrial revolution.
All warming has causes, all cooling has a causes. If you are talking about the transistion from glacial to the interstadial there are widely accepted causes at least for the 800,000 years or so: https://en.wikipedia.org/wiki/Quaternary_glaciation
For the modern warming period, now close to 0.2C/decade – when further neo-glacial cooling should otherwise be expected – an abrupt plume of GHG by us is the only realistic candidate.
And the current highly beneficial warming out of the COLDEST period in 10,000 has zero measurable human causation.
You keep proving that by your inability to produce anything apart from model crap and ignorant low-level attribution studies.
1… Do you have any empirical scientific evidence for warming by atmospheric CO2?
2… In what ways has the global climate changed in the last 50 years , that can be scientifically proven to be of human causation?
Keep running away, little trollette.
“further neo-glacial cooling should otherwise be expected”
There’s that arrant anti-science garbage of yours again !!
Weak solar cycles … Little Ice Age
Strong solar cycles.. highly beneficial warming
If you leave the hot plate on near FULL, the water heats up..
Or haven’t you ever boiled a pot of water??? minders won’t let you !!
“an abrupt plume of GHG by us is the only realistic candidate.”
Again, the usual SCIENTIFICALLY UNSUPPORTABLE GARBAGE.
You know you can’t present any actual evidence.
It is just petty puerile trolling/attention-seeking, and DELIBERATE LIES
Maybe one day you will actually manage some REAL EVIDENCE.
You are not even on the playing field yet..
Still sitting in the corner of your basement, sucking your big toe.
1… Do you have any empirical scientific evidence for warming by atmospheric CO2?
2… In what ways has the global climate changed in the last 50 years , that can be scientifically proven to be of human causation?
Loydo,
You claimed, “– when further neo-glacial cooling should otherwise be expected –” Your unsupported assumption is that we should be cooling. Interglacials don’t operate by an appointment calendar! What is telling is that the rate of sea level rise has been very close to linear for about the last 7,000 years. That tells me that whatever the cause of warming, the start preceded human industrialization and is essentially constant over the last several millennia, despite the addition of anthropogenic GHGs.
Clyde, neoglaciation and it’s causes are not “unsupported” at all, on the contrary, it’s not even controversial, its exactly what the Milankovitch cycle theory predicts. There are plenty of research papers about it if you google it.
Loydo is taling a LOAD OF BS again
Nothing unusual about that.
He/she is WELL AWARE that there is no real scientific evidence of warming by atmospheric CO2.
Watch as he dodges and weaves and slither away, yet again.
1… Do you have any empirical scientific evidence for warming by atmospheric CO2?
2… In what ways has the global climate changed in the last 50 years , that can be scientifically proven to be of human causation?
Loydo
I don’t have to ‘verb’ a noun to learn about Milankovitch Cycles. I’m familiar with them. However, that isn’t what is at issue. If you look at reconstructions of past temperatures, what is striking is the saw-tooth shape of the curves. At the end of a major glaciation, temperatures increase rapidly, not unlike what we are currently observing. Had a peak, similar to past interglacials, and subsequent decline been observed, followed by a plateau, then you might have a case that anthropogenic CO2 is responsible for mitigating the effects of the temperature decline. However, that isn’t the case.
It is assumed that anthropogenic CO2 is responsible for the increase in atmospheric concentrations. That is largely based on a correlation between emissions and the growth of the concentration of atmospheric CO2, where the annual growth is about half the annual emissions. However, with the reduction in anthropogenic CO2 this year at 7%
[ https://news.yahoo.com/world-carbon-dioxide-emissions-drop-000444935.html ]
and even larger during the March, April, May time-frame, the reduction in total concentrations cannot be seen! Thus, your “large” contribution seems to be invisible.
Also, your “abrupt plume” doesn’t exist. Instead, there is an exponential increase that, until recently, has been rather flat.
Can I add “Very. Little. Doubt.” to the list of scientific terms used by IPCC and climate scientists? ROFL
It goes along with “Likely, Very Likely, Extremely Likely,” etc.
Such terms capture nothing but the emotional opinion of the one using them. I have “high certainty” that such terms do not belong in a scientific discussion! LOL
Mmm, probabilities, lol. But if someone were to suggest there was *no* doubt, why, that’d be typical of those blinkered, ivory-tower know-alls too right?
You are sowing HUGE DOUBT about atmospheric warming by CO2 loy-d’oh.
Everyone can see that you have ABSOLUTELY NO EVIDENCE.
Everyone can have NO DOUBT that there is no warming by atmospheric CO2 since even a AGW cult sympathiser/aco-lite, like you, cannot produce any evidence..
Your eyes aren’t just blinkered, you keep then blind-folded against that truth, and your ear constantly plug lest a single word of actual REALITY should be allowed into that brain-washed green sludge skull of your. 🙈🙈🙉🙉
Even the sainted IPCC, the gospel of global warming, doesn’t make the claim that 100% of the warming is caused by man.
As usual, Loydo believes whatever he wants to, facts be damned.
You’ve just read it? What does it say?
Obviously Loy d’oh has not read anything from the IPCC
(except snippets in the far-left newspapers from the “political” misdirection of the summary for policy makers.)
Now there is a mindless load of baseless propaganda if ever there was one..
Just the sort of mindless non-science that someone as dumb and gullible as Loy would fall for.
Why would YOU bother with such a meaningless statement, and no evidence of anything….
… except to obfuscate and misinform..
Loy, unless you are a reptile, your body temperature hopefully varies by only tiny amounts..
Makes sense to use Celsius or Fahrenheit (depending which country you are in)
When the global temperature range is from around -80ºC to +50ºC surely you should graph using that sort of range. or at least a range appropriate for the region
Daily temperatures in say Brisbane can range from around 15ºC to 40ºC at this time of year
Let’s not PRETEND that tiny anomalies in a very sparse, highly tainted and variable, homogenised, twisted, infilled, smeared with “regional expectations” and generally just a WAG fabrications…
…. ACTUALLY MEANS ANYTHING. !.
Degrees Kelvin are used so that any calculations using temperature are correct. Doubling the temperature in Fahrenheit doesn’t give the same temperature change as doubling the temperature in Celsius. A simple example, the temperature today was 0 degrees Fahrenheit then I exhaled some CO2 and was able to change the temperature by an infinite number of times to 0.0000000000000001 degrees Fahrenheit.
Assuming that the mean temperature of the planet is 15℃ (59℉ or 288.15K) a 1 Celcius degree rise in temperature would be a 0.3% rise in temperature. Compare that with the 12% daily swing in temperature in the Sahara and Saudi deserts during the summer. Chicken Little anyone?
What difference does it make if body temperature is in kelvin or mountains are measure from center of earth? You would have a fever above 310 k and Everest would still be tall mountain.
Loydo, why don’t you challenge someone like Willis, or commie bob, cementsfriend, etc to a debate about human caused climate change if you are so sure and so knowledgeable?
Loydo is just a green agitator. Complains about North East Queensland being hot and humid; he believes that region would have heavy snowfalls and ski resorts without AGW.
Maybe if he/she moves to Siberia for their winter, he/she can class him/herself as the world’s first climate refugee. 😉
But I bet he/she actually LUVS the WARMTH on the Australian east coast. ….
… and would NEVER actually consider moving somewhere where it actually gets COLD.
Same as he/she would NEVER consider giving up all the trappings and benefits of living in a fossil fuel powered society.
There’s no reason not to measure the body’s temperature in Kelvin, we could completely replace C with K, and as soon as people got used to the new numbers, life would go on exactly as before.
Mountains are measured from sea level just because that’s the way we are used to seeing them. They started that practice back before scientists even knew that the earth was round.
Once again your whines are irrelevant and serve only to prove how desperate you have become.
Loydo
You are suggesting reasons for body temperature measurement and mountain elevations that are false. There is really no difference between deg C and K for measuring body temperature except in calculating a percentage change. The absolute temperature change is unaffected by what is written on the thermometer. Mountains have a base reference of sea level, not the average elevation of land, which is how temperature ‘anomalies’ are calculated. At the time when topographic elevations became standardized, the distance from the center of the Earth was not well known. Besides, that is less useful than knowing how high one is above a datum that might result in flooding.
Your rationalization would dictate that every meteorological station in the world report anomalies based on historical temperatures, rather than absolute temperatures. Actually, reporting station temperatures in K would be acceptable, but it would probably be less convenient for calibrating a LIG thermometer using phase changes of water.
Clyde, the point I was making (probably not very well) is that making a graph that obfuscates or that hides the variation is easy, but why bother unless of course that is your goal?
Why bother posting at all Loy,
Lies and obfuscation are your only tools.
Sorry you still have that incapability of understanding basic graphs.
I don’t think even a kindy teacher could help you now.
Or is it just the data that your little brain-washed mind rebels against !
“the point I was making ”
Your post are uniformly POINTLESS. !
Making a graph that exaggerates tiny differences, just to try to LIE to people about what is really happening….
…… is just blatant propaganda.
Loydo
Your bias blinders are apparently preventing you from seeing the point that David was making, which is that the data should be viewed in perspective and context. He is making the point that by using anomalies (the word is almost as bad as acidification!) the audience is presented with a graphic that accentuates the change and minimizes the incredible stability of the temperatures on Earth.
Without the mythical tipping point, or a hypothetical feedback loop, any alleged rise in the average is immaterial. Bet that we could see the same kind of clear data comparison with the claimed accelerating sea level rise. Good work.
Now there you go again, confusing the issue with facts and not respecting the model output as data.
10 Hail Mikeys and 5 Re-Gretas AND do the stations of the Hockey Stick
Until the satellite era, we didn’t know what the global temperature was.
We only knew the local temperature, as adjusted, for parts of the world which had thermometers.
The rest of it is guesswork, extrapolation and adjustment.
Ditto
The surface coverage was far from global before World War II.
From 1940 through 1975 the =0.3 to -0.5 degree C. cooling (when first measured) has been repeatedly adjusted so that the xooling was only -0.1 degrees C, or no cooling at all, the last time I looked.
Surface measurements are not accurate enough for real science.
UAH satellite data since 1979 are useful.
There has been warming for the past 20,000 years, and since the late 1600’s Maunder Minimum period … and after 1979 too.
But what happened between 1880 and 1979 in the surface record is just a wild guess.
It’s possible there was no warming in that period,. We could be seeing inaccurate non-global surface measurements, infilling and repeated “adjustments”, that falsely claim there was warming in that period.
AGW is indeed a scam. How much more data does a real scientist need?
And pseudo-scientists like Mann (PennState), Kate Hayhoe (TexasTech), or DeRocher at TexasA&M, apparently they all an ad infinitum amount of data to refute before they abandon their favored hypothesis. Climate change science is turtles… turtles … all the way down.
If an AGW “climate scientistᴸᴼᴸ” gets data they don’t like….
….. they torture it, infill it, homogenise it, average it, and twist it inside and out…
….. until it gives them the numbers that want.
They even discussed what they needed to do to it, in the climategate emails…
… so we know that is their MO.
Imagine there’s no problem and everybody’s lost their minds imagining there is.
Hokey, you Nailed It
What’s left of the Enquiring Minds, (are there a few round here) might wonder where the ‘lost minds’ went.
Down the toilet. Literally.
Since the day that Ancel Keys demonised saturated fat and, quite effectively, told everybody it was OK to raid Ma Nature’s Candy Shop. i.e. eat sugar
Yes human brains can ‘burn’ sugar but, they work much better burning Ketones, made from fat.
Dementia is measurable in folks who are simply pre-diabetic – and probably don’t even know it.
Could that be The Thing that consigns us all to the dustbin of history?
Trapped and killed by our own (Dopamine) Reward System -the very thing created & intended to help us survive.
sweet
haha
“Since the day that Ancel Keys demonised saturated fat and, quite effectively, told everybody it was OK to raid Ma Nature’s Candy Shop. i.e. eat sugar”
Now we know what happened to you.
It is said that statistical skill is demonstrated when one can explain the variance, not the mean. By focusing on the supposed global average temperature, any discussion of temperature variation is avoided.
“Skill”?
We doan need no steenkin’ skill.
They’ve got lots of skills.
They are very skilled at lying.
They are very skilled at obfuscating.
They are very skilled at logical fallacies.
They are very skilled at changing the subject.
When I show my panic-stricken friends a horizontal line in not at all thick pencil at 288degs Kelvin they think I’m a climate denier.
…it is rather easy to “adjust” such averaging…
Yes, and at NASA’s GISTEMP it’s done all the time. Here’s the number of changes that have been made to GISTEMP’s Land Ocean Temperature Index (LOTI)
https://data.giss.nasa.gov/gistemp/tabledata_v4/GLB.Ts+dSST.txt
so far this year:
Number of Changes to GISSTEMP’s LOTI for 2020
Jan Feb Mar Apr May Jun Jul Aug Sep Oct Nov Dec
319 240 313 340 298 404 319 370 303 389
Those changes go on as a steady drone every month, and after time they add up. Here’s what that looks like since 1997:
Regarding the basic point made in the White Paper’s Executive summary:
When it comes to climate, first from the daily minimum and maximum temperatures we find the average station temperature for the day. Then we average up all those daily means to find the annual station average. Then we take all the annual station averages from the equator to the poles and compute the annual global temperature. Finally all the annual global temperatures over the last 150 years are plotted out to see if there’s a trend or not, and if there is, it is declared an artifact of human activity and CO2 and a problem. The solution to the “problem” requires that we destroy the global economy by banning fossil fuels.
I prefer this graph, shows that the changes basically match the temperature they are trying to create.
Remember, that is a graph of the CHANGES. !!
Did you know that was my graph when you posted it? (-:
Here’s the original:
https://postimg.cc/w3zy2xMC
Yep, sorry about that.. H/T Steve Case 🙂
Cheers
So, can we post images again? Testing1 2 3—
This is the time of year in the Northern Hemisphere when we can give thanks to global warming, whose main effect is to make nights warmer, a key non-scary fact that should confront “planet on fire” nonsense.
Here in the southern UK the climate may well become that of northern France … oh the horror.
Thanks, David. So the BEST 100 year temperature anomaly change is one (1) degree C, and the earths circumference is 40,000 km, or 10,000 km equator to pole, either way. If the average pole temperature is minus 30 C, and the average equator temperature is plus 30 C, then the change is 60 C in 10,000 km. So every hundred years a person desiring uniformity (plus or minus forcings and feedbacks and local effects?) would have to move 10,000 km divided by 60, or 167 km, about 100 miles. So if you want to pretend to stay in the same “climate” move one (1) mile north or south (depends on northern or southern hemisphere) every year. When you cross an International [Frontier declare yourself a “Climate Refugee”. Go for it.
Which of course explains why so many people move from colder places to warmer places. 😉
What was the fastest growing place in the US….. Somewhere in Arizona iirc.. 😉
Francetvinfo.fr: President Emmanuel Macron has said that “nuclear power will remain a key part of France’s energy supplies”. Speaking on Tuesday, Macron showed support for the industry even as he looks to reduce nuclear’s dominance as a power source. France has said it will cut its reliance on nuclear energy to 50% from 75% by 2035 and has yet to make a final decision on whether to build next-generation EPR nuclear reactors.
What an absolute muppet that excuse for a man is.
Let’s get rid of 50% of something that’s “key”, wouldn’t want anything that’s “key” getting in the way of something unreliable and not at all “key”.
Macron =’ muppet’. Hmm. In England we have the amazing disappearing man, Johnson, who mumbles, looks worried when challenged and changes his opinions with his underpants.
I’ve recently come to live in France where Macron proved his loyalty to France and freedom when he and his wife condemned the (would-be) statue destroyers. He is the only Western leader I know to unequivocally defend Charlie Hebdo’s ‘freedom to blaspheme’ when republishing the Mohammed cartoons. And now he commits himself to nuclear power in a world run by fantasists who equate this view with racism.
Some muppet!
BoJo mumbling ? No way, just incoherently lost for words. Got to be image of the day Brexit, Climate change, Covid tests, Russian oligarch friends, girlfriends past or present, family relations, you pick your choice, his nose always ends in it.
Well if all it takes is a few empty words to get your vote then he’s your man. He could fill your xmas stockings full of broken promises.
All power comes from Brussels, Macron is a lapdog.
What is amazing is that those who put the buffoon Johnson in power knew of his many faults but thought that being Prime Minister would somehow change him. When this obviously failed they considered themselves ‘naive’. I can think of many more apt words than that to describe them. Still, as one of the oaf’s traits is to never stick around to clear up the mess he creates, he should have gone by summer.
Finally, we show the large natural temperature changes that Americans in 14 major cities..
…. which is a tiny amount compared to the yearly range in parts of Siberia.
Actually, not that tiny amount compare to Siberia…
But several places around Siberia do have yearly ranges of around 100ºC (iirc 105ºC is highest range)
People live there.. somehow. !
Indeed two extremes are +36C and -71C.
They do the same for the Arctic which also shows a lot of natural variability, when the Grifters of the world scream that there’s no ice in the Bering Straits as if this is all the proof you need to convert to the church of climatology. One year is not climate.
Here’s a quick look at what I mean.
As of the 1st Dec Hudson Bay 2020 had more ice than 2012 or 2006.
The Bering Straits/Chukchi Sea of 2012, (a dramatic year for alarmists) was full of ice compared to 2006/2020.
https://ibb.co/4ZmRPdG
Yep different regions grow at different rates on a yearly basis, depending on ocean flows and weather pattern
This year there was a “not as cold” blob sitting over the top of Siberia and the Bering Straits, so growth was a bit slow. But the flip side was that the Canadian Arctic, Beaufort, Greenland Sea all grew very quickly.
So much so, that one fortnightly period this year (27 Oct – 9 Nov) had the greatest fortnightly growth since at least 1988. (NSIDC DATA)
That “less cold” blob has now broken up and is partly sitting over north east Canada. (according to Climate Reanalyzer)
I suspect we will see the Bering Straits freeze up quite quickly over the next week or so.
Don’t you mean Griffters? 😁
Do we even know how and to what extent a hotter summer or colder winter, a drier year or a wetter year and other significant regional fluctuations impact on or are related to the neighboring areas? While we know something of the El Nino and La Nina patterns is it not true that because of the complexity of a world with a number of climate zones that our knowledge and understanding is completely overshadowed by what we do not know and understand? Are many of the exaggerated claims not simply because of intellectual arrogance?
Speaking of USA temperatures..
Did you know that Eastern USA has been cooling since 1930.
Sure did, here’s different way of looking at it:
Lyodo, I think this graph says it all, nothing to see here move along. And in answer to your previous question on another post, I sold the boat 7 years ago. I am glad however that you have dived on the reef on 2 occasions. I think J. Morohassy and Peter Ridd put the reef demise in context and along with this post is a most illuminating wake up call for all those who believe the doomsayers.
Admittedly, it seems very small, but in France, we have an alarmist – Mr Jancovici – who uses a much more impressive reverse analogy: “See what Europe looked like with -5C global temperature: The North Sea is a pack ice and the ocean is at 120 meters … “.
So, the +5 promised are the result of RCP8.5, but the difference on such a small measure observed in the past is impressive, especially since we would have already done the third …
These sort of arguments, while true, aren’t really very helpful. When attacking the Warmunist’s arguments, we need to be bringing our A game, not our B, C, D, or F game. I rate this one about C-level. We can, and must, do better.
If they had published this 4 years ago it may have been useful in persuading President Trump to withdraw the EPA Greenhouse Gas Finding of Endangerment. Publishing it now, when we are heading into a climate hysteric take over been Biden/Harris, is a waste of time. Facts have nothing to do with the effort to control the economy and everyone’s life with climate change regulations. To this article I can only say, too late now.
Just a reminder: Neither the HadCRUT4 or the Best charts show the Early Twentieth Century to be just as warm as today.
This makes both charts bogus, bastardized, modern-era Hockey Stick charts, unfit for analyzing the Earth’s climate and temperatures.
Regional surface temperature charts from around the world show the warm Early Twentieth Century. The bogus Hockey Sticks do not.
Bogus, bastardized, modern-era Hockey Stick charts artificially cool the Early Twentieth Century and make things appear like the Earth is currently experiencing the warmest temperatures in human history.
But nothing could be further from the truth. The written surface temperature record puts the lie to the bogus Hockey Stick charts and to the bogus Human-caused Climate Change narrative.
Here’s a link to the real surface temperature profile shown on the left (Hansen 1999) and the bogus, Hockey Stick chart shown on the right.
The real surface temperature profile (Hansen 1999) shows we have nothing to fear from CO2, because it is not any warmer now than in the Early Twentieth Century, yet CO2 has increased steadily over that time period. Therefore, CO2 has very little effect on the Earth’s temperature. So little it can’t be measured.
http://www.giss.nasa.gov/research/briefs/hansen_07/
All the unmodified, regional surface temperature charts show the same temperature profile as the Hansen US 1999 chart, with the Early Twentieth Century showing to be just as warm as today.
No unmodified, regional surface temperature chart resembles the bogus, Hockey Stick “hotter and hotter and hotter” temperature profile.
We have a written temperature record that refutes the bogus, bastardized Hockey Stick charts.
“unfit for analyzing the Earth’s climate and temperatures.”
Ain’t that the truth.. yet even in that corrupted fabrication, they show the Arctic warmer in 1940 than now.
Here’s another Hansen graph from before the scam/ con started
Backed up by Phil Jones
Hmm, no mention in the article about Intensive Properties, and why averaging them gives you a meaningless result. Disappointing.
Jeff
I’m still having difficulty wrapping my head around the complaint about “intensive properties” because the particular property in question determines how comfortable humans feel, controls the wilting of plants, influences the rate of evaporation, and the average can be used to predict how much the oceans will increase in volume and how much heating oil will be used by those living in New England. That is, the average of this particular intensive property seems to have considerable utility.
It means that taking a temperature reading in a spot in Hawaii, and another at the South Pole, and averaging them, gives you a physically meaningless result.
That doesn’t mean it won’t be useful to someone. The question is, is it fit for purpose?
Jeff
So, “Fit for purpose” depends on a declaration of what the purpose is, which I rarely see anyone do. An average at least provides an order of magnitude estimate so that we know that we are talking about something other than outer space or the caldera of an active volcano. Averages tell us if changes are taking place. However, I agree that a lot of information is lost in the process of averaging.
I have gone on record several times that I think the best thing is to present both high and low daily temps, essentially an envelope defining the bounds of the daily changes, rather than presenting the mid-range value. The mid-range value can represent an infinite number of hi-lo pairs and doesn’t tell us whether one of both temperatures are changing if the mid-range value is changing.
There was a time — before computers — that using mid-range values might have been rationalized because it reduced the computational and graphing effort. However, with computers, there is almost no extra time involved in doing the calculation on both the high and low temperatures and plotting both. Further, using high and low temperatures in models would further refine the veracity because one then has two metrics to compare against reality.
I actually believe the Earth is on average, warming. I concede that a rise in CO2 might be a factor in the overall warming.
I do not believe that CO2 is the temperature control knob and that it accounts for nearly 100% of the overall warming – it *might* account for as much as 50% but that seems to be a stretch. I do not believe CO2 remains in the atmosphere for a long period of time (the so-called CO2 half-life). It is more likely less than 20 years and not the more than 100 that many climate scientists seem to suggest – and it should be dropping as the world is turning more “green”.
I do not believe the highly manipulated data used to compute the temperature anomalies is good data. I believe it contains far more heat pollution from local changes around the measuring stations then many people realize. It is easy to see this by using only well positioned, well managed rural stations and looking at the temperature difference between those and urban stations. I believe the observed temperature increases are exaggerated by this and biased data manipulation by a factor of about 2.
Then there is the REAL question – is warming good or bad? Apparently climate scientists cannot imagine a warmer world being good, it is just beyond their ability to cope. They see people along the coastlines unable to move, adapt, or cope just standing there and drowning as massive heat induced tidal waves wash the helpless fools away.
The world will mostly warm where it is cold, and most of the warming will be at night when temperatures drop. One or even two degrees of warming do not melt the great ice packs, but could actually grow them with increased snowfall.
Regardless, people have a long time to slowly build up the coastlines where it is necessary. A smarter approach would be stop building along right next to the coastline or in low lying areas but again, that seems too radical for people to be able to do to climate scientists.
The growing seasons for food get longer, and plants grow more quickly. Forests will grow more quickly.
There could be more rain – I sure hope so. There is no evidence that there will be more tornadoes or hurricanes, in fact the record suggests there will be fewer or less intense hurricanes. As mankind advances there will be more fresh water available from brine waters and the ocean through desalination processes.
The greatest threat to mankind is believing what the climate activists are telling us. It is this misguided belief that is wasting billions on intermittent power production, making the electrical grids – in otherwise advanced countries – fragile. The idea that we can build enough batteries to turn all intermittent power into baseline power is nothing but a fairy tale.
I’ve noticed one thing.
When one of the skeptics makes a ridiculous, unsupportable claim, there are usually several others who are willing to step up and show what the claim is ridiculous.
On the other hand, when someone likes Loydo makes the claim that 100% of the warming the world has enjoyed over the last 150 years is caused by man, none of the other alarmists ever contradict them.
Are they not actually interested in science, or are they more interested in presenting a solid front against the skeptics? If they are willing to let politics be more important than science, then they are proving that they don’t believe that science should be all that matters.
What Lyodo and other CAGW advocates forget is that a so-called Global Average Temperature (GAT) is not a description of climate and is therefore a useless concoction of very, very questionable calculations and measurements.
Climate is best described by the term biome. The earth has various and sundry different biomes defined by not only temperature but also rainfall, humidity, flora, soil composition, land or water, etc. A single GAT simply can not fully describe all these unique areas and determine what is happening in the different biomes. Many of them have already seen benefit from increased CO2 and yes, even increasing temperature.
A government single solution program to a problem is usually only based on the assumption that it will help someone. Generally, not most or even a majority, just some. Alarmists are the same. The same solution everywhere even if it doesn’t even help the majority. Complex problems like climate require complex solutions. Simple solutions like reducing CO2 generally have many unforeseen results. You’ll never see an analysis of these by CAGW adherents. Not even Lyodo is willing to admit that reducing CO2 will result in famine in some locations that result in many deaths.
Spot on Jim.
Interestingly, Berkley has this to say about one of the 6 types of biome – Marine –
“The world’s oceans have an even greater effect on global climate than forests do. Water has a high capacity for heat, and because the Earth is mostly covered with water, the temperature of the atmosphere is kept fairly constant and able to support life.”
https://ucmp.berkeley.edu/ucmp_oldsite_nonwpfiles/exhibits/biomes/
Read that last part again – ” . . . because the Earth is mostly covered with water, the temperature of the atmosphere is kept fairly constant . . .”
Berkley must be cancelled for writing such heresy, Shirley?
Jim
I strongly suspect that all of the Koppen climate regions are experiencing different rates of warming, which may even be different in the north and south hemispheres for the same classification. However, the only confirmation I have read is for the Arctic being different from the global average.
“Not even Lyodo is willing to admit that reducing CO2 will result in famine in some locations that result in many deaths.”
Even though he/she KNOWS that it would !! He/she JUST DOESN’T CARE.
He/she also knows that unreliable or overly expensive electricity supplies will also cause many deaths..
But JUST DOESN’T CARE.
All that matters is the AGW cult idiotology he worships.
“Almost Earth-like, We’re Certain” has cute images of thermometers showing how close Earth is to being “earth-like”.
Good post Dave.
From the Lindzen and Christy paper:
“In a logical world, it would be understood that the probability of the whole chain will be the product of the probability of each link, and so generally very small. And, of course, if any link is broken (i.e., probability zero), the whole chain is broken.
However, there is also the fact that in the world of environmental alarm, the above logic is turned upside down, and the existence of any link is held to imply the likelihood of the whole chain of inference —including the promotion of catastrophism”.
That is a nice summary of the current madness, it is as much a product of faulty reasoning as corrupt science, propaganda, politics, profit etc.
There is an inherent impermanence to the mean temperature anomaly. It changes. It changes every time you calculate it with new data. This means that it is not a record. Moreover, it changes in non-sensical and non-physical ways, and does so by definition. This year’s data changes last year’s anomaly. It changes all year’s anomalies. And not in the simple way one would expect.
Imagine that we measured our height every day and kept an average height for each year. Your average height for your 10th year will never change. Your average height throughout your life will change. The difference between the two will change over time. This is the simple way of looking.
The simple difference preserves relative differences. The difference between your height at 15, and your height at 10 will never change after you turn 16, and it will always be preserved in the simple difference even as the average lifetime height changes.
This is not true for this mean temperature anomaly. The relative anomalies between different years keep changing. This makes it a measurement of something that is not real.
Differences can be very useful tools. Finding small effects that are swamped by bigger effects can be very powerful. But seeing small effects that are caused by how you calculate your differences, and that change with each new calculation is worthless.
This field needs to make sensible redefinitions so that measurements and averages are properly recorded and never change. Of course if someone finds errors in how the temperatures were recorded or averaged in 1937, then change can be argued for. But, the temperature in 1937 should not change with a measurement in 2000. Nor should the relative temperature between 1937 and 1986. Once they are in the books, those things shouldn’t change. Not in 2000, 2010, or whenever. The temperatures should never change. Nor should the average temperature for a year. The difference between the average temperature and the changing total average will change, but it should change in a way that preserves the past record.
Only after they set their measurements to reality can one start to argue if the anomalies are real and important or real and unimportant or unreal.
I will ask a simple question. How much CO2 is produced by human respiration. The concentration of CO2 of intake air is ~0.038 vol% and exhaled air is 5-4.5 vol% (40000 to 45000 ppm). Apply this across average 38000 breaths per day and 7.8 billion persons. This is human produced CO2…. and then add in the rest of the animal world. Are we missing something here?
All that CO2 was already in the fast (active) carbon cycle.
While the annual contribution from fossil fuel combustion is tiny compared to natural sources, we are converting carbon from the slow (geological) carbon cycle into CO2 in the fast carbon cycle faster than it’s being returned to the slow cycle.
David
Is the cycle rate a distinction with a significant difference when the fossil fuel contribution is so “tiny?”
Compared to annual natural fluxes the human contribution might be “tiny”, but accumulating over decades the human contribution is now a third of the total and rapidly rising. There is nothing “tiny” about that, in fact I would have thought “large” is a more accurate.
You have NO EVIDENCE that they accumulate.
If they accumulate then they are overpowered by the 97% of natural emissions that would also accumulate….
…. or do you think that human released CO2 is treated differently (that would be TRULY DUMB)
The Earth is getting greener. And because of natural warming is also becoming more livable for a huge proportion of the planets creatures..
REJOICE for the extra CO2 and slight warming out of the COLDEST period in 10,000 years.
As you should be AWARE by now, that highly beneficial rise in atmospheric CO2 is a TOTAL POSITIVE for all life on Earth.
No downside anywhere or any how.
WHY do you HATE life on this planet so much ??
Or is it really just YOU that you hate so much. ??
I estimate the net CO2 from direct human respiration (exhale / inhale) is around 0.9 kg/person/day. The population has grown from around 2 billion in 1930 to currently 7.8 billion persons in 2020 and is projected to continue increasing to over 10 billion persons in the future. If correct, this corresponds today to a total CO2 of around 2.6 billion metric tons per year today increasing to 3.3 billion metric tons/yr in the future. The current fossil fuel CO2 emissions is around of 15 billion metric tons per year. This means CO2 from human respiration is around 17% of the current fossil fuel CO2 generation, and this will continue growing with future population growth. The argument is “but, this is from ‘slow cycle.’” If one accepts that “atmospheric CO2 concentration” is the key driver of global warming it seems one cannot ignore the CO2 in the atmosphere from human respiration just because it is from “slow cycle.” A CO2 molecule in the atmosphere doesn’t know if it comes from “slow cycle” or “fast cycle.” The focus on fossil fuels and clean energy seems to me at least to be an incomplete, inaccurate framing of the issue.
I think we should all be HIGHLY THANKFUL for the RE-INVIGORATION of the Carbon Cycle
It is a MASSIVE BENEFIT to all life on Earth.
And there is NO EVIDENCE of any detrimental effects WHATSOEVER.
If humans have even slightly contributed to the recover to more plant sustainable levels of atmospheric CO2, that is GREAT.
With China and other third world countries building more and more FOSSIL FUEL power energy systems, CO2 emissions will only continue to increase, leading to even further biosphere enhancement.
The atmosphere doesn’t have to know where it came from for the entire pool to be increasing.
Currently the banks and other financial institutions are at war with the energy companies to change their ways to get out of fossil fuels completely to focus on renewables. In essence they are mounting an attack on the fossil fuel producers by undermining their ability to finance current and future capital spending and operation if they don’t change their “harmful ways.” We know that some companies such as BP and Shell are already heavily invested in renewables “to do the ‘right thing’ for the planet.” Recognizing there are other greenhouse gases notably CH4, that contribute to the greenhouse effect, I ask how ignoring human respiration in the CO2 equation provides a complete characterization of the real war on CO2, esp. since it represents a significant and growing proportion of the CO2 entering earth’s atmosphere.
Because it’s not adding to the pool of CO2 in the fast carbon cycle.
Whereas, fossil fuel combustion is moving it from the slow carbon cycle into the active carbon cycle.
Regarding the war on fossil fuels… Since demand isn’t going away anytime soon, restricting access to capital will just lead to higher oil & natural gas prices… Which will drive some financial institutions back into fossil fuels.
“5he changes at the stations are distributed around the one-degree global average increase. Even if a single station had recorded this increase itself, this would take a typical annual range of temperature there, for example, from -10 to 40 degrees in 1900, and replace it with a range today from -9 to 41. People, crops, and weather at that station would find it hard to tell this difference.”
It seems that a linear trend has been taken here, but the fact that an average temperature has increased does not mean that the maximum temperature has increased, by definition, does it?
I am a layman, so I wonder what my reasoning error is , if there is any.