Column-averaged dry-air mole fractions of carbon dioxide, methane and carbon monoxide retrieved from satellite data
NATIONAL INSTITUTE FOR ENVIRONMENTAL STUDIES

Greenhouse gasses Observing SATellite-2 “IBUKI-2” (GOSAT-2) is a joint project promoted by the Ministry of the Environment of Japan (MOE), the Japan Aerospace Exploration Agency (JAXA) and the National Institute for Environmental Studies (NIES) (hereinafter, collectively, the “Three Parties”) as the successor to Greenhouse gasses Observing SATellite “IBUKI” (GOSAT), which was launched in 2009 and is still in operation.
GOSAT-2 was launched on October 29, 2018 from the JAXA Tanegashima Space Center with the H-IIA Launch Vehicle No. 40 (H-IIA F40). Later, GOSAT-2 collected the first light data with the onboard instruments: first on November 5-6, 2018, images with the Thermal And Near infrared Sensor for carbon Observation – Cloud and Aerosol Imager-2 (CAI-2), and on December 12-14, 2018, data with the Thermal And Near infrared Sensor for carbon Observation – Fourier Transform Spectrometer-2 (FTS-2), confirming that the onboard instruments were operating normally. Further, on February 1, 2019, GOSAT-2 shifted its operation mode to nominal and started global observations by CAI-2 and FTS-2. Note that the spectral radiance data observed by CAI-2 and FTS-2 have been distributed to the public as GOSAT-2 Level 1B Product from the following website since August 5, 2019:
GOSAT-2 Product Archive, National Institute for Environmental Studies
Subsequently, on July 5, 2019, NIES released the first retrieval results of methane (CH4) and carbon monoxide (CO) by a proxy-method (see http://www.nies.go.jp/whatsnew/20190705/20190705-e.html).
This press release provides an overview of the retrieval results of carbon dioxide (CO2), CH4 and CO by a full physics method. As for CO2 retrieval results, this is the first report from the GOSAT-2 observation. The full physics method is designed to calculate light propagation in the atmosphere based on a physical model, and used for GOSAT-2 to simultaneously retrieve column-averaged dry-air mole fractions of CO2, CH4 and CO. Among the greenhouse-gas-monitoring satellites currently in operation, GOSAT-2 is the only satellite capable of simultaneously estimating column-averaged concentrations of these three gas species.
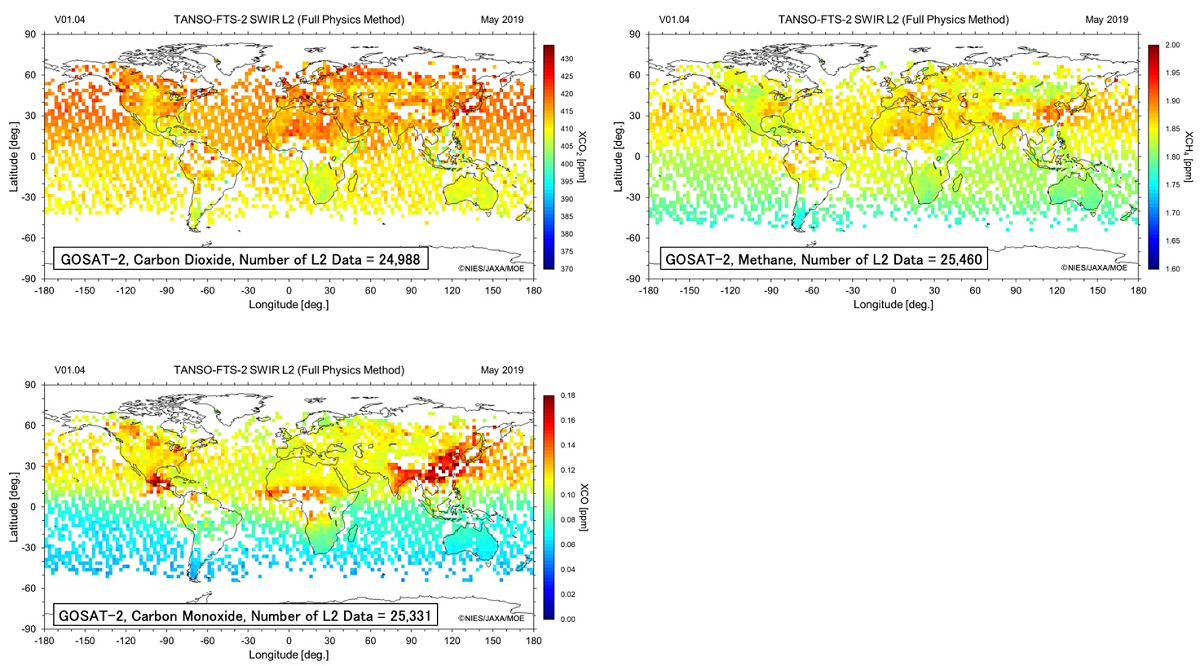
Figure 1 shows the global distributions of column-averaged dry-air mole fractions of CO2, CH4 and CO (denoted by XCO2, XCH4 and XCO, respectively) retrieved from GOSAT-2 FTS-2 data in May 2019 using the full physics method.
As seen from the whole-atmosphere monthly mean CO2 concentration based on GOSAT observation in May 2019 that hits the record high of 409.4 ppm at that time (see http://www.gosat.nies.go.jp/en/recent-global-co2.html), the photosynthesis of mid- and high-latitude forests in the Northern Hemisphere is not fully activated as of May 2019 and the CO2 concentrations in Russia and Canada remain high. In terms of CH4 concentration, it appears to be high in southeastern China, northern India, northern Europe/Africa and eastern North America while the concentration of CO, a gas species newly added for GOSAT-2 observation, seems high in the region from India through northern Southeast Asia to China, Central Africa, and Mexico and its leeward side. The high CO concentrations observed are considered to be attributable to the use of fossil fuels and biofuels (incl. charcoal) in the region from India to China, and to forest fires in Central Africa and Mexico.
Figure 2 shows the global distributions of column-averaged dry-air mole fractions of CO2 and CH4 retrieved from GOSAT FTS data in May 2019 using the full physics method. As seen from the figures, the areas, where GOSAT-2 data are available, have increased significantly compared to the areas with GOSAT data, including oceans and tropical regions with frequent cloud cover. The number of observed data from which CO2 and other gas species are successfully retrieved is 11,000 for GOSAT and 25,000 for GOSAT-2, which is 2.3 times the number of GOSAT. This increase owes mainly to the two technical improvements: the intelligent pointing mechanism–a new function introduced to FTS-2 that discriminates cloudy areas in real time using the camera installed inside the FTS-2 and automatically changes the observation point to a cloud-free area; and the extended range of possible pointing angle in the flight (along-track) direction in relation to sun glint observations over the ocean.
The retrieval results of CO2 and other gases based on GOSAT-2 FTS-2 data using the full physics method have been validated with the ground-based observation data of the Total Carbon Column Observing Network (TCCON). By comparing FTS-2 data (land area) from March to May 2019 with ground-based data collected at 23 TCCON sites (Figure 3), a difference between these two data was found to be 4.1 ± 3.8 ppm (1.0 ± 0.9%) for CO2, 5.5 ± 17.4 ppb (0.3 ± 0.9%) for CH4, and 21.2 ± 9.0 ppb (22.7 ± 9.7%) for CO. (All these data from GOSAT-2 are higher than the TCCON data.) Although these values are better than GOSAT data two years after its launch, they have not reached the quality level of the latest data products from GOSAT FTS (V2.90, -0.35 ± 2.19 ppm (-0.1 ± 0.6%) for CO2, 2.2 ± 13.4 ppb (0.1 ± 0.7%) for CH4). Further improvement in the data products from GOSAT-2 is needed.
This result by the full physics method reported in this press release has been provided together with the result by the proxy method as GOSAT-2 Level 2 Product, to researchers whose research proposals have been adopted on the GOSAT Series Research Announcements (1st and 2nd RAs) and research organizations that have signed collaboration agreements with MOE, JAXA, and/or NIES. Once the related documents including validation results are ready, all these data products will be newly released to the general public from GOSAT-2 Product Archive.
We will work on further improvement in retrieval accuracy and increase in the number of retrieved data. Furthermore, we plan to proceed with inversion analysis of net fluxes, generation of Level 4 products, and estimation of anthropogenic emissions, and succeed to GOSAT’s results in a progressive manner.
###
Would be nice to see the major greenhouse gas ( H20 ) plotted as well….
WV is already available in weather sattelites e.g.:
https://eumetview.eumetsat.int/static-images/MSG/IMAGERY/WV062/BW/SOUTHERNAFRICA/
Not comparable.
After some digging, here is the link to the full size version of the head image, from source:
Thanks, that’s actually readable. What is going on with CO in Central America?
Carbon monoxide is usually related to incomplete burning and soot formation, so crop and seasonal forest fires.
and charcoal production
Sins of omission, must not be mentioned within certain discussions. #bidencheated
Haha – I’m gonna have some cake and eat it.
For aaaages I’ve ranted & raved about emissivity (no change imminent) and I’ve said that things with high absorption of (infra-red) radiation *must* be good emitters
So it is with water (vapour)
Previously I’ve stated that CO2 must be a good emitter ( i.e. It will have a cooling effect) because it is cracked up to be such a good absorber i.e. Greenhouse Gas
But, this *is* beautiful:
Quote: from Jennifer
Introducing 7700 meters as the average altitude of the troposphere and the real partial pressure of the atmospheric carbon dioxide (0.00038 atm-m), the resulting total emissivity of the carbon dioxide is 0.0017 (0.002, rounding up the number).
CO2 has one tenth the emissivity of oxygen/nitrogen
If CO2 has such vanishingly low emissivity, it must have vanishingly low absorption.
i.e. if it traps any heat, the amount is utterly trivial compared to the amount oxygen/nitrogen trap.
On an absorption/emissivity scale, CO2 is effectively 40ppm – not 400ppm
Now we understand why these Sputniks measure the amount of energy that CO2 steals from incoming sunlight – at wavelengths corresponding to 400 & 800 Celsius. Anything coming from CO2 is simply invisible.
By comparison, if we can still ‘hear’ the Voyagers, radiating 60Watts total from a billion miles away, why can’t we hear CO2 radiating from just above our heads?
Why didn’t the warmist scientists tell us about this?
There is a thing called “Lying by Omission”
Or should that be ‘Emission’
hahahahaha
Co2 net absorption has been observed since 1971 with the nimbus satellite
https://ntrs.nasa.gov/citations/19710026041
Yes, if one uses Prof Hoyt Hottel’s equation in the Chemical Engineering Handbook Page 5-34 equation 5-145 you will get answer similar to yours for the absorptivity of CO2 in the atmosphere ie the absorption is so small to be unmeasurable even if the concentration is 10 times the present level. The real problem is that there is very few beside qualified professional chemical engineers who understand Heat Transfer.
“ In 1954, Hoyt C. Hottel conducted an experiment to determine the total emissivity/absorptivity of carbon dioxide and water vapor11. From his experiments, he found that the carbon dioxide has a total emissivity of almost zero below a temperature of 33 °C (306 K) in combination with a partial pressure of the carbon dioxide of 0.6096 atm cm. 17 year later, B. Leckner repeated Hottel’s experiment and corrected the graphs12 plotted by Hottel. However, the results of Hottel were verified and Leckner found the same extremely insignificant emissivity of the carbon dioxide below 33 °C (306 K) of temperature and 0.6096 atm cm of partial pressure. Hottel’s and Leckner’s graphs show a total emissivity of the carbon dioxide of zero under those conditions.”
cement I found this about Hottel’s experiments. CO2 can’t do what they say.
“at wavelengths corresponding to 400 & 800 Celsius.” There is no such correspondence. A line spectrum is not a blackbody spectrum.
I’m not seeing a lot of northern hemisphere to southern hemisphere mixing in this data. It makes me wonder how freon (and other hydroflurocarbon compounds) got from the northern hemisphere to attack the ozone over antarctica? I’m living in the southern hemisphere and it looks like we’re not guilty of anything! About to jump in my SUV and drive t the golf course, totally guilt-free! Have a great day.
If you watch the movie, you’ll see the mixing. It takes time, but it happens.
The CO2 orange/red color doesn’t look well mixed to me… not even in the movie. In fact Mauna Loa observatory stays that color most of the time. Volcano influence?
I first read ‘retrieval’ as ‘trivial’, I must be biased. first retrieval results of methane
What happened to OCO-2?
The Sahara desert seems to be a significant source of CO2. I didn’t know that the desert natives drive so many SUV’s.
It’s all those camels!
…. butt…. that would be CH4
The equatorial africain carbon monoxide “hot spot” looks very suspicious. It seems to peak on the atlantic coast near Guinea. WUWT?
Also massive hot spot of CO over Mexico while that country remains very average in CO2.
Is 2ppm of methane an issue. Even if multiplied by a “CO2 equivalent ” factor of 20 that’s still only 80.
Much as one might have expected. Now let’s ask the big question. “So What?”
This shows the obvious and that China is a massive emitter.
Nothing confirms the warmunista scam to me more than the fact that for the purposes of the IPCC China is a 3rd world country and can keep increasing CO2 “until 2030”, as if they are going to stop them, by which time they may be 50% of the total.
China, with the space program, massively growing military, intruding all over the world, but the poor dears are 3rd world.
It’s all a bad joke on us all
“10 years to get off hydrocarbons or the world dies.”
Except china
Pat from kerbob,
The CH4 levels are highest in eastern China. Northern India shows the next highest concentration of CH4. Aside from a spot source in Alberta, NA seems to be relatively low in CH4 compare to the rest of the world.
Although parts of China which are 3rd world, the parts of Eastern China where I have traveled are definitely not 3rd world. China’s high speed rail network is on par with Japan’s network. This is from my personal experience, having ridden on the Shinkansen, KTX (Korea), HST (Taiwan), ICE (Germany), TGV (France) and China’s network. Chinese traffic jams are horrendous. Shanghai’s subway system is among the world’s best and I understand Beijing’s system is at least as good.
In my opinion, the people who can accept that China is 3rd world have little to no first hand experience in the country.
+1
Having sold technology in China (Anhui provence) back in the 90`s I have to absolutely agree with that,
I have walked from the room with the compacted earth floor with a 1950s pedastal grinder through a door to the 1980`s American 2 axis wire eroder in a peeling paint and bare lightbulb room and thru the next door to the Chinese multi axis wire eroder in a clean room envirnment. better than I had back in Blighty.
On my final way home I was buying bits of kit to sell to the eager hands of technicians back home.
and some wonderful steam trains with big gaps in the tracks and holes in the floor for toilets !
As this comes to us via EurekAlert!, there must be something I’m missing. Where are the hysterical claims of imminent doom?