Reposted from Dr. Roy Spencer’s Blog,
November 2nd, 2020 by Roy W. Spencer, Ph. D.

The Version 6.0 global average lower tropospheric temperature (LT) anomaly for October, 2020 was +0.54 deg. C, down slightly from the September, 2020 value of +0.57 deg. C.
The linear warming trend since January, 1979 remains at +0.14 C/decade (+0.12 C/decade over the global-averaged oceans, and +0.18 C/decade over global-averaged land).
For comparison, the CDAS global surface temperature anomaly for the last 30 days at Weatherbell.com was +0.33 deg. C.
With La Nina in the Pacific now officially started, it will take several months for that surface cooling to be fully realized in the tropospheric temperatures. Typically, La Nina minimum temperatures (and El Nino maximum temperatures) show up around February, March, or April.
Various regional LT departures from the 30-year (1981-2010) average for the last 22 months are:
YEAR MO GLOBE NHEM. SHEM. TROPIC USA48 ARCTIC AUST
 2019 01 +0.38 +0.35 +0.41 +0.36 +0.53 -0.14 +1.14
 2019 02 +0.37 +0.47 +0.28 +0.43 -0.02 +1.05 +0.05
 2019 03 +0.34 +0.44 +0.25 +0.41 -0.55 +0.97 +0.58
 2019 04 +0.44 +0.38 +0.51 +0.54 +0.49 +0.93 +0.91
 2019 05 +0.32 +0.29 +0.35 +0.39 -0.61 +0.99 +0.38
 2019 06 +0.47 +0.42 +0.52 +0.64 -0.64 +0.91 +0.35
 2019 07 +0.38 +0.33 +0.44 +0.45 +0.10 +0.34 +0.87
 2019 08 +0.39 +0.38 +0.39 +0.42 +0.17 +0.44 +0.23
 2019 09 +0.61 +0.64 +0.59 +0.60 +1.14 +0.75 +0.57
 2019 10 +0.46 +0.64 +0.27 +0.30 -0.03 +1.00 +0.49
 2019 11 +0.55 +0.56 +0.54 +0.55 +0.21 +0.56 +0.37
 2019 12 +0.56 +0.61 +0.50 +0.58 +0.92 +0.66 +0.94
 2020 01 +0.56 +0.60 +0.53 +0.61 +0.73 +0.13 +0.65
 2020 02 +0.76 +0.96 +0.55 +0.76 +0.38 +0.02 +0.30
 2020 03 +0.48 +0.61 +0.34 +0.63 +1.09 -0.72 +0.16
 2020 04 +0.38 +0.43 +0.33 +0.45 -0.59 +1.03 +0.97
 2020 05 +0.54 +0.60 +0.49 +0.66 +0.17 +1.16 -0.15
 2020 06 +0.43 +0.45 +0.41 +0.46 +0.38 +0.80 +1.20
 2020 07 +0.44 +0.45 +0.42 +0.46 +0.56 +0.40 +0.66
 2020 08 +0.43 +0.47 +0.38 +0.59 +0.41 +0.47 +0.49
 2020 09 +0.57 +0.58 +0.56 +0.46 +0.97 +0.48 +0.92
 2020 10 +0.54 +0.71 +0.37 +0.37 +1.10 +1.23 +0.24
The full UAH Global Temperature Report, along with the LT global gridpoint anomaly image for October, 2020 should be available within the next few days here.
The global and regional monthly anomalies for the various atmospheric layers we monitor should be available in the next few days at the following locations:
Lower Troposphere: http://vortex.nsstc.uah.edu/data/msu/v6.0/tlt/uahncdc_lt_6.0.txt
Mid-Troposphere: http://vortex.nsstc.uah.edu/data/msu/v6.0/tmt/uahncdc_mt_6.0.txt
Tropopause: http://vortex.nsstc.uah.edu/data/msu/v6.0/ttp/uahncdc_tp_6.0.txt
Lower Stratosphere: http://vortex.nsstc.uah.edu/data/msu/v6.0/tls/uahncdc_ls_6.0.txt
This high anomaly continues setting up 2020 as Year #2 rather than #3, 4 or 5 on the all time (since 1979) balmiest list.
The CACA Chorus will make much of this, but 2021 and 2022 are unlikely to make the top hit list.
In any case, the downtrend from February 2016 remains intact, despite a strong 2019-20 El Niño following Super El Niño of 2015-16, after the long “Pause” following 1997-98 Super El Niño.
The main blast boosting 2020 was the Feb high anomaly of +76 at El Niño peak, comparable to Feb 2016 Super El Niño zenith, plus some subsequent months in the +50s.
Next year will tell a different story, with a lot of heat radiated to space this year, and long awaited La Niña.
That warm anomaly is still hanging about the Arctic, even though it is now below freezing.
So.. slightly less freezing.
But radiating heat to space in larger measure….
Are you calling the Running, centered 13 month average trend from 2016 a downward trend?
How about we use say 10,000 years..
So much COOLER now. !
No. The 13-month trend line for February 2016 covers the previous year. The trend since February 2016 is down. The trend from February 2012 to 2016 was up. The following four years have been down, and the trend is likely to continue down at least into 2021.
But yes, even the moving average trend line is slightly down.
But yes, even the moving average trend line is slightly down.
But if you include the last couple of months it isn’t. Give up your “cooling” and your “steps” John, they’re angels on the head of a pin.
Here is how much cooling we’re in for.
 ?mw=957&hash=7A722C58E51BF67BBFA1453329B37B6044341DE0
“In any case, the downtrend from February 2016 remains intact, despite a strong 2019-20 El Niño following Super El Niño of 2015-16…”
What strong El Niño in 2019-20? I thought there was only a weak El Niño then. But like the use of the word “despite” when describing a downtrend since 2016, whilst also mentioning the super El Niño of that year.
By the way, that cooling trend since February 2016 is about 0.2°C / century. So over the course of that period temperatures have dropped by less than 0.01°C.
In contrast the last 7 years, since November 2013, have seen temperatures rising at the rate of 3.9°C / century. A fact of no interest to anyone, unless you happen to think 7 years is long enough to alter a long standing trend.
Or you think a huge El Nino / Big Blob had no effect
No sign of human influence at all.
Wouldn’t you agree.
Yes I would agree. That’s somewhat the point I’m making. It’s easy to take a 7 year period out of context – show it’s very different to the previous trend and claim this represents some sort of change, regardless of the cause. It would be wrong to claim that global warming had suddenly tippled in strength the last 7 years, just as it’s always been wrong to claim that a 7 year cooling trend means that global warming has stopped.
3.9°C / century
7 years, too short? I dunno, 3 seems to be popular.
let’s use say 5000 or 10,000 years
Much COOLER now.
Barely a dump above the coldest period in those 10,000 years.
El Niño of 2019-20 was strong. It’s February peak was close to those of the 1998 and 2016 supers. Overall, it was above average. Among recent Los Niños, it was weaker than the two supers and 2010, but stronger than the others. That of 2002-03 was close, but shaped normally, while 2019-20 was twin-peaked. NOOA actually declared it over in October 2019, but it came roaring back.
https://www.cpc.ncep.noaa.gov/products/analysis_monitoring/lanina/enso_evolution-status-fcsts-web.pdf
Maybe that gave you the impression it was weak.
NOAA.
“El Niño of 2019-20 was strong. It’s February peak was close to those of the 1998 and 2016 supers.”
What measure are you using? I can see nothing in the NOAA presentation to suggest it was a strong El Niño, or anywhere near 1998 and 2016 levels.
ONI shows it never being above 0.6 this year and 0.8 last year. By contrast 2016 peaked at 2.6. (see pages 21 and 22).
MEI only shows brief periods above 0.5 last year and nothing above 0.5 this year, and has been in La Niña conditions since June. By contrast it was above 1 for a whole year between 2015 and 2016, peaking at 2.2.
https://www.psl.noaa.gov/enso/mei/
As noted, recent El Niño peaked close to high of previous, Super El Niño. For the UAH graph, that’s all that matters.
As for its strength, duration matters. Two medium Los Niños right after each other release a lot of heat.
The point is that 2020 will be warm because of El Niño, which caused an anomaly in the 0.70s and others above 0.50.
Next year should be cooler, continuing the downtrend for at least a fifth year.
Your still not answering my question. What measure are you using to claim that the recent El Niño was close to the peak of the “super El Niño”? Just stating it was doesn’t make it true.
Joh Tillman
Please be honest, and tell us where you see any ENSO event having, in 2019/20, peaked close to the three great El Ninos: 1982/83, 1997/98 and 2015/16.
This namely is not true. Here are the ENSO indices for 2019/20:
2019 : 0.08 | 0.52 | 0.77 | 0.33 | 0.26 | 0.35 | 0.24 | 0.30 | 0.15 | 0.27 | 0.45 | 0.41
2020 : 0.29 | 0.30 | 0.15 | -0.11 | -0.24 | -0.73 | -1.00 | -0.99 | -1.19
They peaked at… 0.77, i.e. many times less than 1997/98, both in size and duration:
1997 : -0.66 | -0.72 | -0.29 | 0.17 | 0.68 | 2.25 | 2.11 | 2.20 | 2.17 | 2.01 | 2.06 | 2.03
1998 : 2.23 | 2.43 | 2.27 | 2.55 | 2.26 | 0.37 | -1.42 | -1.74 | -1.31 | -1.21 | -1.30 | -1.25
You give here one more time the impression to confound, like did some guest posters here at WUWT, ENSO data and the UAH record.
The best example of how much they differ is to compare 1982/83 in both series:
https://psl.noaa.gov/enso/mei/data/meiv2.data
https://www.nsstc.uah.edu/data/msu/v6.0/tlt/uahncdc_lt_6.0.txt
J.-P. D.
Can another tell the difference when their air-is set at 15C vs 15.5C
Or do people set it a few degrees higher ?
first line…….. air-con is set
Research I found, from air-conditioning engineers, say the average person can accurately detect a change of 0.8 °C. If all the warming of the past 41 years, were to occur all at once, the room/area where you sit as you read they, you might just barely be able to detect it. Nobody could detect it over a span of 40 years.
Nobody could detect it…
Your point?
So its MEANINGLESS…
Who does it make any difference to ?
And do you have any evidence of any human causation?
Its obvious ENSO related.. so your answer must be,
“NO, no evidence of human causation.”
(as you continue to show)
It’s meaningless
Like existence itself
“Loydo November 2, 2020 at 5:42 pm”
Look up the word hysteresis.
In loydo’s case.. that would be “hysterical”..
I remain skeptical about the ability to measure the average temperature of the entire globe down to .05 deg. C seems farfetched to me.
And no-one could tell the difference of 0.5 degrees anyway. !
Particularly not in the Arctic
What is the “feelings” difference between -30ºC and -29ºC ?
Why, no one can even tell the difference between -40C and -40F.
;0
come on, man,……. F is a much smaller unit 😉
So must be colder or is it warmer….. 😉
He’s funnin’ with you. Minus 40 C and minus 40 F are the same air temp. It’s the one place on the scale this happens.
Hint…… I know 😉
I understand the joke
But I worked up north, below -35c you can’t really feel the difference, it’s just cold.
At -54c my boot broke when I was kicking frozen pipe slips
Cold
I’ve had enough of that thanks
But we could tell the difference between -40C and -40K – for a (very) short period of time.
Since -40K, isn’t obtainable, we wouldn’t.
Riding my bicycle, I’ve come to realize that temperature can vary by degrees over even short distances.
Scissor
Its OK, they have developed software that can accurately calculate those areas before they had any means of recording the actual temperature, and make them seem real.
Its a belief system similar to…
—I belief in father Christmas
—I believe in the tooth fairy
—I believe in God
—I believe that the socialist system is best
Not believing in God is a belief system too. It can’t be proven either way.
On the other hand, if I’m right about the possibly related issue of life after death, I’ll discover it’s true. If I’m wrong I’ll never know it.
I hate finding out I was wrong, especially when it’s too late to do anything about it.
Pascal’s Wager.
John Bell
” … about the ability to measure the average temperature … ”
This is clearly a contradiction. No one on Earth ‘measures’ any average. Averages are computed out of several measurements.
It might appear ridiculous to compute temperature averages with 2 positions after the decimal point.
But often enough, such outputs are reused as inputs to other computations; having few precision is in that case an unnecessary drawback.
J.-P. D.
John Bell November 2, 2020 at 2:43 pm
I remain skeptical about the ability to measure the average temperature of the entire globe down to .05 deg. C seems farfetched to me.
When it comes to climate, first we find the average station temperature for the day. Then we average up all those daily means to find the annual station average. Then we take all the annual station averages from the equator to the poles winter spring summer and fall and compute the annual global temperature. Finally all the annual global temperatures over the last 150 years are plotted out to see if there’s a trend or not, and if there is, it is declared an artifact of human activity and a problem. The solution to the “problem” requires that we all eat tofu, ride the bus and show up at the local Gaia Center on our 65th birthday to be euthanized.
About as meaningful as finding the average phone number in the USA.
Exactly right.
The idea that the entire World even “has” a temperature is absurd in itself.
3782 record lows in just seven days! “Records haven’t merely been ‘broken’, they’ve been utterly obliterated.”
https://www.iceagenow.info/an-historic-seven-days-of-record-cold/
And all caused by “gerbil worming”
Not helpful when they don’t link to the data they discuss.
I didn’t see that reported on CNN !!! It could possibly be because I never watch CNN, but surely Loydo or griff would have posted it on here. Surely.
Jeez, ENSO kicked down a big chunk too.
A few cherry-picking days of extreme weather? Nah, climatically negligable, hot or cold. Here’s what Roy has to say:
“The linear warming trend since January, 1979 remains at +0.14 C/decade (+0.12 C/decade over the global-averaged oceans, and +0.18 C/decade over global-averaged land).”
17 consecutive months above the trendline I read on his blog site:
http://www.drroyspencer.com/2020/11/uah-global-temperature-update-for-october-2020-0-54-deg-c/
Just screams record cold doesn’t it. Smfh.
Yes a WEATHER EVENT , just like the El Ninos that have caused all the small warming in the satellite record, and the slightly less cold blob that stalled Arctic re-freeze in the Arctic.
All of them TOTALLY NATURAL, with absolutely zero evidence (as you keep showing) of human causation.
Just do a search for “record cold in USA October 2020”
And stop being so ignorant.
https://www.9news.com/article/weather/accuweather/october-snow-record-set-north-central-us-cold-weather/507-08219d49-3ee7-42e0-87a9-e2fbe926f124
https://electroverse.net/a-staggering-1204-u-s-sites-recorded-their-coldest-october-temperatures-ever-last-month/
oops, electroverse one is from last year, copied the wrong link
https://www.greatfallstribune.com/story/news/2020/10/25/9-days-27-7-inches-october-snowfall-great-falls-buries-record/6032761002/
https://weather.com/forecast/regional/news/2020-10-20-record-cold-west-rockies-plains
https://watchers.news/2020/10/29/coldest-temperature-record-contiguous-us-october-2020/
Thing is loy,
Hot records are usually by fractions of degrees, which are probably within the margin of error measurement
These new COLD records in the US have absolutely SMASHED old cold records.
No comparison !
Do you comprehend.?
or just DENY !
fred250
“Just do a search for “record cold in USA October 2020””
No need to Fred. USA48 on Roy Spencer’s UAH data set is shown above. +1.10C above 1981-2010 average. There might have been a few cold spots here and there, but overall it was the 6th warmest October in the US since 1979, according to UAH.
You truly are LAUGHABLE ..
Just put your head in the sand and DENY the massive numbers of COLD RECORDS just set in the US.
Otherwise your head will explode !!
“No need to”
FACTS are NEVER allowed to penetrate that little mind of yours, are they.
fred250
“FACTS are NEVER allowed to penetrate that little mind of yours, are they.”
such as the ‘fact’ that the very data set you always quotes shows that overall USA48 had its 6th warmest October in the satellite record, lol?!
Lots of COLD records just broken, smashed actually.
Do you DENY that? Why do you try to hide from that FACT ????
wow, 6th warmest.. SO WHAT !! such a short period 41 years, isn’t it.
fred250
Evidently the fact that lots of cold records were ‘smashed’ in the US in October had little bearing on average TLT temperatures as measured by UAH. October temperatures in the USA48 were “on average” well above normal for the month. If there was record cold in some places then it follows that the effect of this on a national scale was offset by unusual warmth in others.
The temperature anomaly map that will be published in the UAH monthly report for October will reveal where in the US lower 48 was warmer and colder, on average, over the course of the month.
That’s just weather. Now, a storm in the caribbean, that there is climate.
And a warmer, but now below freezing, blob in the Arctic is also climate.
Caused by human SUV and electricity.. of course. ! 😉
Isn’t it amazing to see how all it takes is a little weather to get rid of all of that terrible heat trapped by the carbon dioxide!
I thought the USA was really really naughty and produced lots of CO2
How can it it have go SO COLD
What are the standard deviations of the points in the figure?
Yes, over 6 months sometimes close to a 1C change is observed. A 1C change over 100 years is nothing.
Averaged over the entire globe for an entire month, the standard deviations must be huge, far greater than the few tenths of a Kelvin seen month-to-month. If they were plotted along with the averages, the squiggles would likely become nearly invisible.
Carlo, Monte
You point to an eternal problem with UAH data. Dr Spencer & Prof Christy never show them.
To have an idea about the trend with the associated CI, please have a look at Kevin Cowtan’s trend computer;
http://www.ysbl.york.ac.uk/~cowtan/applets/trend/trend.html
selecting ‘UAH6.0 TLT’ gives 0.137 ± 0.054 °C / decade (2σ).
J.-P. D.
I think you’ve missed the point—those confidence intervals are calculated with the averaged-averaged-averaged and time-smoothed data. If they were to be calculated with the raw data, the intervals would be a LOT larger.
Carlo, Monte
Sorry, Sir: YOU were here missing the point.
It makes few help to have a look to data showing tremendous peaks and drops everywhere. That is one of the reasons why some smoothing is useful.
Did you ever process raw data, e.g. that of GHCN daily’s 40,000 stations worldwide?
J.-P. D.
Yes I have dealt with large datasets, including using variances to calculate combined uncertainties.
These climate modelers don’t even both to try including uncertainty in these “anomaly” graphs.
No trended Global Average Temperature ever shows the standard deviation. That is regardless of the database used to derive it. They would quickly find out that combining populations also requires combining variances (not standard deviations) of each population that usually makes their overall variance increase. Doing this for anomalies, i.e. subtracting means, still has the variances of the populations accumulate. Doing that for 5000 stations ends up with a large variance that far outweigh the anomaly values.
Using variances is Hard Work, and likely would require conversion to absolute temperature (i.e. Kelvin).
And Step One is especially meaningless: calling the station daily (Tmax + Tmin)/2 an “average”.
Cycles and lags, repeat, cycles and lags, got it.
The tropical oceans remained warm after the end of the El Nino in May. They release heat into the atmosphere as they cool and that has kept the temperature elevated. Within the last few days it appears this is coming to an end. See the red line here:
Assuming nothing else significant changes, this should reduce the global temperature and with the advancing La Nina we should see a quick drop in the global average temperature over the next few months.
The Arctic has also released a lot of heat into the atmosphere with the late freezing this year. This is also ending as the ice is now quickly forming.
http://ocean.dmi.dk/arctic/plots/icecover/icecover_current_new.png
This is also ending as the ice is now quickly forming.
Just by inspection of my graphs, the last 4 days could be close to the fastest 4 day growth in extent “evah”.
I actually did a quick calc back to 1988 looking at the 4 day increase over a 20 day period before current date…. *seems* to be where the faster re-freeze generally is.
Fastest was 12/10/1995-16/10/1995 , increase was 1.103
2nd fastest 28/10/2020 – 1/22/2020, increase of 1.065
So, re-freezing very fast !
Yet still >2m km2 below the 1981-2000 average extent for the date. Ice Age cometh?
You mean as it recovered from the EXTREME high anomaly of the late 1970s, right ?
Are you another sea life hater that thinks having the Arctic frozen solid all year is “normal” or desirable”
Or are you just ignorant that the current level is still way above the “normal” level for the last 10,000 years
There are way to fix ignorance, but you have to actually want to..
….. but it seem you are quite happy in your current state of mental emtpiness.
Let me ask a simple question…..
If in an air-conditioned lounge room or office, what temperature do people set the thermostat at?
It depends on both the individual and how they are dressed.
That’s not an answer….
Most people I know set it somewhere from 18ºC to 22ºC
In Houston malls it seems to be set for 14c
Bloody cold
That’s just it isn’t it…
15C is .. coldish….
….. certainly colder than most people would set their thermostat..
Most people don’t even have electricity you doofus.
Yep, and the greenies and AGW apologists want to keep it that way.
In future, take both feet out of your mouth before typing. !
Sorry you still live in a mud hut with a dung fireplace.
Still using a computer though, aren’t you, loy !
“Most people don’t even have electricity”
Poor dumb loy…..gets it WRONG YET AGAIN
So funny…. so farcical….
And https://data.worldbank.org/indicator/EG.ELC.ACCS.ZS
90% of world’s population has access to electricity…
Poor loy.. just say D’OH and admit that it is YOU that is the DOOFUS !
Have you stopped taking your Clomipramine again?
Poor loy, you have been tried,
…. and you have FAILED MISERABLY.
Your life’s work !
(You need to dial down the personal comments, it is distracting from your science comments. We are here to debate the topic, NOT about the person you respond to) SUNMOD
With or without clothes?
No really info I need to know 😉
Let’s just say that if I’m in shorts and thin shirt, I don’t be using the air-con unless it gets to above 30C or so outside.
But then, I’d normally try to be outside anyway.
30C, slight off shore breeze and a good surf running….. life can be tough ! 😉
Water at 15-16C (close to global average temperature)….. need the wet suit.
Your three inches of blubber doesn’t quite do it?
I’m not the one blubbering all the time, loy
Get a grip on yourself…… or have you already.
Roy,
Is that 0.54 degrees +/- 0.20 degrees?
If so, shouldn’t that red line thickness be a big fat crayon of 0.4 degrees rather than 0.01 degrees to illustrate uncertainty better?
Why is the UAH graph never shown with error bars, as it should be?
You need to realize that it is not a direct physical temperature measurement. It is a calculation based upon readings of other measurements accumulated by the satellites. Kinda like using a proxy. An uncertainty budget is not available as far as I can tell. Therefore no errors or uncertainties are associated with the calculation.
The BoM has La Niña starting at the beginning October.
http://www.bom.gov.au/climate/enso/wrap-up/archive/20201027.sstOutlooks_nino34.png
Ole Humlum shows the GAT tracking the tropical SST, usually with a 1 – 3 month delay.
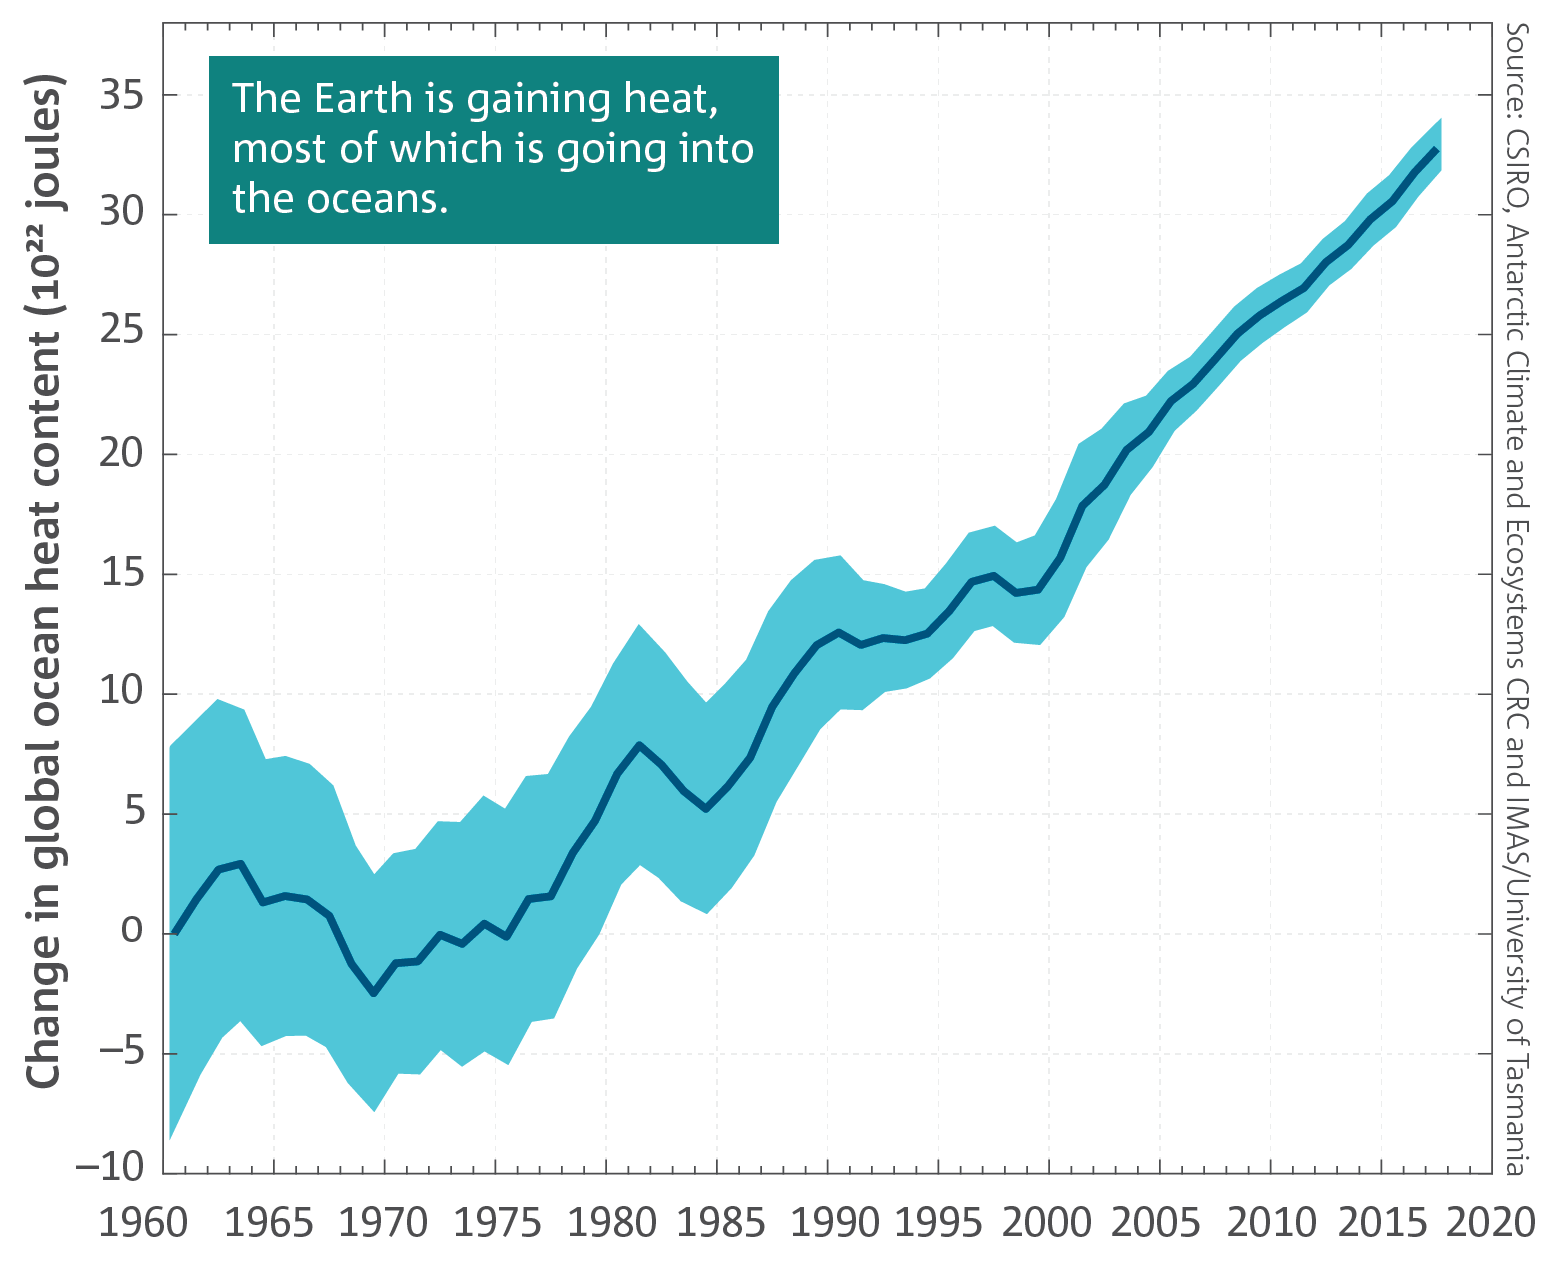
After reading the comments I notice that nobody had a real idea of what is the reason for the high temperatures after El Nino 2015/16. The super El Nino 2015-16 finished the temperature pause and the temperature has stayed after 2019 about 0.4 °C higher than during the pause. Greenhouse gases cannot cause such a rapid change – not even according to the IPCC science. The real reason is the increased shortwave radiation from 2001 to 2019 total of 1.68 W/m2. The major change of 1.2 Wm-2 has happened after 2014. It means that the climate driver, which should be almost constant per the IPCC, has increased the temperature in 20 years by the same amount (1,66W/m2 versus 1,68 W/m2) which took 270 years by carbon dioxide.
If this change in solar radiation would have happened in Total Solar Radiation (TSI), it would have been major news in climate change science. Because this rapid change is not good news for the IPCC and the climate establishment, there is radio silence. It looks like contrarian scientists are also not aware of what is going on.
More details:
https://www.climatexam.com/copy-of-press-release-mar-2020-engl
https://www.climatexam.com/single-post/temperature-increase-since-2016-is-not-anthropogenic
Do you have link to that SW data please.
Do you know what frequencies it deals with ?
Thanks.
Here is the link: https://ceres-tool.larc.nasa.gov/ord-tool/jsp/EBAFTOA41Selection.jsp
It is not straightforward to get the SW radiation. The first reason is that this data varies according to seasons and therefore you have to carry out deseasonalization. This is also a reason that this data lags behind 6 months and the last reliable reading is from January 2020.
hmmm.. server not found. !
Link works for me on Chrome.
Any measurement that shows global warming or cooling is faulty measurement. The globe has a very powerful thermostat that maintains oceans in the temperature range 271.3K to 305K. The average surface temperature is very close to the arithmatic mean of 288K.
The globe surface simply cannot warm or cool. Iit is stuck where it is for the next few thousand years given no volcanos or asteroids.
“Greenhouse effect” is rubbish. Climate models are worse than rubbish – they’re delusional.
Rubbish.
Well researched and informative reply!
Thanks for the link, very interesting, particularly the comparison values between the IPCC claimed CO2 forcing and the observed short wave forcing during the last years, which makes the IPCC assumption very unlikely.
Correlation is not causation but at least, actual observation supports your claim (and makes it hardly sensible to assume any positive feedback on global temperatures related to cloud cover as many alarmist climate models do) :
http://www.climate4you.com/images/TotalCloudCoverVersusGlobalSurfaceAirTemperature.gif
The all-time high temperature in November was measured during the last night (not day-time) in Finland and it was 14.6 Celcius (58.3 F). The place is about 600 km from the Arctic Circle. We should have snow cover but in my garden, some roses are still in bloom. Very nice.
Solar Brightening.
Especially during the Covid downsizing of economy.
It is not solar brightening. TSI is declining.
Where is the increase in SW coming from ?
How does the increase effect ocean penetration and warming ?
Very probably the reason is the decreased low-level clouds amount. How the increase of solar insolation increases the temperature of the surface? Shortwave radiation is solar radiation but the reason is not the increased insolation of the sun but the decreased reflected SW radiation into space.
Increased UVA getting through looks like it would mean more energy penetrating into the oceans..
https://agupubs.onlinelibrary.wiley.com/doi/full/10.1002/jgrc.20308
Maybe the reason is a decrease in ozone production during low solar activity (less solar flares)?
Ozone absorbs a significant proportion of shortwave radiation.
https://www.iup.uni-bremen.de/gome/gomemgii.html
I would like to see the UAH data for the tropical Pacific. This part of the ocean cannot exceed 305K. In fact the maximum recorded by the moored buoys is 31C and has been stable for 40 years. This is where climate models depart reality and I suspect UAH also departs reality:
https://1drv.ms/u/s!Aq1iAj8Yo7jNg3LJuByjstkozrzc
I suspect UAH is fiddled enough from reality to garner some respect in the church of climatology. But it is still rubbish. When it duplicates the tropical moored buoys, I will respect it as reliable. For now it is suspect like all other fiddled temperature data.
The “greenhouse effect” is pure nonsense. Climate models parameterise clouds when the reality is that clouds will be whatever is needed to reduce sea level insolation to maintain the tropical oceans at their current temperature.
Best I can manage is” UAH tropical Oceans” Lower troposphere.
Clearly wrong because it does not match the moored buoys. They show no trend over the last 20 years or even the last 40.
Apart from a couple of spikes at strong El Ninos and La Ninas, it remains within about +/0.5 anomaly.
Whatever the 0 means.
Step of 1°C in 40 years?
Only the dual El Nino at the end, dopey. !
Please start paying attention for a change…. you are already at the very bottom of the class.
RickWill
I don’t appreciate so very much people who all the time suspect other people to fiddle, or even to get it wrong everywhere without having checked their claim before. That’s really dishonest.
Today I had some idle time, and I show you how wrong you are with your highly speculative critique.
*
I compared, for the region 20N-20S — 155W-105W (which I identify with ‘Tropical Pacific’), the two temperature time series ‘UAH6.0 TLT’ (2.5 degree grid) and HadISST1 (1 degree grid averaged up to 2.5 degree):
https://drive.google.com/file/d/19gzp9vYb7RbNU56opfCzalGXGx5PGrdv/view
The comparison is based on anomalies wrt 1981-2010 (UAH default) and stops with May of 2020, I was too lazy to download newer ISST1 data.
Linear estimates for Dec 1978 – May 2020, in °C / decade
– UAH6.0 LT: 0.09 ± 0.02
– HadISST1: 0.02 ± 0.02
So, Mr RickWill: sorry, but you are doubly wrong.
1. The Hadley SST surface anomalies do by no means exaggerate the raw buoy data, neither in trend nor in the range of their absolute values.
Here are the monthly absolute averages in °C for the ten ‘hottest’ 2.5 degree grid cells (lat and long of the grid cell centers):
1997 8 | -21.25 | -106.25 | 30.82
2016 4 | 13.75 | -141.25 | 30.81
2016 4 | 13.75 | -143.75 | 30.76
1997 9 | -21.25 | -106.25 | 30.63
2016 4 | 6.25 | -156.25 | 30.62
2016 4 | 16.25 | -143.75 | 30.57
2016 4 | 16.25 | -141.25 | 30.55
2015 8 | -21.25 | -106.25 | 30.55
2016 4 | 8.75 | -156.25 | 30.52
2016 4 | 8.75 | -153.75 | 30.50
I suppose I don’t need to explain that all ten lines have to do with the El Nino’s in 1997/98 resp. 2015/16.
The maximal average SST for the whole region was 27.71 °C (April 2016).
*
2. Your second mistake is to think that temperatures in the lower troposphere automatically have to correspond to what is measured at the surface.
This is simply wrong, because the measurements in the lower troposphere show what happens at about 4-5 km above surface.
Not only is it much colder there (UAH6.0’s absolute average temperature for the region in April 2016: 274.08 K); you moreover have at such altitudes completely different weather and climate patterns due to powerful poleward convection and advection streams.
And there is NO reason for the temperatures generated by such streams to be identical to those measured at the surface.
At best can you see, when observing the 36 month running means in the graph above, a beautiful anomaly correlation between surface and lower troposphere.
Best regards from Germoney
J.-P. D.
Sources
UAH6.0 LT: https://www.nsstc.uah.edu/data/msu/v6.0/tlt/
HadISST1 SST: https://www.metoffice.gov.uk/hadobs/hadisst/data/download.html
The Version 6 Chart starts in 1979.
Is that when planet earth was first formed?
Was their no climate at all prior to 1979?
Earth is a few BILLION years old; the last 40 years is representative of what??
Imagine climate scientists living in the year 1200 or so studying the data over the last 40 years of the Medieval Warm Period and stating that the climate will permanently in the future be warm and never again be cold. After all, that is what the data showed for 40 years as well as the previous 400 hundred years or so.
How well would that prediction pan out?
Why does anybody think that an examination of weather/climate over the preceding 40 or 100 or 200 years etc. have any predictive value??
Ooops
I miss a comment here… and duh, I didn’t save it before posting 🙁
J.-P. D.
+.54 C? About a degree F. Meh. I might have been able to physically detect that when I was young, but I doubt it now.
Something alot more scary than this is needed for barely-believable marxist scare-mongering.
An impressive cold tongue with this La Nina
https://www.ospo.noaa.gov/Products/ocean/sst/anomaly/
If you transform the world map from square to spherical, it would be a much greater proportion of the world’s oceans.
The bipolar seesaw seems to be in full swing.
Quite understandable with this state of the Pacific ocean, that the activists controlling and editing our global climate data flourish another warmest year evuh! from 2020.
Some other observations that confirm that we are in yet another warmest year evuh! and orange man bad:
https://www.iceagenow.info/record-early-snowpack-across-the-northern-hemisphere/
https://www.iceagenow.info/record-snowfall-in-boston/
https://www.iceagenow.info/delhi-india-october-has-not-seen-such-a-low-temperature-in-the-last-26-years/
https://www.iceagenow.info/new-mexico-record-cold-across-entire-state/
https://www.iceagenow.info/an-historic-seven-days-of-record-cold/
https://www.iceagenow.info/record-snow-and-ice-in-the-u-s/
https://www.iceagenow.info/coldest-temperature-ever-recorded-this-early-in-the-season-in-the-lower-48/
https://www.iceagenow.info/mexico-snowfall-in-the-middle-of-october/
To be honest, Phil, I like the following image as it is more reasonable w/the color intensities. Of course, the La Nina is still obvious on this too:
https://vortex.plymouth.edu/mapwall/sfc/sst/anomaly.html
From the NASA/GISS website:
0.99 °C or 1.78 °F
“The “Global Temperature” figure (above) shows global temperature change since 1880. One gets this number by subtracting the first data point in the chart from the latest data point.”
The first data point in 1880 is -0.16°C.
December 1879 was the coldest month of the 19th century in France & central Europe, and the cold persisted into January 1880; the Dutch waterways were frozen for nearly two months and in Paris, fifty people died of cold.
The weather was unusually unsettled, and thought to be comparable with worst years of the Little Ice Age; coldest year in London (Kew Observatory) since detailed records first kept in 1841.
So this is what we’re measuring against?
The geomagnetic field affects the pattern and strength of a stratospheric polar winter vortex. Therefore, the variation of the sea ice in the north and south are different.
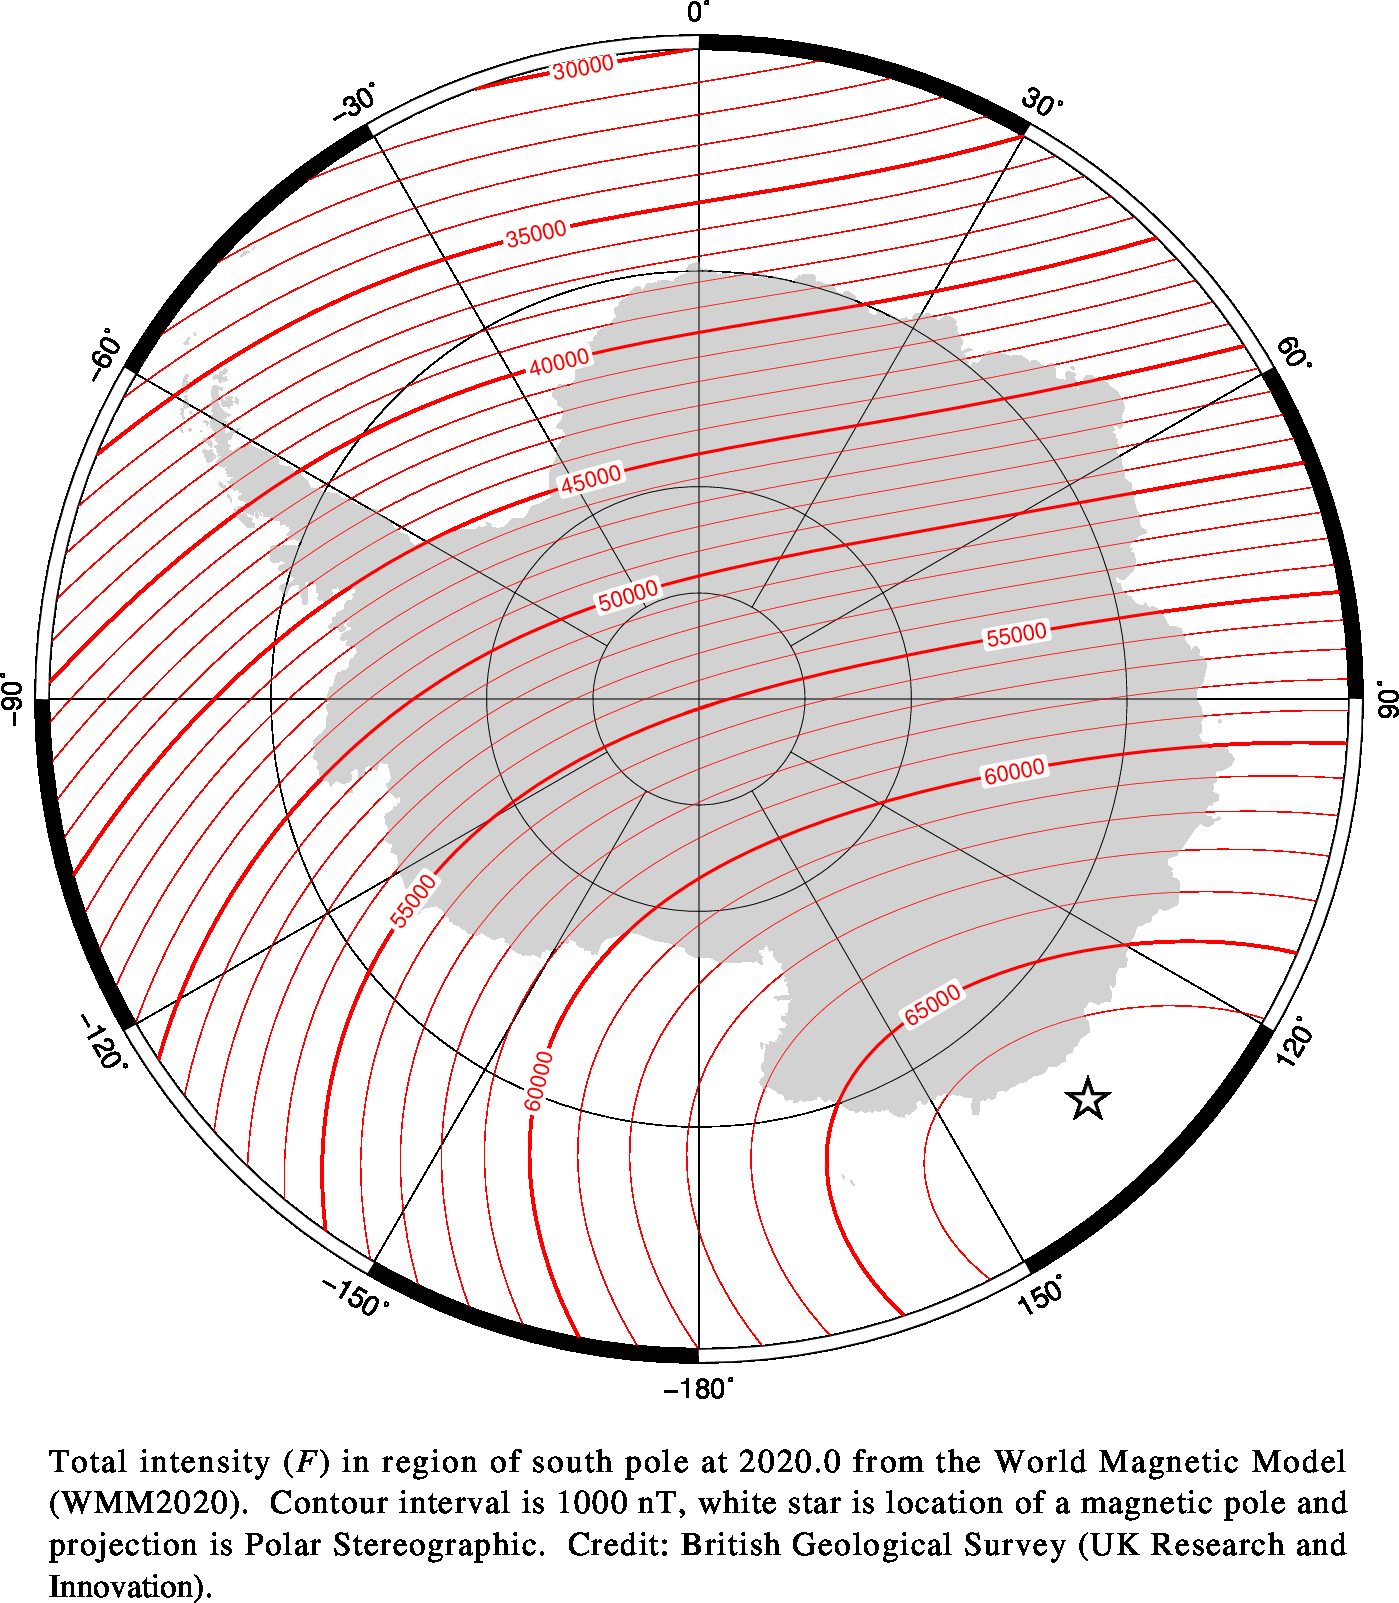
http://www.geomag.bgs.ac.uk/images/charts/jpg/polar_n_f.jpg
This is especially true for long periods of low solar activity.
Bindidon and RickWill,
Perhaps you are not as far apart as you feel. First, thanks to Bindidon to providing a nice graphical comparison of tropical pacific sea surface temperature anomaly data plotted together with the UAH TLT anomaly temperature data. This clearly shows the excellent correlation between the two and with (if I read it right) the sea surface (water) temperatures leading the tropospheric air temperatures. The correlation reflects the very strong influence of ENSO on air temperatures which is of course well known. You also demonstrate that two points expressed by RickWill are not invalidated by your plot/data: first you show a gradient of the SST data of 0.02±0.02 degC/decade (hence zero gradient is within the error range) and, second, the maximum you document for SST during the two major El Niños does not exceed 31C, as stated by RickWill.
So what is the issue? I do believe that the SST in the tropical pacific has been increasing since 1976, but it is by such a small amount that it is hard to distinguish it over two decades or even over four decades (still only 0.08 degC based on Bindidon’s analysis). The reason for believing that there is an increase in SST is that if I plot the sea surface temperatures from 1950 to present for the Niño3.4 area I can demonstrate a small increase. I will show more tomorrow.
Jim Ross
Thanks for your convenient reply.
1. You’ve read right: there is a lag between ENSO signals and the tropospheric reaction to them.
Not surprisingly, it seems to be here, in the Tropics area considered, a bit smaller than when considering the entire Globe.
2. The point for me was not to demonstrate that the SSTs in the region show a nearly zero trend compared to moored buoys, let alone would their average surpass the upper bound mentioned; rather, it was to show that with a trend of less than 0.1 °C / decade, UAH’s data looks quite correct, as opposed to RickWill’s claim, which Germans use to name “Erbsenzählerei”.
*
3. But in addition, let me please add that his claim is a non-sequitur, as calibration performed using moored buoys solely concerns satellite infrared readings at sea surfaces.
They have nothing to do with temperature readings using O2 microwave emissions in the 60 GHz band, which take place at tropospheric altitudes above 4 km, and whose calibration needs completely different methods.
Rgds
J.-P. D.
Bindidon
Just for clarification: I accept that your focus was on challenging RickWill’s argument that constant SSTs somehow show that the UAH data are invalid. I am 100% with you on that point and see no reason to question the UAH data.
The excellent correlation between the SST variations and the UAH data strongly support the latter’s validity in terms of short term fluctuations. Further, it is clear that ENSO is driving these variations in tropospheric air temperatures.
I think I will leave it there, having seen the discussion over at Roy Spencer’s blog.