Guest “geological perspective” by David Middleton
This is sort of a sequel yesterday’s post: Where’s the sea ice? 3 reasons the Arctic freeze is unseasonably late and why it matters.
With the setting of the sun and the onset of polar darkness, the Arctic Ocean would normally be crusted with sea ice along the Siberian coast by now. But this year, the water is still open.
Mark Serreze, University of Colorado Boulder
What a difference a day can make! Looks like it’s starting to crust over:

“Where’s the sea ice?”
Right here:

September is the most recent monthly ice extent map available. September is also when the annual minimum generally occurs. The magenta outline represents the median September ice edge from 1981-2010. The minimum Arctic sea ice extent generally occurs in September. At 3.9 million km2, this is the second lowest September “on record.” A record that goes all the way back to 1979.

Considering the fact that this is such a short record length, is a 3-5 million km2 annual minimum particularly anomalous? Or are the 6-7 million km2 annual minima from 1979-2000 actually the anomaly? We really need some context and scale here.
Geologists are big on context and scale. When a geologist takes a picture with a person in it, the person is just for scale. Since quarters, lens caps and rock hammers are far too small to provide scale to 3.9 million square kilometers of sea ice, and 42 years is far too short of a time span to provide context, we need something bigger, with a longer time span.
Scale
We can use the Arctic Ocean to provide scale:
The Arctic Ocean is the smallest of the world’s five oceans (after the Pacific Ocean, Atlantic Ocean, Indian Ocean, and the Southern Ocean). The Northwest Passage (US and Canada) and Northern Sea Route (Norway and Russia) are two important seasonal waterways. In recent years the polar ice pack has receded in the summer allowing for increased navigation and raising the possibility of future sovereignty and shipping disputes among the six countries bordering the Arctic Ocean (Canada, Denmark (Greenland), Iceland, Norway, Russia, US).
Area:
CIA World Fact Book
total: 14.056 million sq km

3.9 million km2 represents 28% of the area of the Arctic Ocean.
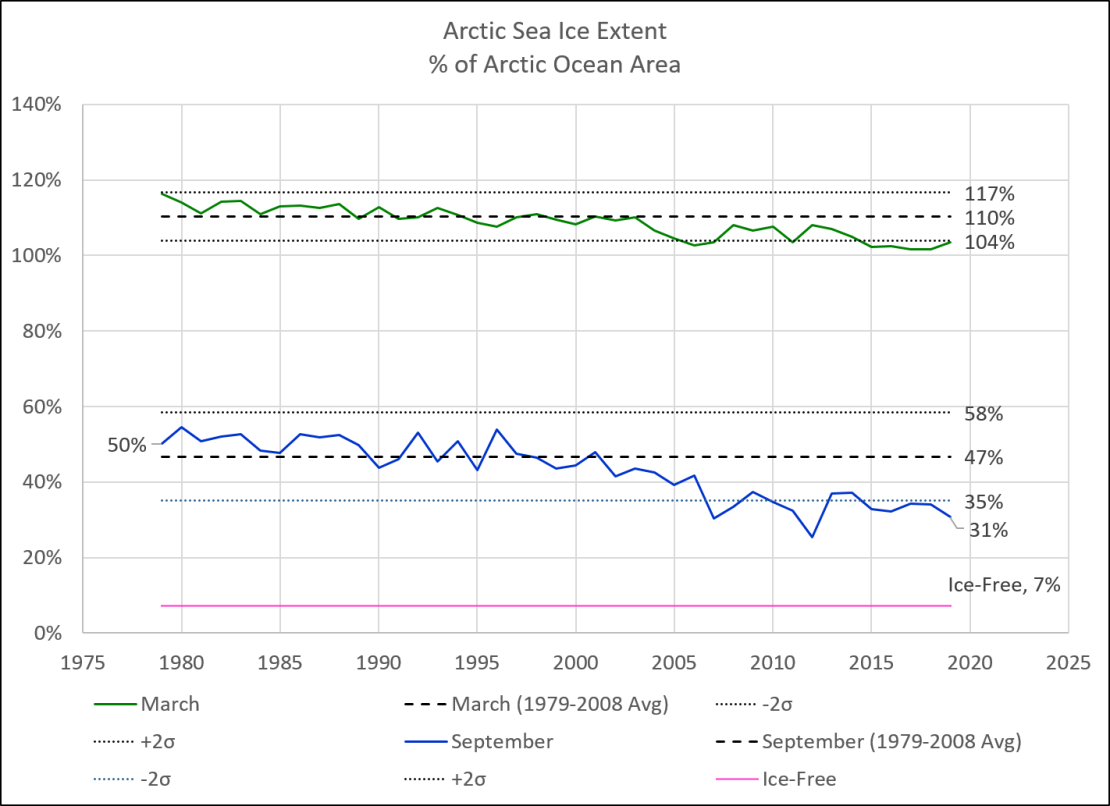
28% of the Arctic Ocean is just a bit below the climate “normal” range of 35% to 58% for the annual minimum. This doesn’t sound like much of a death spiral to me. Bear in mind that the satellite record started right about here:

Context
42 years is much too short of a record length to determine what the climate “normal” should be. It doesn’t provide a meaningful context. Fortunately, there have been efforts to reconstruct sea ice extent prior to the satellite record.

Nearly 70 years is better than 42 years… But still insufficient for context.
To look back into the past, researchers combine data and records from indirect sources known as proxy records. Researchers delved into shipping charts going back to the 1950s, which noted sea ice conditions. The data gleaned from those records, called the Hadley data set, show that Arctic sea ice has declined since at least the mid-1950s. Shipping records exist back to the 1700s, but do not provide complete coverage of the Arctic Ocean. However, taken together these records indicate that the current decline is unprecedented in the last several hundred years.
NSIDC
“The current decline is unprecedented in the last several hundred years” claim is a big, fat No Schist Sherlock. Earth has been warming from the coldest climate of the Holocene (the Little Ice Age) for the last 400-500 years.
Kinnard et al, 2008, pieced together a reconstruction back to 1870…

Oddly, Kinnard indicates minima with about 1 million km2 more ice extent than the satellite data.

Now we ‘re seeing a hint of context. The sea ice decline began when the Arctic sea ice extent was anomalously large. Let’s relate the context to scale:

According to the Kinnard reconstruction, the Arctic Ocean still has about half as much summer sea ice as it did at the end of Neoglacition, the maximum extent of Holocene glaciers and sea ice. Why is this a bad thing? Since 1870, Arctic sea ice has been retreating from this sort of climate “normal”…

Kinnard also featured a neat map:

Panel B is the annual minimum. Kinnard et al assert that the gray area had been covered with summer sea ice 100% of the time from 1870-2003. Let’s overlay the 2020 NSIDC map on Panel B:

Alright… So, the annual sea ice minimum is now clearly lower than it was from the Little Ice Age through “The Ice Age Cometh”… How is this a bad thing? For that matter, we still don’t know which is the true anomaly: The recent 3-5 million km2 annual minima or the 6-10 million km2 annual minima from 1870-2003? The minimum summer sea ice covered about twice as much area for 90% of the past 150 years… So what? Is 150 years a long time? Is it relevant to the Holocene Epoch? Is it one of the “Goldilocks conditions” of the Holocene? We clearly need more context. We need a geological perspective.
A Geological Perspective
Stein et al., 2017 (H/T tty) provided a great description of a rather novel method of determining paleo sea ice extent.
In a pioneering study by Belt et al. (2007), the ability to (semi-)quantitatively reconstruct paleo-sea ice distributions has been significantly improved by a biomarker approach based on determination of a highly branched isoprenoid (HBI) with 25 carbons (C25 HBI monoene = IP25). This biomarker is only biosynthesized by specific diatoms living within the Arctic sea ice (Brown et al., 2014) and appears to be a specific, sensitive and stable proxy for Arctic sea ice in sedimentary sections representing Late Miocene to Recent times (Stein et al., 2012, 2016; Belt and Müller, 2013; Stein and Fahl, 2013; Knies et al., 2014). The presence of IP25 in the studied sediments is direct evidence for the presence of sea ice.
[…]
For more semi-quantitative estimates of present and past sea ice coverage, M€uller et al. (2011) combined the sea-ice proxy IP25 and phytoplankton biomarkers in a phytoplankton- IP25 index, the so-called ‘PIP25 index’:
PIP25 = [IP25]/([IP25] + ([phytoplankton marker] x c))
with c is the mean IP25 concentration/mean phytoplankton biomarker concentration for a specific data set or core.
[…]
Stein et al., 2017
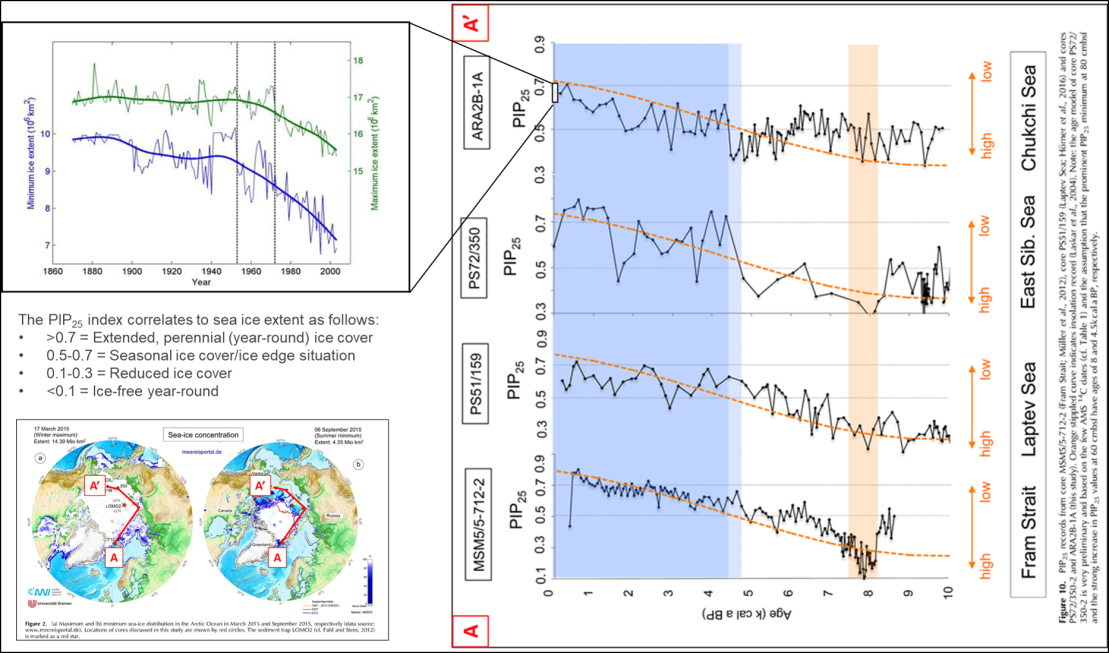
This schematic diagram from Belt et al., 2013 relates the PIP25 index to sea ice conditions:

Generally speaking, the PIP25 index correlates to sea ice extent as follows:
- >0.7 = Extended, perennial (year-round) ice cover
- 0.5-0.7 = Seasonal ice cover/ice edge situation (mostly ice-free in summer)
- 0.1-0.3 = Reduced ice cover (only winter ice)
- <0.1 = Ice-free year-round
Here’s an example from the Chukchi Sea:

Note that the sea ice at this location has only been seasonal since about 1,600 years ago. Prior to that it was considered reduced, covered only partially during winter. It was much lower than it is today for about 85% of the Holocene.
Stein et al. 2017, constructed a cross-section of PIP25 curves across the Arctic from the Fram Strait to the Chukchi Sea.

All four core locations currently reflect seasonal ice cover/ice edge situations (PIP25 index 0.5-0.7), with the Fram Strait being an ice edge situation and the other three reflecting seasonal ice cover.

Two key takeaways:
- Maximum Holocene sea ice extent occurred within the past 500-1,000 years at every location.
- The current sea ice extent is higher at all of the locations than over 50% to 85% of the Holocene.
While this doesn’t tell us what the sea ice extent was in million km2, it does tell us that the modern sea ice extent is larger than it was over most of the Holocene Epoch. It also tells us that the areas of currently seasonal sea ice extent have been seasonal or reduced over most of the past 5,000 years and ice-free or nearly ice-free over the prior 3,000 years or so. Here’s is the Kinnard graph plotted at the same horizontal scale as the Stein cross section:
Where’s the sea ice?
Right where it’s been for most of the Holocene… And that’s a good thing. Had the sea ice continued to expand as it was from 8,000 years ago up until the mid-19th century, this would still be the climate crisis du jour:
So, next time you get gas at an Exxon station, be sure to thank them for this:


Humble Oil was founded in Humble, Texas in 1911. In 1919, Standard Oil of New Jersey acquired a 50% stake in Humble Oil. They acquired the other 50% in 1959. All of the affiliates were merged into Exxon Corporation by 1973 and Exxon ultimately merged with Mobil Oil Corporation, a descendant of Standard Oil Company of New York, in 1999 to become ExxonMobil (Texas State Historical Association).
Here’s your oil industry trivia for the day:

In as few as three more mergers, Standard Oil could be put back together again! That’s fracking awesome!
References
Belt S.T., Müller J. “The Arctic sea ice biomarker IP25: A review of current understanding, recommendations for future research and applications in palaeo sea ice reconstructions”. (2013) Quaternary Science Reviews, 79, pp. 9-25. Belt_2013
Fetterer, F., K. Knowles, W. N. Meier, M. Savoie, and A. K. Windnagel. 2017, updated daily. Sea Ice Index, Version 3. [Sea Ice Monthly By Year]. Boulder, Colorado USA. NSIDC: National Snow and Ice Data Center. doi: https://doi.org/10.7265/N5K072F8. [Accessed October 16, 2019].
Kinnard, C., Zdanowicz,C.M., Koerner,R .,Fisher,D.A., 2008. “A changing Arctic seasonal ice zone–observations from 1870–2003 and possible oceanographic consequences”. 35, L02507. Kinnard_2008
Stein, R. , Fahl, K. , Schade, I. , Manerung, A. , Wassmuth, S. , Niessen, F. and Nam, S. (2017), Holocene variability in sea ice cover, primary production, and Pacific‐Water inflow and climate change in the Chukchi and East Siberian Seas (Arctic Ocean). J. Quaternary Sci., 32: 362-379. doi:10.1002/jqs.2929 stein2017
We humans are digging our own graveyards! It is so disheartening to see the the depleting ice cover.
RUBBISH,
The Arctic sea ice is luving it..
Not only is the land surface GREENING, but the seas are also springing BACK to life after being TOO COLD and frozen over for much of the last 500 or so years (coldest period of the Holocene)
The drop in sea ice slightly toward the pre-LIA levels has opened up the food supply for the nearly extinct Bowhead Whale, and they are returning to the waters around Svalbard.
https://partner.sciencenorway.no/arctic-ocean-forskningno-fram-centre/the-ice-retreats–whale-food-returns/1401824
The Blue Mussel is also making a return, having been absent for a few thousand years, apart from a brief stint during the MWP.
https://journals.sagepub.com/doi/abs/10.1177/0959683617715701?journalCode=hola
Many other species of whale are also returning now that the sea ice extent has dropped from the extreme highs of the LIA. Whales cannot swim on ice. !
https://blog.poseidonexpeditions.com/whales-of-svalbard/
Great thing is, that because of fossil fuels and plastics, they will no longer be hunted for whale blubber for lamps and for whale bone.
Hopefully the Arctic doesn’t re-freeze too much in the next AMO cycle, and these glorious creatures get a chance to survive and multiply.
And of course there is absolutely ZERO evidence of any human causation in this highly beneficial recovery of Arctic sea ice from its extreme highs in the LIA and late 1970s.
NEETU seems typical of those tramatised by the constant AGW propaganda into believing that nothing should ever change in nature and thus if something does change it’s due to human activity.
Every change can be summarise by a straight line “trend” which can then be spuriously and non scientifically be “correlated” and attributed to changes in atmospheric CO2 … and thus “our fault”.
Anyone such a simplistic and uninformed view of the natural world will “disheartened” very often.
The oft cited NSIDC graph shown in fig 2 is typical of this kind of pseudo scientific misdirection. They fit a straight line and colour it a strong blue. As such it stands out as the most prominent visual factor on the otherwise monochrome graphic.
This is, without explicitly claiming it, incites the reader’s mind to skip looking at the data and seeing what it tells us and forces the idea of constant linear decline and the implied ( unfounded ) assumption that this adequately captures what is happening and is thus sufficient to assume that this will continue.
If you remove the fitted straight line, your eye will instantly realise that September Arctic sea ice extent has been essentially flat since 2007. These fitted straight lines have seen the slope reducing persistently over the last decade as the same drop happens over a longer and longer period. So even that interpretation of the data shows the sea ice melting is slowing not accelerating as they would have you believe.
Both the slowing rate of trend analysis and the stable level of ice over the last 13 years is absolutely inconsistent with the assertions that we are seeing “run away melting” , positive albedo feedbacks and that this is primarily driven CO2 and AGW.
If NEETU is a real fan of freezing to death, he can be heartened instead of disheartened.
Love the disappearing ice! Less poor animals trapped under the ice like what frequently happens to Beluga whales. More open water to let the sunshine get down to the plankton that are the base of the whole food chain! Less water trapped as ice ultimately means more water vapour in the air raining down over the rest of the world.
Serious question: Why?
Do you enjoy ice and cold?
The Sea Ice around Antarctica has always been seasonal since mankind has been able to explore there in sailing ships 200 years ago. It has always almost completely disappeared by the SH autumn. No one gives that total sea ice seasonality a second thought.
So why do we fret the NH Arctic Sea Ice? Before the LIA ICe Age and the Arctic Sea Ice Age, men used to dream of NW Arctic Sea passage from Europe to the Orient. That dream came to an abrupt end by the mid-19th Century.
Arctic Sea Ice in the summer-fall is so over-rated. It is has zero practical importance in any scheme, human or ecological.
Neetu chooses to live in INDIA where it is warm most of the year.
If he is so in despair of warming, may I suggest he moves to Nuuk or somewhere in Iceland, where the warmth will never bother him again.
What a clown !!
12th century, there is evidence of the Danes and other Scandinavian nations traveling through open Arctic Oceans.
The big win will be if we’ve actually (as claimed) eliminated the coming Ice Age!
That would have been a disaster unlike anything the alarmists could imagine!
You would prefer rapidly advancing ice sheets? Why?
I’m sure you have actual proof humans are in control of Earth temperature and geological evolution. And, while at it, in control of the Universe too.
Try reading the article before commenting.
hahaha. that’s a good point. And I tried, but just not that hard. So my comment will be limited to:
I prefer my ice in a glass with some tea, thank you
Climate ALWAYS changes. But how many know we actually live in an Ice Age for the last 3.5 Million years . Even during the Holocene (last 12 000 years) trees have been able to grow much closer to the poles and much high up the mountain than today . For more than 200 Million years it has never been so cold as the last 3.5 Ma . You can even find that on wikipedia .
yes, if I get the math right and assume a 100% efficient process Humble oil was melting 0.6 cubic miles of ice in a year and lets assume that went on for 50 years so now have melted 28 cubic miles of ice. Spread that loss over 1,400,000 sq mi and it must mean that part of the cap was only about an inch thick 50 yrs ago…awesome! I’m gonna go hide in my basement now and watch TV.
7,000,000 tons ice melted per day by Humble oil assuming 100% efficient melting process
3,700,000 sq km less ice cover at the N pole (alleged)
1,428,200 sq mi less ice cover at the N pole
50 yrs, assumed period of ice retreat
147,197,952,000 cubic ft per cubic mile
9,126,273,024,000 lbs wtr per cubic mile
4,563,136,512 tons wtr per cubic mile
1.5E-03 cubic miles ice assumed melted per day by Humble
28 cubic miles ice melted in 50 yrs
2.E-05 miles thickness of ice melted
1.2 inches thickness of ice melted
Conclusion: cap was too thin in the region where is is now missing and was melted by a 100% efficient thermal process
1) Will you be the first person to actually present evidence that warmer is worse?
2) Why is it so depressing to see depleting ice cover? I for one see easier access to trillions of dollars worth of resources. That’s a VERY good thing.
3) Did you actually bother to read the article? The author thoroughly refuted your beliefs.
What part of “anomalously large” start don’t you get?
You’re absolutely right. Fortunately, this interglacial will end and the area where I live will again be covered by mile thick ice. If you are patient and reincarnate a few times you can witness those magnificent glorious ice sheets.
Oh, sure… because so much grows in ice, right?
You’ve been inculcated with a political ideology / climate religion which claims that Earth must stay exactly as it is now, otherwise gloom and doom necessitating global socialism to ‘fix’ the ‘problem’.
You lack historical perspective and have no sense of scale or context, and you’ve gullibly bought into the zeitgeist that more ice = good and colder=better.
As usual, liberals are diametrically opposite to reality. LOL
Climate alarmism is a form of prophecy, not science, and as such should be regarded not as science but as a form of religious dogma. Science cannot foretell the future, whereas climate alarmism purports to do exactly that. Science can make accurate predictions based upon known regularities of nature by utilizing the laws of physics which we have discovered (for instance, predicting the Voyager space probes’ paths as they made their way out of our solar system)… but climate alarmism does the exact opposite, it predicts a departure from the known regularities of nature, and eschews the laws of physics for a plethora of tweakable parameters in their climate models, alarmist proclamations, appeals to authority and various other shady tactics.
Thank you David..
Confirms everything I have been saying
Those you think Arctis sea ice is currently LOW, are DENYING climate science and climate change history.
As you show , with data from a highly reliable bio-marker…. current levels of sea ice are significantly above the Holocene norm.
A bit more data to back this up
The extreme high extents of the LIA and late 1970s (up there with the LIA extents) were the anomalous sea ice levels.
And yes, there has been a highly beneficial RECOVERY from the extreme high levels of the LIA and late 1970s.
This has been great news for Arctic sea life. (I won’t post those links again at the moment)
Figure 16 is great, not seen that one before. Thanks… 🙂
Shows the recovery from the LIA/late1970s extremes in its true context.
There really is ONE HECK OF A LOT of sea ice up there, isn’t there !!
The climate scammers trying to make an alarmist message out of less Autumn-season Arctic Sea Ice has always seemed stupid to me.
– First, Who cares??? Really. Less sea ice into a 24 hour darkness of a long winter means more heat venting to 4 K space to balance the solar input equation at the mid and equatorial latitudes. The Earth sits in 4 K system insulated by its atmosphere from that cold. Cryogenic cold is the norm for most of the solar system. Be glad for the warmth our vast Blue Ocean’s water provides as a heat storage buffer.
– Second, Polar Bears are doing great. It was the human hunting with rifles that decimated them, not the climate scam.
– Third, less Autumn high latitude sea ice correlates with arctic phytoplankton blooms. Those blooms feed the the entire arctic food chain through the winter-spring to the summer.
When I hear Idiots like Joe Biden say “Climate Change is going to Bake our planet,” I just shake my head in both disbelief at hius stupidity and in disgust at that idiocy he is spewing to a naive public.
Last year was the very first winter … ähm with no winter in Siberia. No blocking siberian high.
Not since LIA or since 1979.
Probably for the first time in 1000 years.
It is a new climate system now over eurasia.
Is it good or bad?
On a longer sight certainly good.
But right now, the permafrost is thawing and makes a lot of problems.
“with no winter in Siberia”
What a load of arrant RUBBISH
Siberia dropped to -50 C in places in January
https://www.youtube.com/watch?v=FxLO5Hz56OY
https://siberiantimes.com/other/others/news/as-siberia-hits-its-coldest-temperatures-of-the-winter-heres-how-to-enjoy-life-below-50c/
https://www.severe-weather.eu/recent-events/brutal-cold-in-yakutia-russia-mk/
Why post NONSENSE that so easily proven totally and absolutely GARBAGE. !!
January 26th 202
You are either deliberately LYING or unbelievably ignorant.. or both.
And because all the slightly warmer air has been sucked up into the Arctic
…… Winter has arrived EARLY this year in Southern Siberia.
https://electroverse.net/winter-arrives-early-in-southern-siberia/
And in Northern Siberia, temperatures are now down to there normal -30C or colder.
Cold record in August 2020, Siberia…
https://www.iceagenow.info/cold-records-shattered-in-siberia/
Fascinating how a single instance is proof that this is now the new normal.
That’s the kind of thinking acolytes use, not scientists.
No reply yet so looks like this may have been posted after griff’s bedtime. When they respond, let’s look for their forecast of when the Arctic will be ice free, since the forecasts of 2013, 2014, 2015, 2016 and 2018 didn’t come to pass. https://cei.org/blog/wrong-again-50-years-failed-eco-pocalyptic-predictions
The Earth is around 4.5 Billion years old. We have good sea ice data since 1979.
See what I did there?
Also check Figure 6. It is an anomaly graph with baseline from 1968-1996. Now, if someone will explain what is significant about that baseline period it might make sense.
There’s good satellite data going back to the 1973. It’s generally not referenced because it’s inconvenient to the narrative.
Parkinson and Cavalieri, JOURNAL OF GEOPHYSICAL RESEARCH, VOL. 94, NO. C10, PAGES 14,499-14,523, OCTOBER 15, 1989 – ARCTIC SEA ICE 1973-1987: SEASONAL, REGIONAL, AND INTERANNUAL VARIABILITY
Mr. Moon
Thanks for the laugh. And of course this is the basic idiocy of the entire we-will-all-die-from-climate-change hysteria.
The only good ice are the icecubes in my drinks.The less ice in this world the better.I don’t function well in the cold and i assume most of us don’t.So i have no idea why anyone would want more ice.Yes i know “we are doomed because the oceans will rise”.What rubbish!
Whenever I put ice in a glass, there always seems to be followed by a distinct and rapid lowering of the fluid level in the glass.
Ack! It is sacrilegious to put ice in a good single malt scotch! Summertime margaritas are another story.
Yeah… Single malt scotch is usually best neat.
Up here in the gulf stream impinged UK there’s a lot of late heat in the year. I don’t trust it. Some part of me expects seriously cold this winter. No idea why.
could this be one reason why?
https://apps.ecmwf.int/webapps/opencharts/products/w_sst?area=Europe&base_time=202010310000&level=sst&valid_time=202011150000
Cold, with heavy snow, is my bet.
Look for ladybirds (“ladybugs”, for those from across the pond) in your garden. If you can’t find them, it is going to be cold; if you can, rest easy. No-one knows how these little beauties do it, but they know how bad the winter is going to be.
Haven’t seen any in weeks. Danged butterflies vanished just when my Lantanas started blooming well too. I live just east of Atlanta Georgia.
Loss of sea ice is a negative feedback, sea ice insulates the ocean.
Even in mid summer DSW is exceeded by heat loss.
David,
I hadn’t seen the ice-core proxy graphs, they are interesting. But they seem to contradict the story of ice-free in summer 7,000 years ago:
https://wattsupwiththat.com/2008/10/21/researchers-find-arctic-may-have-had-less-ice-6-7000-years-ago/
Can you explain?
Thanks,
David
What do you mean,
All of them show FAR LESS sea ice than there is currently.
That is what the “seasonal” shaded part of Figure 13 means, often not much sea ice in summer.
Unlike now, when there is still one heck of a lot of sea ice in summer.
The Holocene ice minimum occurred about 8000 ya and has increased to its maximun within the last century or so (Fig 15) Nothing new there. The rise and fall is in fairly close to insolation expectations
Add 70 years of warming to the end of that graph taking us close to as warm but probably warmer than any time in the Holocene.
The climate was in a cooling neoglaciation phase as you point out. What is the geologist’s context on this wildly unexpected reversal?
“28% of the Arctic Ocean is just a bit below the climate “normal” range of 35% to 58% for the annual minimum.”
To what % does it fall to before even a geologist says hmm, WUWT?
Wake me up when the dinosaurs come back. Hot house earth and everything living (plant and animal) trended toward gigantisim. No SUV’s needed. Next.
These NATURAL variations are so difficult for you to understand, aren’t they loy.
Do you have any evidence at all that the highly beneficial drop in Arctic sea ice from the extreme highs of the LIA and late 1970s has any human causation ?
“What is the geologist’s context on this wildly unexpected reversal?”
THANK GOODNESS it WARMED instead of cooling further. !
I know graphs are really really hard for you loy.
But what don’t you understand about Figure 16 ?
See how TINY the change has been since the LIA peak !!
Do you need someone to explain that to you ???
Notice how the acolyte lies about the data in order to support it’s religious beliefs.
It admits that the Holocene was warmer than today, but then claims that it was due to changes in insolation. Of course the data doesn’t support this belief, but it doesn’t care.
Then it tries to pretend that there has been some kind of straight line trend since this Holocene high. Once again a complete lie. It has been shown the real data many times.
1) Insolation changes over the last 10K years are too small to make any difference in temperature.
2) Over the last 5000 years there have been 5 warm periods that have interrupted this general downward trend. 4K years ago was the Egyptian Warm Period. 3K years ago was the Minoan Warm Period. 2K years ago was the Roman Warm Period. 1K years ago was the Medieval Warm Period and currently we are in the midst of the Modern Warm Period. In addition to the regulatrity of these warm periods is the fact that the height of each warm period has been cooler than the previous, and none have reached the averages enjoyed during the Holocene Optimum.
What lie?
Everything you type is a LIE.
You know you can’t back it up with science, but you say it anyway.
That makes you DISHONEST, as well as having zero credibility or integrity.
“Add 70 years of warming to the end of that graph taking us close to as warm but probably”
End of the graph is after the warming from the late 1850 to 1940.
So……. around the same temperature as now.
So either you are IGNORANT or you are deliberately LYING
Which is it loy satte !
You do know the original Marcott thesis graph didn’t have that up-tick at the end don’t you.
Only added once he got in cohorts with the climate glitterati and committed the DUMB mathematical error of adding hi resolution data to low resolution data. And the truly MANNian fraud of turning down point data upside down
https://wattsupwiththat.com/2013/03/16/mcintyre-finds-the-marcott-trick-how-long-before-science-has-to-retract-marcott-et-al/
Furthermore, Marcott himself ADMITTED that the up-tick was not statistically robust, but needed to be there so he could be accepted into climate scientist circles.
https://notrickszone.com/marcott-et-al-rebuttal-2013/
But you know NOTHING about maths or science, do you , loy.
So I’d say 97% ignorance, and 3% brain-malfuction.
“Add 70 years of warming to the end of that graph taking us close to as warm but probably warmer than any time in the Holocene.”
There is no evidence for the world today “probably” being warmer than any time in the Holocene.
The world is no warmer now than it was in the Early Twentieth Century.
If you have any evidence to the contrary, please present it.
David,
Thank you for bringing the work of Stein et al. 2017 to my attention.
UTTER NONSENSE!
Because what matters is what is happening now, not what happened under very different conditions several thousand years ago.
Was this the second lowest extent in the satellite record? Yes. If we look at Russian/soviet records and other records from last century, was this the second lowest in 100 years? Yes.
does this show a continued decline over the last 40 years? yes.
Is the level through October the lowest for date on record for 100 years? Yes!
So explain that -don’t try and explain it away.
If this is a low point in a cycle, why is it so much lower than the last low point?
The arctic was ice free in summer last time because the Earth’s orbital inclination produced extra insolation during summer. It was down to a Milankovitch cycle effect. We don’t have the same effect now – yet we have the lowest levels since then.
This is NOT the same as it has been for the Holocene. It is a new and continuing low.
Just look at the little red lines on the NSIDC charts with this article – those are where the ice should be if this was just like the rest of the Holocene
UTTER NONSENSE..
There you go titling your posts again griff.
Current levels are FAR ABOVE the Holocene norm
Don’t try to explain it away by using a piddlingly short period since the EXTREME HIGH ANOMALY of the Little Ice Age.
Why is there STILL SO MUCH Arctic sea ice , griff?
Do you have any evidence at all that the highly beneficial drop in Arctic sea ice from the extreme highs of the LIA and late 1970s has any human causation ?
Stop flapping around like a stunned mullet
REJOICE in the FACT that Arctic sea LIFE is returning to the Arctic.
” It is a new and continuing low.”
Another LIE from griff
It is current far higher than for most of the last 10,000 years.
Only a partial recovery from the anomalous high extents of the LIA and late 1970s
STOP DENYING CLIMATE CHANGE, griff
While we don’t have detailed sea ice extent estimates prior to 1870, we do have alpine/valley glacier length estimates back to 1700.
45% of the ice loss occurred before 1900, when atmospheric was still below 300 ppm. By 1950, 75% of the ice loss had occurred. Only 25% of the ice loss has occurred since humans allegedly became the primary drivers of climate change. At the time of “The Ice Age Cometh” (1975), 90% of the ice loss had already occurred.
In the extremely unlikely event that the climate models are right, 90% of the ice loss occurred before an anthropogenic fingerprint could be discerned.
I forgot to also point out that the warm-up from the Little Ice Age began in the 1600’s, about 200 years before atmospheric CO2 started rising.
And there is a complete anti-correlation between atmospheric CO2 and temperature during nearly all the Holocene
“October the lowest for date on record for 100 years? Yes!”
Unknown, 1922 was also a recovery period as the Arctic warmed considerably
But 100 years is such a piddlingly short period and part of the highly beneficial warming out of the COLDEST period in 10,00 years.
An Arctic that is FULL of sea ice all year is a desolate place, even polar bears can’t find food easily .
Why do you want that so badly ????
The drop from those extreme levels of sea ice has been totally beneficial for all Arctic life, on land and especially at sea.
You should look at the whole of the current inter-glacial, NOT the VERY COLDEST period..
Then you would find that current levels are FAR HIGHER than for most of that 10,000 years.
Griff in the same time frame 1979-2020 the following teams have never won the English Football League Championship. Numbers in brackets are the total number of championships Nottingham Forest (1), Derby County(2), Ipswich Town(1), Tottenham Hotspur(2), Burnley(2), Wolverhampton Wanderers(3), Portsmouth (2), Sunderland (6), Sheffield Wednesday (4), Newcastle United (4) , Huddersfield Town (3) , West Bromwich Albion(1), Preston North End (2).
The picture you get if you don’t have the full story is totally skewed, especially if you support Manchester City or Chelsea (6 titles each) secured the majority of their titles in the 21st century, mainly thanks to huge financial investments by people wanting a specific result.
‘Everything I know most surely about morality and duty, I owe to football’. Albert Camus
Wow…..”UTTER NONSENSE!”…..someones had their Weetabix®
“Is the level through October the lowest for date on record for 100 years? Yes!”
We can all play these silly games by grabbing data points and shouting Eureka!
The fact that the amount of ice ADDED during the month of October 2008 exceeded 4 million Km² doesn’t interest you I presume.
Is the fact that the amount of ice ADDED during the month of October 1996 was only 1.5 million Km² significant?
Was the planet hotter in ’96 than ’08? ……..explain it away.
I post the link again for people to see, this is from the National Snow & Ice Data Center, people can decide for themselves, you are a lost cause.
http://nsidc.org/arcticseaicenews/files/1999/11/Figure2b-1.png
While you’re predicting the end of the world because of a slow October freeze this year, think about this:
“Overall, sea ice extent increased 2.79 million square kilometers (1.08 square miles) in October 2019.”
….that’s more than in October 1980, 1981, 1983, 1984, 1985, 1986, 1987, and 1988. 1989 was about equal.
October 2019 was not a one off by any means. Apart from 2016, you can go back to 2005 and find that all those years had greater ice increases for October than most of the Eighties.
A graph of CB’s data.. October gains.
Because of the sluggish start due to a WEATHER event, this year will be on the lower side, but it is already ABOVE most of the gains in the 1980s
I will update that graph around this time tomorrow, with 2020 data included.
Where’s your evidence that conditions were hugely different thousands of years ago?
What has changed? Are the continents in different positions? Was there any kind of change in the sun?
You are the one who’s convinced that there has been such a huge change? So you should be able to list exactly what has changed to make the current warm periods different from the previous ones.
If you can’t, then you just admitted that you were lying again.
So Griff, again I ask you to explain, what caused the low levels over 100 years ago? And we know through science, which you alarmists selectively apply while accusing real scientists of being in denial of your faith based secular religion, we know this has been a cycle since time began.
So I ask again, what caused the previous cycles of warming and cooling and why now have those previous causes been nullified and replaced by Man burning fossil fuel to mitigate the affects of climate change?
You and your ilk neither have the knowledge or wherewithal to alter the forces of natural climate change by banning/limiting the use of fossil fuel or any other magically delicious schemes your mad political scientists dream up. You do run the risk of creating such an avalanche of unintended consequences as to cause the villagers to rise up with torches and pitchforks and burn you an your evil CAGW Clerics at the stake.
I might add that this isn’t just about extent… by all measures, the arctic sea ice is in serious decline..
volume, thickness, age, % old ice… all in decline.
And? Did you have a point? Would you prefer glaciation?
Like most warmunists, griff seems to believe that prior to man, the climate never changed and because of this the environment has no ability to adapt to change.
In their minds, even minor changes risk the death of all life on earth
No Griff, it WAS IN decline. Neither extent , area or volume show a decline over the last 13 years. So your “serious decline” is so serious that it stopped happening in the year Al Gore and IPCC got everyone crapping themselves about it’s imminent disappearance. Al Gore effect, ice version.
Traumatised individuals and climate alarmists seem to pop out the Arctic ice decline every 5 years or so when they get an annual blip which tickles their bias confirmation nerve. If you look at figure 2 above you will see it has been essentially flat since 2007.
ice volume ? The only real measurement we have of ice volume is the purpose built Cryosat2:
http://www.cpom.ucl.ac.uk/csopr/seaice.php?show_cell_thk_ts_large=1&ts_area_or_point=all&basin_selected=0&show_basin_thickness=0&year=2019&season=Spring&imonth=4&thk_period=28
Note that UCL who are in charge of the CPOM data are so concerned that their graph has not been updated for the 18 MONTHS. I guess they’re all too busy “working from home”.
Greg October 31, 2020 at 2:53 am
No Griff, it WAS IN decline. Neither extent , area or volume show a decline over the last 13 years.
PIOMAS shows ice volume ~12,000 km^3 at this data in 2002, it’s now showing ~5,000km^3.
Indicates significant loss of thicker, older ice, leading to more fragile ice cover, more susceptible to loss in summer.
PIOMESS is a gravity based measurement over a known volcanic region.
take it with a grain of salt.
Really?
Wrong one.
Piomess is based on “Climate Modelsᴸᴼᴸ”
So even more worthless. !
What are you doing about it?
He’s doing a lot of whining about how other people have to suffer.
In other words, he’s doing the standard progressive chant.
“the arctic sea ice is in serious decline..”
WRONG AGAIN griff.
Hasn’t changed much in the last 15 or so years
Current levels are far higher than for most of the last 10,000 years
The highly beneficial RECOVERY slightly towards more normal Holocene extents has been great for all life in the Arctic
Did you that…
Not only is the land surface GREENING, but the seas are also springing BACK to life after being TOO COLD and frozen over for much of the last 500 or so years (coldest period of the Holocene)
The drop in sea ice slightly toward the pre-LIA levels has opened up the food supply for the nearly extinct Bowhead Whale, and they are returning to the waters around Svalbard.
https://partner.sciencenorway.no/arctic-ocean-forskningno-fram-centre/the-ice-retreats–whale-food-returns/1401824
The Blue Mussel is also making a return, having been absent for a few thousand years, apart from a brief stint during the MWP.
https://journals.sagepub.com/doi/abs/10.1177/0959683617715701?journalCode=hola
Many other species of whale are also returning now that the sea ice extent has dropped from the extreme highs of the LIA. Whales cannot swim on ice. !
https://blog.poseidonexpeditions.com/whales-of-svalbard/
Great thing is, that because of fossil fuels and plastics, they will no longer be hunted for whale blubber for lamps and for whale bone.
BE VERY HAPPY for ARCTIC SEA LIFE, griff.
btw..
Do you have any evidence at all that the highly beneficial drop in Arctic sea ice from the extreme highs of the LIA and late 1970s has any human causation ?
the arctic sea ice is in serious decline..
More LIES from the Arctic sea life hater
No decline in MASIE data .
And as shown above current sea ice level are only a TINY bit down from the EXTREME HIGH extents of the LIA and late 1970s.
And as griff know, this is totally down to the SUN, NATURAL VARIABILITY and ocean cycles.
He cannot produce one bit of evidence of any human causation.
Hey griff,
did you know that the gain during October has been FAR MORE in the last several years, than in the 1980s?
Or were you ignorant about that as well ?
You really are getting DESPERATE, and looking more and more ignorant with each post.
…its quite laughable 🙂
Please keep going. Display your hatred of Arctic sea life for all to see.
griff, please share your pearls of wisdom about Antarctic sea ice. Pretty please.
Last time I looked my planet had two poles. Antarctic sea ice has been particularly robust this year. Do you find this inconvenient Griff?
Well, so inconvenient that he can’t respond, despite his syndrome wanting him to take a verbal kicking. It’s what it does. Ask Greta.
Even if this were true, a big so what?
Why is having access to trillions of dollars of resources such a bad thing?
Yet griff, what of that dreaded sea rise. Those politicians’ beach front property still stands high and dry. Obama hasn’t been driven back to Chicago from his $15 Million beach front property on Martha’s Vineyard despite all that sea ice melting.
He speechifies the coming end of days yet spends millions on beach front property and still you look but don’t see that it is all a massive globalist flim flam.
Thanks Dave, in particular the figure 16 graph.
The grand scale of things helps avoid cherry picking and incorrect assumptions.
Figure 16 would be a real downer for the likes of griff and loy.
Except that neither has the capability to understand it.
Where is Griff? See also ancient map of Antarctica that is surprisingly accurate considering we’ve only found out what it looks like ice free in the last few years…
The Piri Ries map ?? That map was not “Antarctica” , that’s cobblers. It was a very badly draw map of the coast of S. Am.
I suggest you get the map and try to follow the coast and identify the ins and outs of the coast, estuaries etc. and work out that against a modern map. Bear in mind they were just following the coast and the map projection is not what we are familiar with using today.
The bump you are probably thinking is in the middle of Antarctica by modern projections is the beginning of Cape Horn; the large island to the left of it is what is now the Falkland Islands.
The map is quite good down as far as Uraguay , but then there is a lot of artful “filling in the blanks” of their map fragments with random, typically coast-like wiggles. You know, like we thought we knew all about Jupiter until we sent Juno probe and found it was all wrong or badly off.
Most people claiming this is Antarctica are naively going by position because it is at the bottom of the map where we would place it now. Remember this is not mercator projection !
This map is certainly interesting but you need to apply a little more intelligent analysis that the average flat earther would. Sadly that is the level of most commentary about this map.
A quick [Ctrl F] search on “IPCC” turns up nothing. Be that as it may, I’m posting this
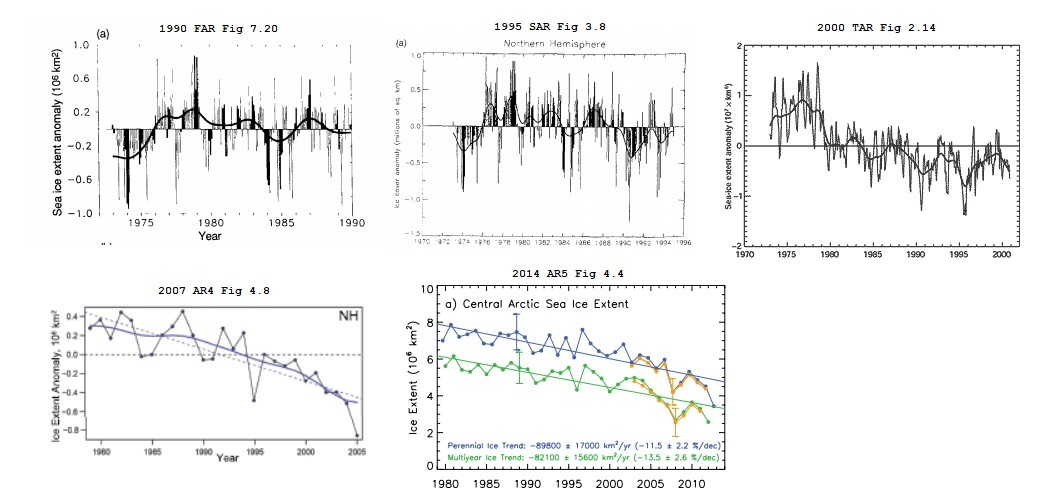
to illustrate how the IPCC has manipulated the northern sea ice extent over the years.
Interesting. Not as manipulated as it appears if you note the part of the record shown at each stage. Most of the melting occurred from 1997 to 2007, so earlier reports are fairly flat.
One notable change is the disappearance of the early 70s dip. I’d guess the excuse for that is was not the same full coverage we have form 1978 on with modern satellite coverage.
The important thing to note is that the whole catastrophic scam is based on a melting period of only ten years. The now 13 y of relatively stable new lower coverage is ignored in any alarmist discussions.
What I find interesting is, even if “Had the sea ice continued to expand as it was from 8,000 years ago up until the mid-19th century, this would still be the climate crisis du jour”, I would suspect the “solution” being touted would be the same….tax the crap out of energy and implement worldwide communism.
Sounds to me more like a solution in search of a problem.
Mmm, if only the solution was to emit more CO2 rather than less.
Just recently Keneth Richard at Notricks has also been looking at recentpapers on the sea ice in the Holocene:
https://notrickszone.com/2020/10/29/3-more-new-studies-show-modern-arctic-sea-ice-extent-is-greater-than-nearly-any-time-in-the-last-10000-years/
Some comments by KR on the papers reviewed:
-“For years scientists have been using biomarker evidence (IP25, PIP25) to reconstruct the Arctic’s sea ice history. The evidence shows modern (20th-21st century) Arctic sea ice is at its greatest extent since the Holocene began.
Scientists (Wu et al., 2020) have determined that from about 14,000 to 8,000 years ago, when CO2 lingered near 250 ppm, the Beaufort Sea (Arctic) was “nearly ice free throughout the year” (0.8 PIP25) for all but 1-2 summer months in the modern (1988-2007) era.”-
-“Interestingly, another study of this same Beaufort Sea region (Durantou et al., 2012) revealed the late 1800s to 1930s were up to 3°C warmer than the late 20th and early 21st century averages and sea ice was present for 1.1 fewer months per year during these earlier periods.”-
-“Another new study (Allaart et al., 2020) concludes that from around 10,000 to 5,000 years ago, Arctic Svalbard (Wijdefjorden) glaciers had retreated many km further back than their modern positions. And the smaller ice caps had “disappeared” from the region.
In contrast, during the last 500 to 700 years Svalbard sea ice has expanded to its highest extent of the Holocene (11,700 years ago to present).
The Holocene’s sea ice maximum just developed during modern times, as the authors note there has been an “increase in IP25 concentrations after c. 0.7±0.2 cal. ka BP, with a maximum in the modern sediments.” “-
Just exactly what is the downside of low summer arctic sea ice . The effect on polar bears is the main point made by the alarmists , but they (the bears not the alarmists ) hunt when the ice is just moving away from maximum and the chart shown above by David suggests that the decline in the winter/spring months is far les than that of summer ice.
I am assuming that the main prey of the bears is the ringed seal which pups on ice , but that is only one of six species of arctic seal.
“-“Interestingly, another study of this same Beaufort Sea region (Durantou et al., 2012) revealed the late 1800s to 1930s were up to 3°C warmer than the late 20th and early 21st century averages and sea ice was present for 1.1 fewer months per year during these earlier periods.”-”
Gotta love it! It was warmer in the recent past, with less CO2 in the atmosphere, than it is today, with more CO2 in the atmosphere.
Which means CO2 is a minor player in the Earth’s atmosphere and is not the control knob of the atmosphere.
Detailed research from the Russian Arctic:
‘We present a time series of sea ice extent in the Russian Arctic based on observational sea ice charts compiled by the Arctic and Antarctic Research Institute (AARI). These charts are perhaps the oldest operational sea ice data in existence and show that sea ice extent in the Russian Arctic has generally decreased since the beginning of the chart series in 1933. This retreat has not been continuous, however. For the Russian Arctic as a whole in summer, there have been two periods of retreat separated by a partial recovery between the mid‐1950s and mid‐1980s. The AARI charts, combined with air temperature records, suggest that the retreat in recent decades is pan‐Arctic and year‐round in some regions, whereas the early twentieth century retreat was only observed in summer in the Russian Arctic. The AARI ice charts indicate that a significant transition occurred in the Russian Arctic in the mid‐1980s, when its sea ice cover began to retreat along with that of the rest of the Arctic. ‘
https://agupubs.onlinelibrary.wiley.com/doi/full/10.1029/2008JC004830
So paper wraps stone?
I think you’ll find that the sharp knife of David’s logic honed on the whetstone of geology shreds paper.
“Russian Arctic has generally decreased since the beginning of the chart series in 1933.”
LOL……. so a LONG before any possible human CO2 influence
You are such a putz, griff. !
Yes we KNOW that the LIA was a time of extreme high sea ice.
and we KNOW that it has recovered slightly since then.
US DOE charts show other parts of the Arctic…
And Russian scientists produced this reconstruction…
If you are saying that there was not a dip to the 1940s then a rise back up to extreme LIA levels of Arctic sea ice around 1980, then you are saying that temperatures don’t affect sea ice, and your whole idiocy falls apart anyway…
Either way, Figure 16 shows just HOW LITTLE drop there has actually been compared to most of the last 10,000 years.
Too hard for you to comprehend though, isn’t it, poor griff. !
“whereas the early twentieth century retreat was only observed in summer in the Russian Arctic.”
RUBBISH.
Observed by DOE
Also observed in 1922
While the gain in sea ice to the late 1970s extreme high was also observed
quote Nov 1976 “Sea ice has returned to Iceland coasts after more than 40 years of virtual absence……… Glaciers in Alaska and Scandinavia have slowed their recession, some in Switzerland have begun advancing again
oops….. second link was a repeat.
Read section titled “The Changing Arctic”
Great that you have shown there is absolutely NO relationship to atmospheric CO2 , griff.
Were you dumb on purpose? !
Or is it just NATURAL, like the warming from the coldest period in 10,000 years.
Why is the “average” ice extent metric still based on 1981-2010? Surely, if there is insistence that a 30-year average is the metric to use, it should either be frequently revised to maintain its relevance or, better still, abandon the 30-year figure and just extend it, to “35-year average”, then “40-year average”. Could it be that they are so entrenched in the 1981 base as that was the year when Arctic sea-ice was anomalously high, thus always giving the impression that sea-ice is declining? Satellite measurements of the poles started around 1973; if you use that as your base, then the Arctic sea-ice levels are not really that much different.
“Could it be that they are so entrenched in the 1981 base as that was the year when Arctic sea-ice was anomalously high, thus always giving the impression that sea-ice is declining?”
YEP, that is exactly why.
griff has now switch to the even stupider LIA extents as his reference.
SO DUMB !!!
David,
Fascinating chart of Standard Oil and descendants. But I still miss the Mobile Economy Run. They were years ahead of their time. EM should bring it back, but unaccompanied by climate scare propaganda.
Why not display the graoph from the 1990 IPCC Report which shows a low point in the 1970’s.
We need to entertain Griff and Loydo.
You mean this one ??
Three issues. First, establish a baseline in the near frame and separately looking forward, looking backward through inference. Two, determining the normal system distribution: median and variance in time and space, and how to characterize male and female humans in this context. Three, assuming that the observed trends are persistent, is a warmer, greener Earth a desirable outcome. Many argue that it is not, and that the environment would be better if the system was colder and Greener (i.e. grayer).
David
” We really [need] some context and scale here.”
I knew I missed something… D’oh!
David
You remarked, For that matter, we still don’t know which is the true anomaly: …” It is known that polar bears have the ability to swim for hundreds of miles. Would they have evolved with that capability if their environment was perennially frozen? With their webbed feet, they are obviously adapted to spending much of their time swimming, rather than always crashing through the snow cover to get to young seals in their dens. I would suggest that polar bears have always inhabited an environment with a great deal of open water for at least part of the year. Those bears that couldn’t swim well ended up being out-reproduced by bears that could. I think that addresses which is the true anomaly.
Yep. If polar bears evolved 180,000 years ago to specifically occupy a habitat niche that hasn’t existed over most of their natural history, they don’t exist.
😎
David Middleton, deep gratitude for an excellent scientific study.
Work like yours makes WUWT continue to sit in the top ranks of intelligent blogs and investigative scientific research. The scientific method par excellence.
Trolls are taken care of handily by the crew of brilliant commenters. Honest differences of scientific opinion often appear, too, with interesting illuminations. However, the “honest” element appears to be far and few between these days.
Thanks, Anthony for WUWT
Retired geologist Roger Higgs has developed a view on the climate change theory from his professional expertise now that he does not have external pressures to conform to the “consensus”.
https://www.researchgate.net/publication/341622566_IPCC_three_pillars_of_man-made_global_warming_collapsed
He also notes a distinct lack of geologists contributing to the next IPPC report.
https://www.researchgate.net/publication/331974185_IPCC_next_climate_assessment_report_AR6_due_2022_-_784_authors_but_again_no_geologists
To anyone frightened of diminishing Arctic sea ice, or Antarctic sea ice, or Greenland ice cap ice, or mountain glacier ice, please do a search and some reading on ‘latitudinal gradients in species diversity’. I can predict the conclusions from doing this of an open and scientific mind, but not of a closed and alarmist one.
When one has spent a career personally dating rocks from the Juneau Icefields at 900 million years, from mining silver in a Jurassic vein system, and to whom ‘surficial geology’ includes realizing that the Rocky Mountain Cambrian rocks were an un-eroded boring high plain in the Miocene–a few tens to thousands of years of ice-cover oscillations is just so incredibly insignificant.
All Dave tried to do was to present some perspective so people could ‘get a grip’. Note those on whom the message seems lost, it changes nothing. And I have no idea what can be done about this.
In the Jerry Brown regime this would have been good for about 12 miles of high speed rail funding, maybe. That pretty well sums up the role of climate change in the political realm. How much money is in it for me and my special interest groups (unions, Sierra Club donors, and extra share of the Federal funding programs).
Arctic Sea Ice? Let’s see what a real expert had to say, a man who actually went there and made observations and measurements:
Nansen F. Farthest North: Being the Record of a Voyage of Exploration of the Ship “Fram” 1893–96
Nansen, Schmansen! Measurements, schmeasurements!
All that matters is the consensus of expert opinion whose livelihoods depend upon the consensus.
Nansen was so late 19th century!
John,
And I am so late 20th Century …
My understanding of what Nansen was observing and describing is this:
1. First the snow melt water ponds form on the surface of the ice. (hence the boating lake).
2. Then this fresh water pond suddenly drained into the ocean below the ice through a hole at the base of the pond.
3. Nansen describes and measures a layer of fresh water floating on top of the salt water as being some 3 metres thick:
4. It is not absolutely clear if the 3 meter layer of fresh water is measured from the air surface or from the base of the ice ( I will assume from the air surface as his temperature profiles elsewhere show water temperatures as being below zero Celsius below the ice). However 3 metres of fresh water is thicker than the measured 2.57 metres of ice (then increased to 2.76 m). So, in this eventuality we have a skim of fresh water some 43 cm thick lying below the ice (2.57 + 0.43 = 3.00) this skim of fresh water then reduces to a skim of just 24 cm thick as the ice thickness augments (2.76 + 0.24 = 3.00).
5. N.B. Because of density differences the datum air/ice surface will be above datum air/water surface (the freeboard of the ice), so the accommodation space for the fresh water will be more than that of the floating ice.
6. Because the fresh melt water skim below the sea ice is in contact with the dense cold seawater (temp -1.5C ), the fresh is freezing at the base of the water column (not at the ice base). This process then forms mush ice which floats up through the fresh water skim (a form of reverse snow in water) to the base of the ice and then welds onto the solid ice above augmenting its thickness from the base as Nansen describes.
Field work beats computer models every day of the week and twice on holidays.
+10 Very interesting.
I love reading old record logs and scientific diary entries.
I highly recommend Scott’s diary that can be read online here : http://www.bl.uk/turning-the-pages/?id=12878b6a-36b9-44db-a940-365b21bfe524&type=book
Another, more modern history that I came across the other day, is the English version of a Soviet era debacle in the Arctic, concerning the good ship “Lenin”. Here is the abstract:
The Drift of Lenin’s Convoy in the Laptev Sea, 1937 – 1938
WILLIAM BARR
As a result of various miscalculations 25 ships underwent an enforced
wintering at various points in the Soviet Arctic in the winter of 1937-1938. Among the
vessels involved was a convoy of six ships led by the icebreaker Lenin, which spent the
winter drifting in the Laptev Sea. Several of the ships were severely damaged by ice
pressure, and one ship was crushed and sank. Early in 1938 all superfluous personnel were flown south to Tiksi in an emergency airlift operation. The author presents the
first detailed English-language account of this wintering.
http://pubs.aina.ucalgary.ca/arctic/Arctic33-1-3.pdf
Interesting article from Mr Middleton also.
David,
Thanks for another interesting post! I was wondering if you have any specific recommendations for geology texts and writings that would be good to add to my hidden cache of forbidden knowledge! I’m sure that the religious zealots like the griff and Loy-doh will want to burn all the books that contradict their dogma, and geological texts will probably be first on their list!
Basic geology textbook… An early edition (pre-1980) of The Earth by Press & Sister.
Press and Siever
(I bought it already on your advice.)
Great article, David.
And a lot of good comments.
Meanwhile Arctic ice extent is more or less back to normal
http://polarportal.dk/fileadmin/polarportal/sea/SICE_curve_extent_LA_EN_20201031.png
and the ice volume is in rude health
http://polarportal.dk/fileadmin/polarportal/sea/CICE_curve_thick_LA_EN_20201031.png
Yes Phil, the October growth has been more than most years in the 1980s.
The levelling-off at an extent and thickness far above the Holocene normal continues.
Just enough open Arctic sea for sea life to start returning after a long time absent due to the extreme levels of sea ice in the LIA and late 1970s.
https://partner.sciencenorway.no/arctic-ocean-forskningno-fram-centre/the-ice-retreats–whale-food-returns/1401824
https://journals.sagepub.com/doi/abs/10.1177/0959683617715701?journalCode=hola
Unfortunately, there are those that really HATE the idea of Arctic sea life being able to swim and feed freely again…
Sad, but true. 🙁
Phil Salmon November 1, 2020 at 3:08 pm
Meanwhile Arctic ice extent is more or less back to normal
http://polarportal.dk/fileadmin/polarportal/sea/SICE_curve_extent_LA_EN_20201031.png
Back to normal? That graph shows it’s the lowest ever for the date, not normal!
and the ice volume is in rude health
http://polarportal.dk/fileadmin/polarportal/sea/CICE_curve_thick_LA_EN_20201031.png
Rude health? It shows second lowest ever and about 3,500 km^3 below average.
“Back to normal? That graph shows it’s the lowest ever for the date, not normal!
NO , your ignorant twit
Normal for the Holocene is MUCH LOWER than current levels
The ANOMALY was the extreme highs of the LIA and late 1970s
Are you capable of learning any basic facts at all,
or is climate change DENIAL brain-washed into what used to be your mind.
fred250 November 1, 2020 at 11:03 pm
“Back to normal? That graph shows it’s the lowest ever for the date, not normal!
NO , your ignorant twit
Normal for the Holocene is MUCH LOWER than current levels
“That graph” refers to 1981-2000, it does not refer to the Holocene.
So what.
1979 was the EXTREME high.
Why would anyone with an open mind look at a period just after the HIGHEST EXTENT since the LIA and think it was “normal”. That is abnormal, twisted, dumb etc
Normal sea ice extent is FAR LOWER than current levels
Close your mind little philp and leave it closed…..
Only way you can protect you religious based idiocy is by rabid climate change denial.
fred250 November 2, 2020 at 11:44 am
So what.
1979 was the EXTREME high.
Why would anyone with an open mind look at a period just after the HIGHEST EXTENT since the LIA and think it was “normal”. That is abnormal, twisted, dumb etc
Normal sea ice extent is FAR LOWER than current levels
Phil Salmon chose the data we are discussing so unlike you I commented on that data. Your tactic is usually to ignore the matter under discussion and introduce something totally different.
YAWN,
Climate Change DENIAL is deeply ingrained in your little mind, isn’t it Phlip
You just cannot allow yourself to accept the FACT that current levels of Arctic sea ice are FAR higher than for most of the last 10,000 years
DENY, DENY, DENY.. so funny watching you twist yourself into a mindless pretzel. !
https://notrickszone.com/2020/10/29/3-more-new-studies-show-modern-arctic-sea-ice-extent-is-greater-than-nearly-any-time-in-the-last-10000-years/
Perhaps if you concentrated on actual SCIENCE instead of brain-fed mantra, you might look less of a mindless zealot.
fred250 November 3, 2020 at 3:30 am
You just cannot allow yourself to accept the FACT that current levels of Arctic sea ice are FAR higher than for most of the last 10,000 years
It isn’t a fact, it’s an exaggeration, and irrelevant to the subject under discussion but you always have to drag it in.
Arctic sea ice extent is FAR ABOVE the level it has been for MOST of the last 10,000 years
Cover your ears, close your eyes and go la-la-la.
That way the FACTS won’t penetrate your thick empty skull. !
Sad and very pathetic
You have gone from DUMB to DUMBER.. and way past DUMBEST
….. and you just keep going.
Its most hilarious .. 🙂
One day you will wake up and realise what an arrant FOOL you are
LIA and late 1970s were EXTREME outliers
The Arctic is all the better for the RECOVERY back slightly towards the much lower Holocene norm
Not only is the land surface GREENING, but the seas are also springing BACK to life after being TOO COLD and frozen over for much of the last 500 or so years (coldest period of the Holocene)
The drop in sea ice slightly toward the pre-LIA levels has opened up the food supply for the nearly extinct Bowhead Whale, and they are returning to the waters around Svalbard.
https://partner.sciencenorway.no/arctic-ocean-forskningno-fram-centre/the-ice-retreats–whale-food-returns/1401824
The Blue Mussel is also making a return, having been absent for a few thousand years, apart from a brief stint during the MWP.
https://journals.sagepub.com/doi/abs/10.1177/0959683617715701?journalCode=hola
Many other species of whale are also returning now that the sea ice extent has dropped from the extreme highs of the LIA. Whales cannot swim on ice. !
https://blog.poseidonexpeditions.com/whales-of-svalbard/
Great thing is, that because of fossil fuels and plastics, they will no longer be hunted for whale blubber for lamps and for whale bone.
Hopefully the Arctic doesn’t re-freeze too much in the next AMO cycle, and these glorious creatures get a chance to survive and multiply.
Don’t be a HATER of Arctic sea life, even if you do hate your own existence.
And don’t be a rabid DENIER of climate change history.
fred250,
Here is the link to Farthest North Nansen’s account of the Voyage of the Fram: Chapter 5 Voyage through the Kara Sea.
The Fram was deliberately frozen into the ice floe in the Laptev Sea on 25th September 1894.
The sounding shows that the Fram was off the shelf edge of the Laptev Sea in deep water at by my estimate longitude circa 113E.
Correction 25th September 1893.
Yep, a lot of sea ice up there during the LIA and late 1970s.
Anomalously high extents. No room for much sea life.
There are some people how actually think these huge extents of sea ice are “normal” and “desirable”…. locking Arctic sea life out of their 10,000 year of feeding grounds.
They care more about sea ice, than they do about actual sea LIFE.
Sad, but true.
ICE in the arctic increased 441.000 square kilometers over the weekend.
Rapid gains today too, now above 2016 levels in NSIDC.
Pity , Arctic sea life will get squeezed out again from these high sea ice levels.