
| NOAA Claims: Persistent drought dominates the Western landscape October 15, 2020 NOAA’s winter forecast for the U.S. favors warmer, drier conditions across the southern tier of the U.S., and cooler, wetter conditions in the North, thanks in part to an ongoing La Nina. Forecasters at NOAA’s Climate Prediction Center – a division of the National Weather Service – are also closely monitoring persistent drought during the winter months ahead, with more than 45% of the continental U.S. now experiencing drought. “NOAA’s timely and accurate seasonal outlooks and short-term forecasts are the result of improved satellite observations, more detailed computer forecast modeling, and expanding supercomputing capacity,” said Neil Jacobs, Ph.D., acting NOAA administrator. “From expansive and multi-hazard winter storms to narrow but intense lake effect snow, NOAA will provide the necessary information to keep communities safe.” Currently, large areas of drought extend over the western half of the U.S., with parts of the Northeast also experiencing drought and near-record low stream flows. With a La Nina climate pattern in place, southern parts of the U.S. may experience expanded and intensifying drought during the winter months ahead. “With La Nina well established and expected to persist through the upcoming 2020 winter season, we anticipate the typical, cooler, wetter North, and warmer, drier South, as the most likely outcome of winter weather that the U.S. will experience this year,” said Mike Halpert, deputy director of NOAA’s Climate Prediction Center. Temperature The greatest chances for warmer-than-normal conditions extend across the Southern tier of the U.S. from the Southwest, across the Gulf states, and into the Southeast. More modest probabilities for warmer temperatures are forecast in the southern parts of the west coast, and from the Mid-Atlantic into the Northeast. Above-average temperatures are also favored for Hawaii and western and northern Alaska. Below-normal temperatures are favored in southern Alaska and from the northern Pacific Northwest into the Northern Plains, with equal chances for below-, near- or above-average temperatures in the remaining regions.  Precipitation Wetter-than-average conditions are most likely across the northern tier of the U.S., extending from the Pacific Northwest, across the Northern Plains, Great Lakes, and into the Ohio Valley as well as Hawaii and northern Alaska. The greatest chances for drier-than-average conditions are predicted in the Southwest, across Texas, along the Gulf Coast, and in Florida. More modest chances for drier conditions are forecast in southern Alaska, and from California across the Rockies, Central Plains, and into the Southeast. The remainder of the U.S., including the Mid-Atlantic and Northeast falls into the category of equal chances for below-, near-, or above-average precipitation. Precipitation Wetter-than-average conditions are most likely across the northern tier of the U.S., extending from the Pacific Northwest, across the Northern Plains, Great Lakes, and into the Ohio Valley as well as Hawaii and northern Alaska. The greatest chances for drier-than-average conditions are predicted in the Southwest, across Texas, along the Gulf Coast, and in Florida. More modest chances for drier conditions are forecast in southern Alaska, and from California across the Rockies, Central Plains, and into the Southeast. The remainder of the U.S., including the Mid-Atlantic and Northeast falls into the category of equal chances for below-, near-, or above-average precipitation.  Drought Widespread, ongoing drought is currently in place across the western half of the continental U.S. as a result of the weak Southwest summer monsoon season and near-record high temperatures. Drought is also present in parts of the Northeast, Ohio Valley, Hawaii, and Alaska. The ongoing La Nina is expected to expand and intensify drought across the southern and central Plains, eastern Gulf Coast, and in California during the months ahead. Drought conditions are expected to improve in the northern Rockies, Northwest, New England, Alaska, and Hawaii over the coming months. Drought Widespread, ongoing drought is currently in place across the western half of the continental U.S. as a result of the weak Southwest summer monsoon season and near-record high temperatures. Drought is also present in parts of the Northeast, Ohio Valley, Hawaii, and Alaska. The ongoing La Nina is expected to expand and intensify drought across the southern and central Plains, eastern Gulf Coast, and in California during the months ahead. Drought conditions are expected to improve in the northern Rockies, Northwest, New England, Alaska, and Hawaii over the coming months.  NOAA’s seasonal outlooks provide the likelihood that temperatures and total precipitation amounts will be above-, near- or below-average, and how drought conditions are favored to change. The outlook does not project seasonal snowfall accumulations as snow forecasts are generally not predictable more than a week in advance. Seasonal outlooks help communities prepare for what is likely to come in the months ahead and minimize weather’s impacts on lives and livelihoods. Empowering people with actionable forecasts and winter weather safety tips is key to NOAA’s effort to build a more Weather-Ready Nation. NOAA’s Climate Prediction Center updates the three-month outlook each month. The next update will be available November 19. |
Just made a note to self – check roof and heating system, make sure there are plenty of outdoor plant covers. I live in Tucson; looks like a wet and cold winter on its way…
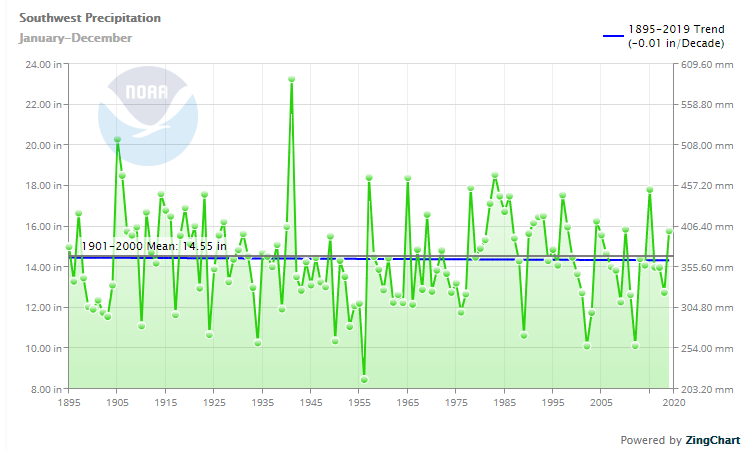
NOAA’s Climate at a Glance doesn’t 1895-2020 doesn’t show any appreciable decrease in precipitation for the Southwest:
From the article: “The greatest chances for drier-than-average conditions are predicted in the Southwest, across Texas, along the Gulf Coast, and in Florida.”
And we can see why this is the case as the jet stream is moving across the U.S. from west to east, with those north of the jet stream experiencing cooler, wetter weather, and those south of the jet stream experiencing warmer and drier weather.
https://earth.nullschool.net/#current/wind/isobaric/500hPa/orthographic=-84.37,37.02,595
Cold winter. Must be climate change.
d, you could post a spew warning, just out of kindness. I was about to dive into a cup of hot cocoa.
Yes. Sometimes CO2 conspires to push the jet stream south, which results in a cold winter. This is climate change, because the US has never had cold winters before. Sometimes, however, CO2 moves its attention and machinations elsewhere, such as when it heats water under the ice in West Antarctica, or causes arid, fire prone parts of the planet to experience fire after electrical wires or gender reveal explosions ignite dry grass. With CO2 thus distracted, the jet stream is able to stay further north, as is only proper, and this allows the US to experience warm winters, which it never had before. Warmer US winters are global warming. All of these phenomena were predicted accurately by scientists and soothsayers several hundred years ago, and the evidence at this point is approximately 97% stronger than the law of gravity. Everyone knows this, and the only thing left to debate are the details.
Yea, just like I said before: La Niña, Bad Girl, Bad Girl, where you going to run when they come for you? COPS was filmed before a live audience. All of these losers are guilty but lawyers advise us to pretend otherwise.
Looks exactly like Bastardi’s/D’Aleo’s WeatherBell forecast.
I don’t know about the wetter than normal for Michigan. Where I am in central lower we have been dry since July.
Meteorological winter includes December, January, and February.
Not talking abut July 2020.
If NOAA forecasts a mild winter, you can be pretty sure it’s gonna be a cold one, at least east of the Rocky Mnts.. The models purposely don’t do cold.
Brief Introduction to Stratospheric Intrusions

Stratospheric Intrusions are when stratospheric air dynamically decends into the troposphere and may reach the surface, bringing with it high concentrations of ozone which may be harmful to some people. Stratospheric Intrusions are identified by very low tropopause heights, low heights of the 2 potential vorticity unit (PVU) surface, very low relative and specific humidity concentrations, and high concentrations of ozone. Stratospheric Intrusions commonly follow strong cold fronts and can extend across multiple states. In satellite imagery, Stratospheric Intrusions are identified by very low moisture levels in the water vapor channels (6.2, 6.5, and 6.9 micron). Along with the dry air, Stratospheric Intrusions bring high amounts of ozone into the tropospheric column and possibly near the surface. This may be harmful to some people with breathing impairments. Stratospheric Intrusions are more common in the winter/spring months and are more frequent during La Nina periods. Frequent or sustained occurances of Stratospheric Intrusions may decrease the air quality enough to exceed EPA guidelines.
NOAA: Winter may be cold and wet.
How much does this cost, again?
I would like to see Joe Bastardi’s take on this.
Here is WB’s end-August 2020 Winter Forecast.
https://www.weatherbell.com/winter-2020-21-outlook
“WeatherBELL will be updating our winter outlook by the end of September. To receive it in real time or to receive the quantitative Heating Degree Day forecast for the November to March period, please email us at sales@weatherbell.com“
Okay, I’m dusting off the heavy winter coat collection for the middle of the country in the “worse than they said but right on the basic La Nina template” scenario. That follows along with the “financial crisis will be a little bit worse than normal” and the “pandemic might cause a little bit of inconvenience on travel and restaurants” …..don’t ya know.
And if you want to really know with some insights and useful information you need to pay for it like WS does.
Of course if it is much worse than the milk toast free forecast, you know what to blame.
I think there might be a hoarding opportunity here with snow shovels and pipe warmer kits.
Look out Missouri, Kentucky, Tennessee, and others. You can’t sue NOAA for winter forecasts but there might be an opportunity to claim Climate Justice money if you suck up enough.
How accurate habe the NOAA forecasts been in the past?
Based on the heavy crop of acorns in my backyard, I expect a cold winter here in North Carolina.
Like some of us have been saying for months, expect the climate alarm narrative to switch from global average bbq to “drought”, “polar vortex”, and probably some more “climate weirding” for good measure. Looks like the strongest La Nina since 2011, the trade winds are currently roaring and there is a lot of cold pool in the undercurrent with possibly more forming, how low will global temps go by April?
La Nina sucks, but at least Aussies will get a reprieve from the drought.
Yep we should be able to have a nice wet to build those fuel loads up to burn them all down again in a couple of years if nothing changes.
Uummmm . . . NOAA, thank you for this forecast, but I think I better wait until next month when it’s sure to be significantly revised . . . and then the month after that . . . and then the month after that . . .
By NOAA’s own words: “A seven-day forecast can accurately predict the weather about 80 percent of the time and a five-day forecast can accurately predict the weather approximately 90 percent of the time. However, a 10-day—or longer—forecast is only right about half the time.” — source: NOAA’s SciJinks webpage at https://scijinks.gov/forecast-reliability/#:~:text=The%20Short%20Answer%3A,90%20percent%20of%20the%20time.&text=Since%20we%20can't%20collect,assumptions%20to%20predict%20future%20weather.
So on the basis of NOAA’s figures, for forecasts over 10 days you would do just as well by tossing a coin. And you might improve the success rate by looking out of the window and thinking, “Does it really look like we are going to have XXX in a fortnight?”
And the predicted success rate over 80 years to the end of the century?
Has anyone ever done an overlay of forecast maps compared to what actually transpired ?
I know they are trying really hard to get it right, what is the success rate ?
When you make a forecast it terms of probability of above or below normal, you cannot be wrong no matter what happens as long as you avoid 100% and 0% predictions. Even better, make sure you don’t specify what normal is in quantitative terms. I like how they claim their forecast is accurate – something that is only possible to determine after the season is over.
Tony Heller has done this a bunch
realclimatescience.com
Kind of reflects the forecast from both almanacs, so I won’t worry about it. Just make sure the pantry, fridge and freezer are stocked and the battery-driven stuff is charged regularly. And lamp oil – gotta have that on hand, that, and bird food. And squirrel food.
When you live in a locale of extremes, aritmetic mean is rarely “average”. Here in central california we are a desert with long bouts of no rain and large rainfall events. For example last year we had half of our annual rain fall between t-day and x-mas. When that happens we usually have a dry spring, and late jan through beginning of march was,true to form, very dry. But from march through early may we had nice consistent light rain. Which led to a late, heavy growth of grass. Guess what happened when we had a summer lightning storm? Long years of drought do NOT lead to a lot of wildfires because things don’t grow without water. Short intense drought followed by cycles of water that let things grow rapidly before dying in the summer heat othe other hand…..
Based on this forecast I will cancel the snow blower order and stop cutting and splitting firewood.
– – winking smiley face – – Poe’s Law
Meanwhile arctic sea ice and area still at lowest for date, over a month since minimum.
Must be heat piracy from the southern hemisphere
It looks similar to 2019
http://nsidc.org/arcticseaicenews/files/1999/10/Figure-2a.png
“Meanwhile arctic sea ice and area still at lowest for date”
That is GREAT NEWS, griff…
…. even if it is such a piddlingly small period and amount since the extremes of the 1970s.
You should be REJOICING the RECOVERY of Arctic sea life now that the sea ice is getting back ever so slightly to pre-Little Ice Age extents (still a long way to go, though)
Not only is the land surface GREENING, but the seas are also springing BACK to life after being TOO COLD and frozen over for much of the last 500 or so years (coldest period of the Holocene)
The drop in sea ice slightly toward the pre-LIA levels has opened up the food supply for the nearly extinct Bowhead Whale, and they are returning to the waters around Svalbard.
https://partner.sciencenorway.no/arctic-ocean-forskningno-fram-centre/the-ice-retreats–whale-food-returns/1401824
The Blue Mussel is also making a return, having been absent for a few thousand years, apart from a brief stint during the MWP.
https://journals.sagepub.com/doi/abs/10.1177/0959683617715701?journalCode=hola
Many other species of whale are also returning now that the sea ice extent has dropped from the extreme highs of the LIA. Whales cannot swim on ice. !
https://blog.poseidonexpeditions.com/whales-of-svalbard/
Great thing is, that because of fossil fuels and plastics, they will no longer be hunted for whale blubber for lamps and for whale bone.
Do you really HATE Arctic sea life so much that you want it to continue to be driven away by extreme cold and sea ice ???
…while the Antarctic does the opposite again.
Griff, how long is your record?
That is a good thing isn’t it we have new land for settlement for all the climate refugees. Until the polar bears hurry up an go extinct the refugees will need to be fast runners.
“NOAA’s timely and accurate seasonal outlooks and short-term forecasts are the result of improved satellite observations, more detailed computer forecast modeling, and expanding supercomputing capacity,” said Neil Jacobs, Ph.D., acting NOAA administrator.
The use of the term “accurate” without any modifier is misleading (I assert it is intentional). The measure of weather forecasts is via a “skill score” which gives a nuanced measure of how a good any particular forecast might be based on analysis of previous forecasts.
From the Climate Prediction Center:
“The term “skill” in reference to forecasts means a measure of the performance of a forecast relative to some standard. Often, the standard used is the long-term (30-year) average (called the the climatology) of the parameter being predicted. Thus, skill scores measure the improvement of the forecast over the standard.
CPC uses the Heidke skill score, which is a measure of how well a forecast did relative to a randomly selected forecast. A score of 0 means that the forecast did no better than what would be expected by chance. A score of 100 depicts a “perfect” forecast and a score of -50 depicts the “worst possible” forecast. The dashed lines in the skill graph indicates the average skill score for all forecasts and for “Non-CL” forecasts. “CL” refers to climatology or a forecast of equal chances of Above, Near Normal, and Below Normal temperature or precipitation. “Non-CL” refers to all forecasts where enhanced above normal or enhanced below normal temperatures or precipitation are predicted. “Percent Coverage” is refers to the percent of the forecast region where enhanced above or below temperature or precipitation is predicted.”
A skill score for a specific forecast is not easily found…you have to decipher it from the following link:
https://www.cpc.ncep.noaa.gov/products/predictions/long_range/tools/briefing/mon_veri.grid.php
I found a quote from the CPC claiming a 40% skill score for seasonal outlooks…but I can find no such number in their actual skill score analysis link. The skill score varies tremendously on what part of the forecast is being referred to. For example, I input September 2020 and read (or I think I read) a skill score of about 4.53% for temperature, and 28.88% for precipitation. Note that reading the skill scores takes a bit of study, any I would welcome additional comment by those better versed…..
At any rate, the claim of “accurate” is very misleading, and I see no evidence that the seasonal forecasts are generally 40% accurate as claimed elsewhere. I would guess the 40% is cherry picked from a particular forecast and is probably for precipitation only.
And these folks (note the PhD) expect us to swallow this crap.
Ethan Brand
I found an additional skill score link…for seasonal forecasts:
https://www.cpc.ncep.noaa.gov/products/predictions/long_range/tools/briefing/seas_veri.grid.php
I input Dec Jan Feb 2018/2019. Results were -12.93 for temperature and 7.97 for precipitation. Refer to the above as how to interpret these skill scores. My analog interpretation…they are crap.
The claim by the CPC for 40% accuracy (assuming they are referring to the skill score) was supposed to be based on the last 4 years.
I input the last four Dec Jan Feb seasonal forecast for the past 4 seasons and come up with:
Temperature skill score 29.5
Precipitation skill score 8.5
No where near 40, and still pretty crappy.
I have tried to piece together a comparative skill score for the various seasonal forecasts…CPC (US), Canada, Europe, Weather Bell etc…with no real luck. My analog (ie educated guess) analysis is that they are all pretty worthless, but pretty much all claim they are “accurate”. Nonsense.
I welcome additional analysis and comment by those better versed that I.
Ethan Brand
Looks to be bog standard La Nina winter forecast with lots of added CO₂ caused warmth.
That is; a bog standard forecast recast in goofball percentages that are meaningless in forecasting long term weather.
Should improve when Ryan Maue takes charge at NOAA.