This new paper raises some questions about the role of total solar irradiance (TSI) and global warming. OTOH hand its all computer modeling, so take it with a grain of salt. h/t to Dr. Leif Svalgaard.
- The role of solar forcing in global warning is unclear due to the uncertainty in the change in TSI since the Maunder minimum.
- The TSI level of the Sun when it is in its least active state is established from an advanced model of TSI variability.
- This lower limit on grand minima TSI truncates the current range of the possible change in TSI since the Maunder minimum by more than half.
Abstract
How the solar electromagnetic energy entering the Earth’s atmosphere varied since pre industrial times is an important consideration in the climate change debate. Detrimental to this debate, estimates of the change in total solar irradiance (TSI) since the Maunder minimum, an extended period of weak solar activity preceding the industrial revolution, differ markedly, ranging from a drop of 0.75 W m−2
to a rise of 6.3 W m−2.
Consequently, the exact contribution by solar forcing to the rise in global temperatures over the past centuries remains inconclusive. Adopting a novel approach based on state-of23 the-art solar imagery and numerical simulations, we establish the TSI level of the Sun when it is in its least active state to be 2.0±0.7 W m−2 below the 2019 level. This means TSI could not have risen since the Maunder minimum by more than this amount, thus restricting the possible role of solar forcing in global warming.
Plain Language Summary
How the amount of energy the Earth receives from the Sun varied since pre-industrial times is an important consideration in the climate change debate. Detrimental to this debate, it is not known whether the Sun grew brighter or dimmer since the 16th century, and by how much. As a consequence, the exact contribution by fluctuations in the brightness of the Sun to the rise in global temperatures over the past centuries remains controversial. It is established that the Sun was particularly inactive over much of the 16th century. Adopting a novel approach based on state-of-the-art solar imagery and computer models, we determined the brightness of the Sun when it is in its least active state possible. This places a strict limit on how much the Sun could have grown brighter since the lull in solar activity over the 16th century, restricting the possible role the Sun could have played in global warming.
The paper:
So why would the quantum of the fall in TSI today’s minimum place a limit on the fall during the Maunder Minimum. What if the underlying rate of fusion reactivity was lower then compared to today
The time scale for changes in the fusion rate in the Sun’s core is millions of years.
Again, we also get energy from the Sun via the solar wind and Coronal Mass Ejections. It isn’t just light in varying frequencies and intensities. The solar wind and CME’s affect the Earth in many ways. Why are “climate scientists” so myopic? My forecast is the study of this will become a major part of climate science and meteorology in the coming years as more and more becomes known about the influences.
There can be a tendency to know more and more about less and less. Eventually, you arrive at a point where you know everything about nothing.
That was true before Planck. Bertrand Russell claimed just before we knew everything.
Now we know the world is quantized, so we can never know everything.
What’s about SPE pfu @ >10 MeV ?
I have no idea, if they may affect earth environment and if, how.
I don’t know, if these data are actual and the last SPE happend Sept. 2017
ftp://ftp.swpc.noaa.gov/pub/indices/SPE.txt
Again, we also get energy from the Sun via the solar wind and Coronal Mass Ejections
Heat content is temperature times mass. The total mass of matter from the sun, even if it’s very hot, is also extremely small, so heat content is very small & wouldn’t affect anything other than the thermosphere, tho it could expand the very tenuous thermosphere & cause increased drag on low-altitude satellites.
From NASA Cassini mission:
“New analysis of data from NASA’s Cassini spacecraft finds a viable explanation for what’s keeping the upper layers of Saturn, and possibly the other gas giants, so hot: auroras at the planet’s north and south poles. Electric currents, triggered by interactions between solar winds and charged particles from Saturn’s moons, spark the auroras and heat the upper atmosphere. (As with Earth’s northern lights, studying auroras tells scientists what’s going on in the planet’s atmosphere.) … New analysis of data from NASA’s Cassini spacecraft finds a viable explanation for what’s keeping the upper layers of Saturn, and possibly the other gas giants, so hot: auroras at the planet’s north and south poles. Electric currents, triggered by interactions between solar winds and charged particles from Saturn’s moons, spark the auroras and heat the upper atmosphere. (As with Earth’s northern lights, studying auroras tells scientists what’s going on in the planet’s atmosphere.) ”
https://www.jpl.nasa.gov/news/news.php?feature=7632
Ah… the forbidden words “Electric currents” coming from NASA. It seems that there is magnetohydrodynamic pumping of the atmosphere associated with auroral and ionospheric currents. This effects atmospheric circulation patterns. Lets see, what variables could be affected: global heat distribution, inductive heating, wind circulation, precipitation patterns, oceanic currents to name a few.
I suggest that more research is needed to illuminate this further.
Same issue with microwave and millimeter wave energy, is there a proxy for their historic strength? While their energy contributions might be low, what are the chemical reaction effects associated with their intensity levels?
More variation into the model …
It’s that hot, yellow ting in the sky that controls global temp. Whodathunkit?
The solar output/planet’s energy input is a periodical variable with number of periodicities; in addition there are other global periodicities sometime in the phase and sometime in a counter phase with the solar variability. Effect on the s.c. global temperature is a total sum of all contributing to the rise or fall in the temperature at any point in time.
So what might be effect of another ‘Grand Minimum’ that some solar researchers predict in the near future?
Well, it depends on time of its (Grand Minimum) occurrence (if at all) as I considered in this link
http://www.vukcevic.co.uk/NH-GM.htm
Not making sense to me. Maunder minumum characterised by low sunspot number, 2019 characterised by low sunspot number, why does 2019 set a limit on increase since Maunder. Need to read the paper I guess.
The fundamental difference between a star and a planet is scale. The Earth is an infrared star. The moon is a microwave star.
Neglecting this truth leads to absurdities, such as the greenhouse effect.
Does solar energy in & out tell you what the target’s natural temperature is?
Nonsense & stale bait.
What is Jupiter?
IIRC, Jupiter is the Roman equivalent of Zeus.
Let me guess, Zoe….. you didn’t do, like, science ‘n stuff at school.
Remember that song, ‘The more I find out / The less I know’? You are demonstrating that the equal and opposite applies.
A while back, Zoe declared that an object can’t emit a photon, unless there is something available for that photon to hit.
Mark,
Planck’s Law is derived using wave theory between ends (matter to matter).
You want to believe in corpuscular light theory? OK, derive Planck’s Law with that assumption. What does a wavelength even mean to a particle?
Nonsense on stilts.
Zoe’s right, MarkW. It is clear you haven’t studied quantum physics much, if at all. It’s quite weird, at the best of times. Yet those are the rules that govern our universe, as best we can tell. A photon’s departure and arrival do occur at the same time from the photon’s point of view, and there are very specific restrictions on how an arrival can happen, which therefore also restrict the departure. Believe it or not! But quantum physics doesn’t care whether you believe in it or not, only whether you observe it 🙂
The nonsense is the claim that an emitter has to have knowledge of where every other object in the universe is before it can emit a photon.
Mark,
Matter creates a disturbance in E+M fields. Photons charges to that matter which creates the disturbance.
You believe in the aimless photon theory. OK, back it up with evidence.
Planck’s Law uses WAVES. In his cavity there was ONE wave per wavelength between opposing sides.
You believe in TWO-way photon flows. OK, but that 2 way photon flow means the photon density in the cavity should be DOUBLE. And if you think photon density is double, then Planck’s formula is WRONG. You got that?
Planck was not wrong, and there is ONE wave, not TWO opposing photon flows, per wavelength.
You got it?
You have to prove aimless one-way photons. You accept it as a premise to mock me, but it doesn’t exist! At best it’s a philosphical position. Nothing more.
Thank you, Steve.
MarkW, you wrote “an emitter has to have knowledge of where every other object in the universe is before it can emit a photon”. This is actually part of quantum physics. The “knowledge” part is a bit more anthropomorphic than most quantum physicists are usually comfortable with; but all of the constituent components of the universe are nevertheless a lot more tangled together than you think. The view that the universe consists of tiny independently moving Newtonian billiard balls is, as has been pointed out previously, more than a century out of date.
In order for anything to “happen” at a quantum level, a wavefunction has to collapse (which also requires an observer, but that’s a whole other tangled question). That wavefunction can indeed span the entire universe, and some obviously do (for instance observations of light from stars all the way at the other end of the cosmos). Before the wavefunction collapses, it spreads out arbitrarily far, much like a wave on a calm lake, and interferes with other waves representing other photons from everywhere else. There are open questions about whether that universe-spanning (or room-spanning, or atom-spanning) wavefunction collapse somehow imparts information from one side to the other instantaneously, or whether the information was there ahead of time but unrevealed to the observer. Either way, you can’t escape these wave functions. And you can’t escape the quantum collapse either.
You can try, but quantum physics will get you in the end, every time!
Mark
That part might be true.
Quantum physics throws out some strange stuff that can’t all be visualised by Newtonian billiard balls.
Note that photons do not travel. They take no time to get from A to B. They “travel” at the speed of (you guessed it) light and have no mass, so they experience no passing of time. Einstein 101. So all this talk of a light from a distant star being emitted there many years ago is false. The light took no time to get from the star to the viewer on hearth. But time is different at the star. The photon links the star and the viewer in a single moment and there is no time along the photon itself. Photons dont do time. Time and distance are one. Just saying.
Phil Salmon
October 7, 2020 at 8:48 am
Man, you just freaking fracked up the entire base of the orthodox astrophysics there,
in one go.
Salute you… 🙂
cheers
Whiten
An African guy explained that to me on Quora. It blew my mind as well.
Zoe, I must be having a confusing day but I fail to see what any of that has to do with 2019 and the Maunder minimum as limits on increasing sllarvvradiation.
Not true. neutron stars can be just a few dozen kilometers across, smaller than asteroid. And a typical white dwarf is about as massive as the Sun, yet only slightly bigger than the Earth.
The fundamental difference between a star and a planet is mass.
Fair enough.
I did say “scale”, didn’t I?
Thanks for agreeing.
>The fundamental difference between a star and a planet is mass.
No, The difference between a star and a planet is that a star radiates internally generated energy. Other bodies have no internal energy source and reradiate energy obtained from stars.
The sun is clearly a star. The Earth might be an infrared star with the energy source being nuclear fission in the core. Jupiter might be an infrared star. The moon, not so much.
Zoe, from what you post, you’re astronomical. An astronomical kook, that is.
Sure.
All evidence shows hot gases expand to fill the void.
But mainstream astronomy claim they coalesce into a spheroid due to gravity.
And I’m the kook.
Maybe you’re not familiar with better theories?
Knowledge is power … but not if everybody knows it. You need wizards to miseducate the common man. Don’t be a common man.
Yeah, I had to read that a few times too to figure out what they meant. I believe (without having read the full paper) that they are saying that their *numerical modeling* together with the 2019 observation is telling them that the absolute minimum energy the Sun could put out is only 2 W/m2 lower than the 2019 level. (The result does not come solely from observation and inference related to 2019 and the Maunder.) Whether you trust their simulations is a separate question…
Selwyn:
The low temperatures during the Maunder minimum had NOTHING to do with the low sunspot activity at that time. The same is provably true for the Dalton minimum, and is undoubtedly also true for the Sporer minimum.
ALL temperature decreases for those times coincide with increased Sulfur Dioxide aerosol emissions from volcanic eruptions
https://www.osf.io/b2vxp/
Should we be talking about the 17th century when Galileo & his contemporaries recorded high sunspot numbers initially before they seemed to disappear half way through that century and on into the early 1700’s?
Because of the elliptical orbit ISR swings 90 W/m^2 from perihelion to aphelion.
Because of the elliptical orbit any given point ToA sees a 700 W/m^2 swing in solar intensity from summer to winter.
The albedo varies from 60% at the north pole (820 W/m^2), 12% at the equator (164.2 W/m^2) to 75% at the south pole (1,026 W/m^2). (www.climatedata.info)
Lief’s range of -1.72 to + 6.3 W/m^2 is noise in the data, inconsequential.
and so is the solar cycle variation of 1.2 W/m^2…
Best comment I’ve seen on WUWT in a long time. Bless you, sir.
What happens when you have a Grand Minimum during the cold/glacial phase of a Milankovich Cycle? What happens when continental drift totally disrupts established ocean currents? What happens….? It seems to me that either: the whole climate change factors are too chaotic to correctly correlate all of the interactions and come up with reasonable predictions, or I’m too dimwitted to understand any of this. Possible Clue: the friends I play golf with ask me to tee off first, as they say I’m not smart enough to be nervous. I have no idea what that means.
So they are apparently saying:
“We built a model of the sun. We have no idea if it’s complete or accurate but it gives us the answers we want. It proves the Sun has no involvement in Global Temperatures. So nayyyyy!”
I believe they can model the Sun about as well as they can model global climate, although the Sun is likely more complex still.
TSI really is another worthless measurement. One must understand the interactions of each range of electromagnetic waves on various layers of Earth’s atmosphere – each may be interdependent and maybe even at odds with the other. And as already mentioned, the Sun impacts the Earth by using more than just EM waves. Until you untangle all of these complex interactions, you cannot hope to understand how much the Sun impacts our climate over and above keeping the Earth warm. All one can do is draw simple correlations.
The fundamental difference between a star and a planet is scale. The Earth is an infrared star. The moon is a microwave star.
Neglecting this truth leads to absurdities, such as the greenhouse effect.
Does solar energy in & out tell you what the target’s natural temperature is?
Fusion doesn’t exist in whatever world you infest?
Have you seen the fusion? I haven’t. Maybe there’s a fire-breathing dragon in there too?
All I see is initial birth energy draining out slowly.
The photonic evidence of fusion is ever apparent, simply look to our host star busily combining elemental hydrogen into heavier elements every second of the day for the last 4.6 billion years
LOL. Where is that evidence?
I see hydrogen, helium, carbon, nitrogen, oxygen, etc.
Then I see people INFERRING fusion from that.
But heavy elements can be formed by electric discharges, i.e. lightning.
You can’t assume A caused B just because B is next to A. A totally separate proceas could’ve made A and B.
The evidence is that the “birth energy” would have run out billions of years ago.
How do you explain nova and super-nova, both of which have been observed.
MarkW,
The effects of nova and super-nova is nothing more than the celestial sticking tape that holds the universe together slightly fracturing and ripping apart.
See https://www.iflscience.com/physics/peeling-sticky-tape-produces-x-rays/ for the terrestrial equivalent. 😉
We have MEASURED the rate that Hydrogen combines to make He in the lab as a function of the Hydrogen’s energy/temperature. MEASURED here on Earth. We have MEASURED the amount of energy this fusion reaction releases. These Lab measurements were used to predict how much energy the sun MUST be giving off from fusion. Guess what? The energy that the sun gives off all comes from fusion. Good news too – it’s the only way the sun can last for billions of years.
Mark, are you capable of thinking ?
Clearly not!
“We have MEASURED the rate that Hydrogen combines to make He in the lab as a function of the Hydrogen’s energy/temperature. MEASURED here on Earth.”
Hello! You were supposed to prove the reverse: How fusion generates external energy.
“We have MEASURED the amount of energy this fusion reaction releases.”
Uhuh. You released the internal energy, but didn’t explain where the internal energy came from.
Fusion power attempts to create electricity from internal energy. Where did that internal energy come from? From what you gave it!
“These Lab measurements were used to predict how much energy the sun MUST be giving off from fusion. Guess what? The energy that the sun gives off all comes from fusion.”
But your fusion requires the internal energy for it that didn’t come from fusion. You said it yourself:
“in the lab as a function of the Hydrogen’s energy/temperature.”
You just made a completely CIRCULAR argument!
Unlike you, I actually think through things. I want to know where that internal energy came from!
Zoe, didn’t the initial energy come from gravity – from a ball of gas shrinking smaller and smaller, packing the atoms tighter and tighter? Isn’t that the theory?
That wasn’t me, though I’m not surprised you would get confused, you started out very confused. Explain hydrogen bombs.
Fusion has also been demonstrated in lab experiments.
Mark,
“Fusion has also been demonstrated in lab experiments.”
Sure!
https://en.m.wikipedia.org/wiki/Fusion_power
“Most designs aim to heat their fuel to tens of millions of degrees.”
https://en.m.wikipedia.org/wiki/Nuclear_fusion
“The primary source of solar energy, and that of similar size stars, is the fusion of hydrogen to form helium (the proton-proton chain reaction), which occurs at a solar-core temperature of 14 million kelvin.”
Fusion is used to explain why its super hot in the sun, and yet fusion needs a super hot environment to begin with.
What you have is a classic CIRCULAR ARGUMENT.
I guess Zoe has in her mind, refuted Einstein’s E=mc**2.
The energy from fusion comes from a small bit of matter being converted into energy.
This whole internal vs. external energy nonsense is nothing more than another of your famous rabbit holes.
“The energy from fusion comes from a small bit of matter being converted into energy.”
LOL. You forgot the part about needing an environment of millions of degrees, i.e. external energy.
Now why would it need that environment if mass can just become energy?
A visit to Zoe Phin’s website is worth a visit. His thoughts are on full display.
A regards his question, where does the energy come from in the sun to start fusion? – a circular argument according to him.
Has he (or she?) heard of gravitation? An object falling towards a stars as it forms loses potential energy.
I see no point in feeding the troll.
Zoe, I know you like to play the idiot for the cameras, but perhaps if you for once learned something regarding the subjects on which you pontificate, you wouldn’t embarrass yourself so frequently.
In a lab, the use temperature to give the atoms enough energy to over come the repulsion forces. Inside the sun, gravity does that. The sun did not have to be hot for fusion to start.
Apparently people think gravity causes gases to coalesce into a spheroid.
The fact that all experiments show the opposite makes them even more confident they’re right.
If they actually examined the current prevaling theories regarding the sun, it’s creation, and how it works, they would realize it’s junk science, not unlike the greenhouse gas scam.
But NO, they don’t want to know better theories. That would require work. Simply repeating what they were taught placates their tiny fragile egos. They get to act superior to those that have bothered doing more reseaech.
“Inside the sun, gravity does that.”
LOL. Gravity is weakest in the core, and greatest at the surface.
Basic physics, Mark.
https://en.m.wikibooks.org/wiki/A-level_Physics_(Advancing_Physics)/Gravitational_Fields/Worked_Solutions#/media/File%3AGrav_field_sphere.svg
According to Zoe, water pressure in the oceans goes down as you get deeper.
Since Zoe specializes in not getting even the basics right, I’ll have to explain it to her using small words. Gravity causes pressure, and it’s the pressure that forces the atoms to fuse.
Most people don’t need to have that explained to them.
OK, Zoe, since gravity doesn’t cause balls of gas to condense into near spheres, what does? Static electricity?
Zoe, I’m still waiting for you to explain super nova and hydrogen bombs, since you are so convinced that fusion doesn’t exist.
“According to Zoe, water pressure in the oceans goes down as you get deeper.”
I didn’t say that. The mass over head increases more than gravity decreases.
But thanks for mentioning the ocean. The ocean gets COLDER as you move down.
The ocean is a fluid. Pressurized gas is a fluid. Gravity density sorting causes hot material to convect UP.
Pour water into a borehole, and soon enough, the temperature gradient will invert. That’s one of the ways we exctract geothernal energy.
But YOU believe the bottom will always be hottest due to pressure. That’s true for solids, but NOT liquids and gases!
–“All I see is initial birth energy draining out slowly.”–
But Zoe, is that not the mistake that Lord Kelvin made when , on the basis of his own theories of heat loss, he calculated the age of the Earth to be no more than 25000 years? Or are you including the gradual decay of radioactive elements, which Kelvin did not, even after he must have heard of Becquerel’s discoveries.
Mike, don’t expect this Zoe dimwit to understand your point about Kelvin’s fallacy. He/she is profoundly dumb, and hobby with it; you are wasting your time. Hi
Depends on which Kelvin you’re talking about.
1870s Kelvin estimated Earth age between 20 and 400 MILLION years old.
1890s Kelvin estimated 1 BILLION years old.
(All without reference to radioactovity. Simply better parameters from more recent collected data)
Keep in mind that the 4.5 billion year age is determined by isotope ratiosq found at the SURFACE. The deeper we go into the ground the more impossible it becomes to get this dating.
For all we know, some supernovae sprinkled the surface with isotopes. We don’t know when this happened and what the parent/daughter ratio was.
It’s all very speculative, but some people take their assumptions religiously.
The nuclear theory aims to plug the gap between thermodynamics and radioactivity. We need the agento be 4.5 BY, so therefore we must have nuclear reactions for that.
Maybe. Maybe not.
Now you are denying the existence of fusion?
Sheesh, is there anything you know that is actually true?
Ok
I am biting. 🙂
The fundamental (as for fact of matter) difference between a star and a planet is scale.
The Sun is a juge single “plate” plasma “Planet” at the center of the system.
Wondering who sounds crazier now…
🙂
cheers
Only thing crazy is those defending old hypotheses with religious ferver.
Hypotheses that have been proven time and time again.
If these hypothesis would have being proven, they will not be hypothesis anymore.
Those hypotheses are circular in nature.
Assumption = Conclusion.
You haven’t proven anything. You only repeat narratives. You lack the critical thinking skills needed to weigh them against other explanations.
The only circular around here, are your arguments Zoe.
“This means TSI could not have risen since the Maunder minimum by more than this amount, thus restricting the possible role of solar forcing in global warming.”
Pffft. Non sequitur alert.
TSI variation is ONE avenue by which solar variation might affect climate. There is also UV shift (affecting atmospheric chemistry), and variation in the solar wind (affecting GCR).
All of these would be “solar forcing,” driven by variation in solar activity.
I downloaded the paper and searched GCR, galactic, UV and ultra. Only hits were UV twice in the titles of referenced articles so yes, they are simply pretending that these other possible avenues of solar forcing do not exist.
Radically unscientific.
“There is also UV shift “
Shifts is UV frequency can also have a significant effect on penetration into sea water.
https://qph.fs.quoracdn.net/main-qimg-a32d114712a2db94e48bed4fd135ee47
And the effect on sea creatures
http://photobiology.info/Hader.html *green graphs about half way down.
Another paper showing just how much the UV penetration into seawater can change in the 300 – 400 nm range.
https://www.int-res.com/articles/meps/144/m144p109.pdf
And since the only actual warming in the satellite era has come from El Nino events, (ie ocean warming release of energy)… changes in UV content of TSI, especially with decreased tropical cloud cover, need to be at least considered, rather than just ignored.
My sun-climate system works within a strict TSI range first established by Leif Svalgaard, and seconded by me.
From two years ago: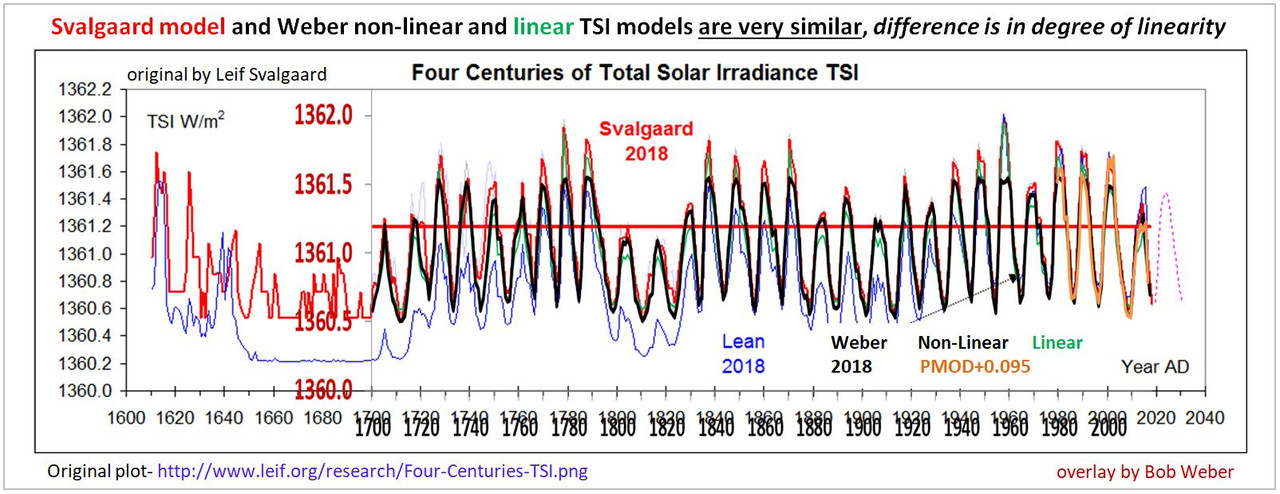
J. Lean, Greg Kopp, et al are also producing a new TSI reconstruction based on v2 SN and I’m very much looking to seeing what they come up with.
The authors of this paper think they’ve made it harder for TSI to be considered the main forcing, but they don’t realize it’s already been taken into account by me, see inset (c) – no problem:
I’ll be updating my model soon using RMIB, CDR, and other TSI datasets for comparison.
Models, models, models- models, including quantum mechanics, provide possible ways of describing a phenomenon. They do not provide any information beyond what is described in the equations used.
At best a model can describe what might happen under certain circumstances, which is not the same as describing what actually happened.
It’s been awhile since the prof twisted my mind around the Shroedinger equation, but he did emphasize that the equation calculated probabilities, not results. I do not believe anyone has shown that QM can do more.
“This means TSI could not have risen since the Maunder minimum by more than this amount, thus restricting the possible role of solar forcing in global warming.”
Again as has been said many times, TSI as the promoted end story on the role of solar forcing is likely not the full picture of likely influences on Earth’s energy balance. Even though it sis small part of TSI, the EUV/UV flux varies as much larger percentage than the TSI over the sun’s magnetic cycle and the deep minimums like the Maunder period.
EUV/UV is intimately related to the formation of stratospheric ozone and thus the maintenance of the stratosphere’s temperature profile characterized as a positive lapse rate (the stratospheric temperature increases with increasing altitude, compared to decreasing temp with altitude in the troposphere).
The temperature of the lower stratosphere (TLS) has been the subject of much research, and study.
https://www.climate.gov/news-features/understanding-climate/state-climate-2011-stratospheric-temperature
Dr.’s Christy and Spencer are keenly tuned into this active research area via their AMSU studies of global atmospheric temperature and maintenance of the UAH atmospheric temperature data sets. (After Mears fiddled with his RSS adjustment as few years back in a blatant political response to Senator Cruz, the RSS data is no longer trustworthy IMO.) We know the TLS has decreased over the period since active satellite monitoring began via continuous microwave soundings, and even more so from radiosonde profiling data since the late 1950’s. (see graph in link above)
During the satellite MSU/AMSU period the troposphere has unquestionably warmed (ignoring the 2 big volcano events Pinatubo-91 and El Chichon-82). Meanwhile TLS has declined by over 1.5º C during the 50 years from 1960 to 2010. From Dr Spencer’s latest UAH update, the TLS Global trend since 1979 to present is -0.28º C/decade. Interestingly, the past three month’s anomaly readings in the UAH TLS have all been below -0.75º C (-0.79, -0.76, -0.76). The last time the TLS did this kind of summer dip (coincidentally?) was the rapid transition of ENSO states in June-July-August 2016 aligning with a rapid swing from the ending 15-16 whopper El Nino to La Nina equatorial Pacific states. And the UAH monthly anomaly of the lower troposphere during that 2016-2018 period declined about -0.2 C.
http://www.drroyspencer.com
The point of the above discussion is to point out that the stratospheric temperature profile and its declining anomaly is intimately linked to what establishes the stratosphere’s lapse rate — ozone. Stratospheric Ozone (thankfully) absorbs (thankfully) all of the EUV and most of the most harmful UV. This absorption of EUV/UV is what controls the stratosphere’s temperature profile. Quoting from the Wiki entry on this non-controversial subject, “The rapid photolysis and reformation of ozone heats the stratosphere resulting in a temperature inversion.”
https://en.wikipedia.org/wiki/Stratosphere#Ozone_and_temperature
So with the sun still apparently entrench in a new minimum like behavior the last several months, and the building La Nina in the equatorial Pacific, we are set to see another major drop in the temperature anomalies of the troposphere which are going to greatly challenge the IPCC and their CMIP6 models about the time they release their AR6 in a cooling planet background.
So TSI is far from the full picture on what is warming and cooling our atmosphere. Some may argue the this a tail wagging the dog comparison, but I’d say, as dog owner, most dogs like to chase their tails when bored. The troposphere similarly may have to chase the stratosphere, and get colder here where we live (the lower troposphere) very soon.
There is this theory that global warming caused by CFCs
https://uwaterloo.ca/news/news/global-warming-caused-cfcs-not-carbon-dioxide-study-says
As I’m sure you’re aware, generally speaking the air doesn’t warm the ocean, the sun warms the ocean via sunlight, so high atmospheric mechanisms would have to be shown to dominate both the surface air and ocean depths in order for the high atmosphere to be climate-change effective like TSI which does affect the ocean.
This La Nina is due to extended low TSI, as there’s been so little impulse yet at the start of SC25.
The Thermospheric Climate Index (TCI) is closely related to TSI, so ozone changes in the high upper atmosphere are also part of the sun’s regular activity cycle concurrent with tropical cooling. TSI is the big dog as only it has the power to directly warm the ocean via sunlight, even through a cloudy El Nino like in ’15/16.
UV is the best wavelength to warm seawater to depths to 50 meters.
Which wavelength is the best one? The blue-green wavelengths are overwhelmingly higher/deeper in energy density/absorption depth than UV purple,
– unless there’s a mysterious non-linear UV ocean warming force at work here, a 20-30X UV amplifier mechanism powered by CO2 feedback! /sarc
And the air actually cools the ocean via advection-driven evaporation by taking sensible heat and turning it to latent heat with the phase change, even when the air temp is higher than the water temp.
As a technical note: I wouldn’t use 1 AU adjusted solar data to claim Earthly climate effects.
Joel, on my CO2 Naturally Follows Solar-Driven Climate Change sun-climate symposium poster from earlier this year, I referenced the enhancement of the annual insolation cycle and effects by 1au TSI:
I made a Nino1234 indice that is represented twice in the next image, the second time being the 30y average, also correlated to 30y SN. The Nino1234 annual indice is the area-weighted sum of the Nino1-4 regions expressed as a timeseries of the ratio of the first six months to the second six months monthly averages of each year since 1870.
The higher solar activity average during the modern maximum years correlates with the early-year Nino temperatures relative to the second half of year (Nino234) due to the higher 1au irradiance enhancement of the annual insolation cycle that peaks in January.
The Kelvin waves in inset (a) below started in earnest during the near-perihelion twin TSI peaks of Feb & March 2015, from higher irradiance absorption, which continued until TSI fell below my previously established sun-ocean warming threshold in March 2016, inset (i), initiating cooling.
The record El Nino resulted from constructive high TSI/annual cycle timing after TSI had already climbed above the warming threshold first in 2011 for 4-5 years of warming first.
A lot of the blue light scatters back out of the water, that’s why we see it a blue ocean.
You’re right, but it doesn’t scatter all of it. The relative climate effect of UV vs TSI was an open question ten years before I met Linton Floyd in 2018 (see link), and still is today, but the light penetration depth seems to favor the larger spectrum influence over the smaller UV range.
http%3a%2f%2fsolar.physics.montana.edu%2fSVECSE2008%2fpdf%2ffloyd_svecse.pdf
Bob Weber
October 6, 2020 at 5:15 pm
As I’m sure you’re aware, generally speaking the air doesn’t warm the ocean, the sun warms the ocean via sunlight, so high atmospheric mechanisms would have to be shown to dominate both the surface air and ocean depths in order for the high atmosphere to be climate-change effective like TSI which does affect the ocean.
———————————-
You have a huge big problem there. (as per means of climate)
CO2 concentration data firmly disagree.
As it mostly, especially in consideration of your claim, will be linked to oceans warming.
You will need to apply a lot of AGW tricks to have a chance to compensate there, but still will end up with the positive feedback of CO2.
Which to the amount and intensity, as for your proposition, leads to… wait for it… wait…
runway global warming. (which is not the case but anyway)
Then how can one “quiet” Sun cycle will be stopping it????
(stopping something that does not even exist, which according to your claim, must be, as otherwise the data of CO2 will have a huge lough at it.)
Well, so as to be clear about the CO2 data… the atmospheric one.
The one that dominates over your position.
The ocean heat content dominating the atmospheric one is a no brainer.
Even Mann knows that much, and am sure griff agrees also.
But the point is that you have got to show how the TSI variation consist as being the dominant potential
in consideration of the ocean heat content variation in long term, like climate…
especially when not in anyway possible could be supported by CO2 emission-concentration data.
Data that holds a signal that is as straight as an arrow.
cheers
But the point is that you have got to show how the TSI variation consist as being the dominant potential in consideration of the ocean heat content variation in long term
Absolutely.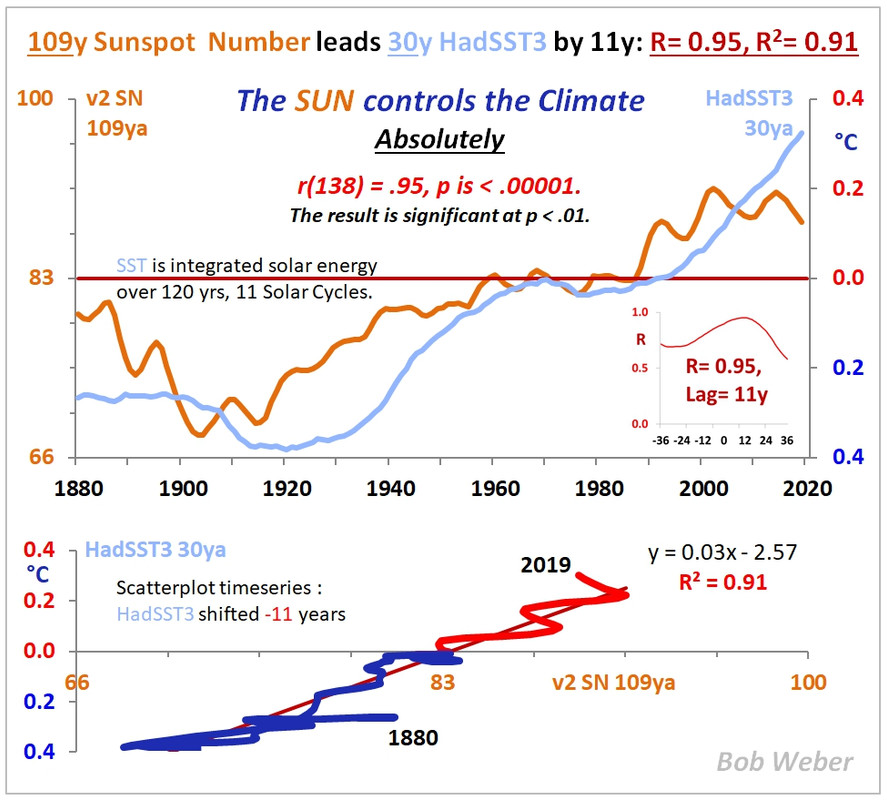
I’ll be back tomorrow to show how my CO2 outgassing threshold of 25.6C is directly related to SST, OHC, and CO2 growth, ie the trend, after I finish those graphics with labels etc.
One quiet sun cycle isn’t enough. Everyone was talking about how SC24 was going to cool but it didn’t, and my work explains why. Read my comment to Joel for more, as I’ll build on that later tomorrow.
Good, but keep in mind the very point of you about the;
“high atmospheric mechanisms (would have to be) shown(ing) to dominate both the surface air and ocean depths in order for the high atmosphere to be(ing) climate-change effective like TSI”
May end up with the atmospheric effect (high and low) overwhelming the supposed TSI
climate effect, regardless of we knowing or not the mechanisms.
Very similar to the uge problem the AGW or ACC facing.
cheers
Here it is, the application of my CO2 outgassing threshold to climate change:
The area and temperature of the ocean above 25.6C drives SST, OHC, and ML CO2.
R=.93 for JMA SST, R=.96 for JMA OHC, and R=.99 for ML CO2.
Correction: I forgot the word “Integrated” on plot #10, so here it is fixed:
The current outgassing threshold boundary is inside the yellow area here:
I also made an ocean model depicting Henry’s Law, verified w/SOCAT measurements.
Bob Weber
October 7, 2020 at 8:45 pm
You just have tied-coupled your claim to the problem that AGW ACC has.
Radiation does not effect climate.
Decoupling of temp from CO2 concentration is indisputable and significant.
The atmosphere does not care mate… even when you may believe that the Sun is the effect behind the CO2 path…. which it is not.
So your claim of the Sun driving the outgassing… shows how impotent that variation in TSI is in consideration of the thermal atmospheric variation.
Please do spare me of some CO2 runway effect explanation… which you may be forced to consider, as otherwise your claim fails under the catch 22 clause.
As it will be an insult on the intelligence.
Getting from the back door in this case does not help you… only makes it worse.
Your claim that TSI variation effects oceans heat or thermal content variation in climate term fails by its own merit of contradiction.
Maybe you should start reconsidering your understanding in the oceans outgassing first.
To me, you just have proven that TSI variation does not effect at all the atmosphere thermal variation… by showing the clear contradiction there.
At least the AGWers are claiming that the effect in the CO2 is anthropogenic not natural,
which gives them more tricks in trying to keep up with their claim.
You do not have that luxury.
Hopefully you understand now the contradiction, the catch 22, the conflicting, that your claim falls and fails under.
cheers
Do you have a specific cogent point whiten? Are you sure you know what I mean and understand these connections?
ML CO2 is measuring outgassing, not MM CO2 emissions. Emissions get absorbed by nature, by greening the earth and by sinking in the ocean. It does not matter how much we put up in air, nature always takes CO2 back down to what the ocean will allow the atmosphere to hold via Henry’s Law. CO2 is not warming anything.
Referring to plot #3 where I refer to 93 v2 SN, which is the average solar activity during the below average period (in black) for the ocean area >=25.6C, a breakeven value that is the same as my sun-ocean decadal warming/cooling threshold, adding to the previous ten indices I found with a similar threshold (second link).
TSI variation controls the tropics first, which controls the rest, including CO2.
Bob Weber
October 8, 2020 at 12:01 pm
Sorry to put it so blatantly.
But the only thing that stands between you and the actual reality in this given issue happens to be plain denial.
You are told clearly that the CO2 data do not support under any circumstance the proposition of the TSI variation having any effect in the CO2 variation, ether in emission flux or the atmospheric concentration ,
especially when one fails and attempts to connect to the CO2 concentration trend
as recorded per the observation… for some support there.
You see the data is plainly clear.
The main potential of CO2 emission flux, as per the CO2 data is clearly “local”,
to polar regions, where the atmosphere is “colder” than other parts of this globe,
and the oceans are less warm than in the rest of the globe.
(You clearly told to reconsider your understanding of outgassing)
As in your case, your claim mainly based in the proposition that the CO2 emission flux mainly due to outgassing… you clearly fail.
Your problem there is with reality and observation of it, data, to a point that no any theories or big names can help you and your position taken there.
The TSI signal there in this case, non existen,
even below of what may be expected or considered as noise.
You can have your own cake and eat it, any way you like to, but that has nothing to do, or being in common with reality.
Once you decided to get to prove your point by showing a clear relation between the TSI variation and the CO2 atmospheric concentration trend, you coupled your claim to the CO2 emission flux.
Too blind and too bad of you.
The CO2 data does not support your claim, under any circumstance.
There is no way one can derive a TSI signal in consideration of the CO2 emission flux as per means of reality.
Oh well, you are just one who have just tried… but still fails to see how non real and foolish that whole venture is.
You deny your own failure in this attempt… that is as simply as it could be put.
But hey don’t let me rock your boat… please keep going the way you want.
The way I see it, you should have stayed clear, a way clear, from the path of connecting, or the attempt to connect the TSI signal to the CO2 atmospheric concentration one.
Hopefully you understand this much… fingers crossed… miracles sometime do happen.
cheers
“The temperature of the lower stratosphere (TLS) has been the subject of much research”
Do they measure it at the same altitude all the time?
Stratosphere has a slightly positive temperature gradient… with the tropopause moving up with the slight warming in the troposphere, there is always going to be a slight cooling in the stratosphere measured at the same altitude.
That is a technical question best left to Dr Spencer or Dr Christy.
IIRC, there is some overlap in the channel brigthness they use from AMSU netween the lower stratosphere and upper tropopause. And then thye use from knwn relationship with adjacent channels to deconvolve a TLS out of that. But how that relationship changes over time/temp/latitude, I don’t know.
“Adopting a novel approach based on state-of23 the-art solar imagery and numerical simulations, we establish the TSI level of the Sun when it is in its least active state”
How can establishing a modern low point in TSI establish any kind of minimum on past TSI? The Sun spot count is not a direct thermometer, just a hint of what’s going on. One could have the variation of Sun spots, on top of a wave action of other internal processes, and then throw in external processes that may be independent or coupled to the Sun, for even more fun in the Climate Wars.
I don’t know why they are studying the sun. It is settled science, the sun has noting to do with the climate on earth. Nothing. Only CO2 affects the climate. CO2 is the only variable. It is Settled science. Why are these clowns being given any money to study something that is believed by a consensus.
OT, looks like Germany has overtaken Denmark on electricity costs.
https://notrickszone.com/2020/10/06/german-electricity-prices-soar-now-most-expensive-in-europe-taxes-green-surcharges-make-up-53-6-of-price/
They’re locked in a battle for Worst Place.
and both are losing…
Here is more research that shows CO2 change follows temperature change:
https://tinyurl.com/y4zso26m
Although the current “dead sun” reflects transition from 11-year Sunspot Cycle 24 to 25, odds are that Sol is entering a 90-year Super-Grand Solar Minimum through c. AD 2110. Meantime, though total solar irradiance (TSI) indeed is Earth’s primary global atmospheric surface temperature (GAST) determinant, this obtains at several astro-geophysical removes.
As climatologists Henrik Svensmark and Valentina Zharkova have demonstrated from 2007, TSI drives any star-system’s solar magnetic fields (SMFs), whose fluctuations enable cosmic radiation to penetrate Earth’s magnetospheric sheath, seeding global cloud-cover whose overcast governs GAST’s episodic rise or fall. Contributing factors include Earth’s orbital inclination and equinoctial precession, meteor strikes, mountain-range orogenies, and regional volcansism.
True enough… but from Earth’s Neoproterozoic Ediacaran Period 635 mm YBP to the Cenozoic/Tertiary’s late Pliocene some 3.6 mm YBP, our planet experienced no pre-Cambrian or Phanerozoic glaciations. Given subsequent Pleistocene Ice Ages averaging 102 kiloyears, interspersed with interstadial remissions of median 12,250 years, latterday climate cycles thus combine cosmic radiation, SMFs and TSI, with continental plate-tectonic dispositions. Walling off Eastern from Western hemispheres, conjoined North and South American landmasses block circulating atmospheric/oceanic circulation patterns.
As for Luddite sociopaths’ ‘postulated “greenhouse gas” (CO2) emissions due to fossil fuels (sic), Earth’s 12,250-year Holocene Interglacial Epoch ended with a 500-year Little Ice Age in AD 1350, while global temperatures have trended lower over 3½ millennia from New Kingdom Pharaonic times. On this empirical basis, Australian Roberts Holmes’ 2017 “Mean Molar Mass version of the Ideal Gas Law” equates any –repeat, any– planet’s Temperature T = PM/Rp, where P = Atmospheric Pressure times M = Mean Molar Mass over R = Atmospheric Density times Gas Constant p.
As serial refutations cumulate –recent ‘”corrections” acknowledge that ” every past carbon budget finding has been violently discounted”– AGW’s fatuous shills professing otherwise are either studiously ignorant, willful frauds, or just mendacious fools.
“The dimmest state…….”
In Australia, would be South Australia..
In the USA… is obviously California. ! (except in bush fire season)
I think Victoria has stolen that title this year.
The Maunder Minimum was between 1650 and 1700, that is not the 16th but the 17th century.
Maybe the were referring to the Spörer Minimum???
https://en.wikipedia.org/wiki/Spörer_Minimum#/media/File:Carbon14_with_activity_labels.svg
The analysis starts in 1615
TSI variation may be small or inconsequential but over 400 years other factors play a part.
Does the earth’s orbit vary for any reason in this time frame, very unlikely but needs to be considered even of only to eliminate any additive inconsequential effect.
Cloud cover, are there any effects that cause increasing cloud cover at the solar minimum ?
Would negative feedbacks then cause a consequential effect?
OTOH hand its all computer modeling, so take it with a grain of salt
I prefer not to take it at all. If they propose empirical tests against their speculation they OK – I’ll at least read it. But if they’re just speculating (modeling), so have an untestable hypothesis, then why should we waste our time reading it?
How cute! They have lost track of the assumptions they’ve made for that to be true, making it turtles on top of turtles.
The first and foremost assumption and the biggest mistake many intelligent people make is that most of the energy for the variability of solar forcing on climate comes from the small changes in TSI, and therefore solar variability forcing of climate MUST be small. BIG ASSUMPTION that we know is WRONG.
It has been demonstrated several times and it is relatively easy to check oneself (I’ve done it), that the speed of rotation of the Earth changes with solar activity. There is a semi-annual component in the speed of rotation that depends on the solar cycle:
Le Mouël, Jean‐Louis, et al. “Solar forcing of the semi‐annual variation of length‐of‐day.” Geophysical Research Letters 37.15 (2010).
How much energy does it take to change the speed of rotation of the Earth in a solar activity-dependent manner? And who provides that energy? The answer to the second question is obviously the Earth. It is the Earth that changes its rotation speed in response to solar activity, and not the change in TSI that causes it.
Therefore we DO KNOW that the climate system can and does respond to changes in solar activity in ways that are not proportional to the change in TSI. Solar activity provides the initial signal and direction, and the climate system provides the required energy and mechanisms.
Since the fundamental assumption of the paper, that the effect of solar activity on climate is directly due to the change in TSI, is wrong, then the conclusions of the paper are wrong regardless of the method used to arrive to them. That is the problem with assumptions, they are not subjected to the scientific method because they are assumed from start to be true.
Thanks Javier. Common sense prevails. Long term changes in the Sun cannot be modeled without long term data anyway. And the important solar attributes, vis-a-vis Earth’s climate are unknown. In any case, as Judge, et. al. (Astrophysical Journal, March 2020) showed, stars similar to the Sun, have greater variability than we have seen in the short time we have been observing our Sun. The problem with models is they make us think we know more than we do. As you say, they have lost track of their assumptions.
+10000
Therefore we DO KNOW that the climate system can and does respond to changes in solar activity in ways that are not proportional to the change in TSI.
You clearly don’t know how TSI works on the climate, making your sophistry misleading
If you think TSI is not the main climate driver then name the solar mechanism that is and be prepared to defend it with evidence, not innuendo, and do it right, now. If you’re going to tell us the LOD causes the climate to change be prepared to show how exactly w/o handwaves.
You are doing and following exactly in Ben Davidson’s (Suspicious Observer) footsteps, who also wants to be “the man” in everyone’s eyes like you do wrt to solar forcing. What do you guys do? You can’t accept the truth about TSI because you didn’t discover it and can’t get it so therefore other solar mechanisms get invoked in a scattershot attempt to keep yourselves on top of the heap while suppressing TSI. Unfortunate to watch this happen day in and day out for years on end as the two of you along with David “cosmic ray” DuByne of Adapt2030 continually muddy the waters.
Ben Davidson claimed in his ‘plasma forcing’ youtube series this summer that TSI is made up. He doesn’t know the instrumentation history or why there’s a need for continual model improvement.
TSI research like Leif’s and this paper are steps in the right direction you and Ben aren’t appreciating.
That is the problem with assumptions, they are not subjected to the scientific method because they are assumed from start to be true.
Javier has assumed from scanty evidence from the start some unspecified solar forcing is causing more climate change than TSI can. It is Javier’s strawman handwaving assumptions that are phudged up.
“state-of-the-art” is always a bad omen and a clue.
This model also “proves” it does not get colder at night.
With Solar Cycle 25 we’re refreshingly back in Popperland (deductive falsifiable science).
Only 5-6 years to wait to see who’s right and who’s wrong.
(Repeated from the last cycle 25 post.)
Is science driven by politics really science?
https://www.thegwpf.com/ben-pile-science-is-now-just-another-wing-of-politics/
Spectral chemistry is more industry. TSI is a small variation but UV radiation is not. UV radiation varies by 50% over the cycle. This has massive implications to upper atmospheric chemistry.
Stellar Fusion,IIRC, is started under the Ideal Gas Laws at about 2million K. With a bit of help from Quantum Tunnelling at that Pressure……
Resultant Fusion generates c. 60million K in localised patches over the central 200,000 miles of our Sun. Where atoms cannot exist IIRC, until their parts wander into less energetic lower pressure zones.
This knowledge also obliterates the CAGW back-radiation scam, yet again. Stellar Science really can be somewhat, well, stellar. While HANDWAVIUM rules in CAGW land, eg this Paper. Brett Keane, NZ
Sorry to be pedantic, but isn’t there a typo in this sentence: “The role of solar forcing in global warning is unclear” ? – I think “warning” should be replaced with the word “warming”. 🙂