Guest “geological perspective” by David Middleton
CRYOSPHERE RESEARCH UPDATE
Unprecedented ice loss is predicted for Greenland Ice Sheet
30 Sep 2020Over the next eighty years global warming is set to melt enough ice from the Greenland Ice Sheet to reverse 4000 years of cumulative ice growth – with rates of ice-loss more than quadruple even the fastest melt rates during the past 12,000 years. These stark conclusions come from new simulations which, for the first time, put current and projected future rates of ice-loss into context; comparing them directly with historical rates of ice-loss. These latest results are consistent with previous research that shows that if we continue our current high trajectory of greenhouse gas emissions we can expect Greenland to become ice-free in as little as 1000 years.
[…]
But as their simulation ventured into the future they discovered that the rate of ice-loss is likely to dwarf anything seen in the past. Under a high-emissions “business as usual” scenario Briner and his colleagues show that ice loss could reach an eye-watering 35,900 billion tonnes per century by 2100, whilst under a low-emissions scenario it is likely to rise to around 8800 billion tonnes per century. “It was a shocking to me to see that even with low emissions the pace of ice loss is going to be faster than it was during the warmest period in the past,” says Briner, whose findings are published in Nature.
[…]
Physics World
A read-only copy of the paper is available for viewing… Nature.
Basically, RCP8.5 melts all of Greenland’s ice within 1,000 years.
Is anyone else picking up a “been there, done that” vibe?
Perspective
This section adapted from The Insignificance of Greenland’s Ice Mass Loss in Five Easy Charts…
I downloaded the Kobashi et al., 2017 climate reconstruction from NOAA and plotted it to evaluate the context of recent climate change in central Greenland.


The inescapable conclusion is that if there ever was a climate “crisis,” it was during the Little Ice Age… It was FRACKING cold back then!
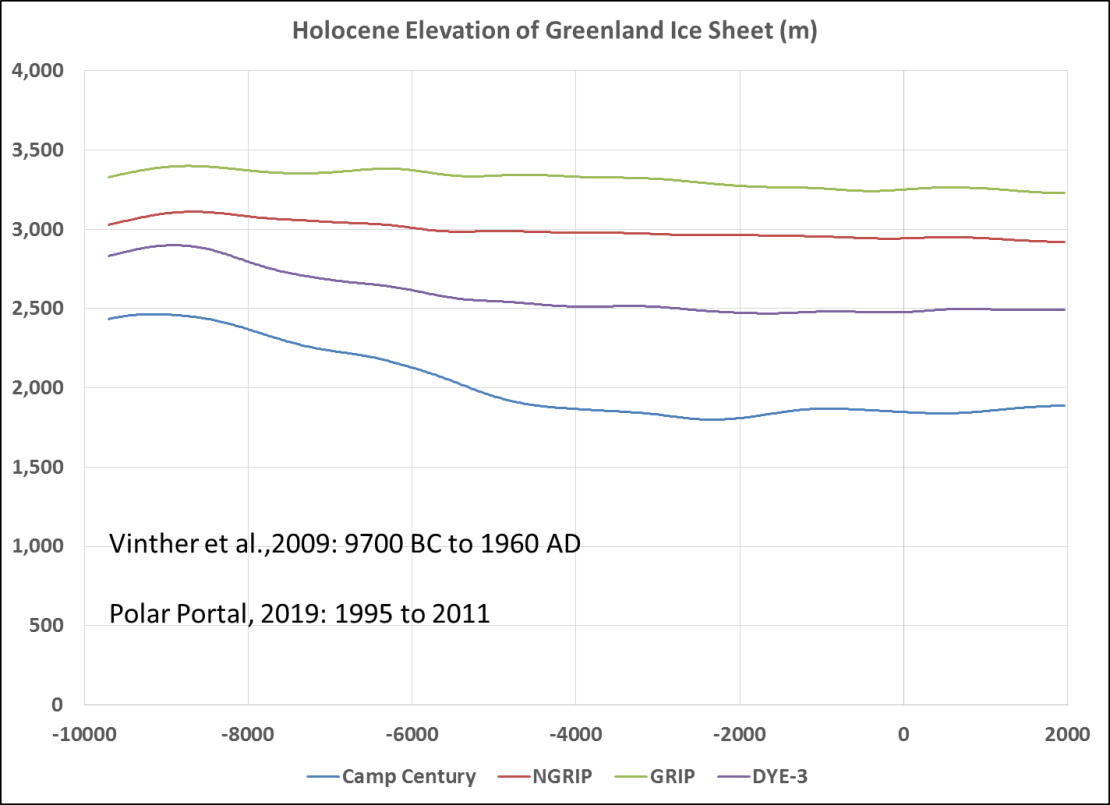
How does the recent melting compare to the rest of the Holocene? Short answer: “Same as it ever was”. Vinther et al., 2009 reconstructed the elevations of four ice core sites over the Holocene. There has been very little change in elevation of the two interior ice core sites (NGRIP and GRIP), while the two outboard sites (Camp Century and DYE3) have lost 546 and 342 m of ice respectively.

Vinther’s elevation reconstruction runs from 11,700 to 40 years before the year 2000. So the most recent year is 1960.
Based on the mass balance estimates from Mouginot, there was very little net change from 1960 to 1995, the starting year for Polar Portal’s elevation change maps. I enlarged the elevation change maps and posted the ice core locations on them.

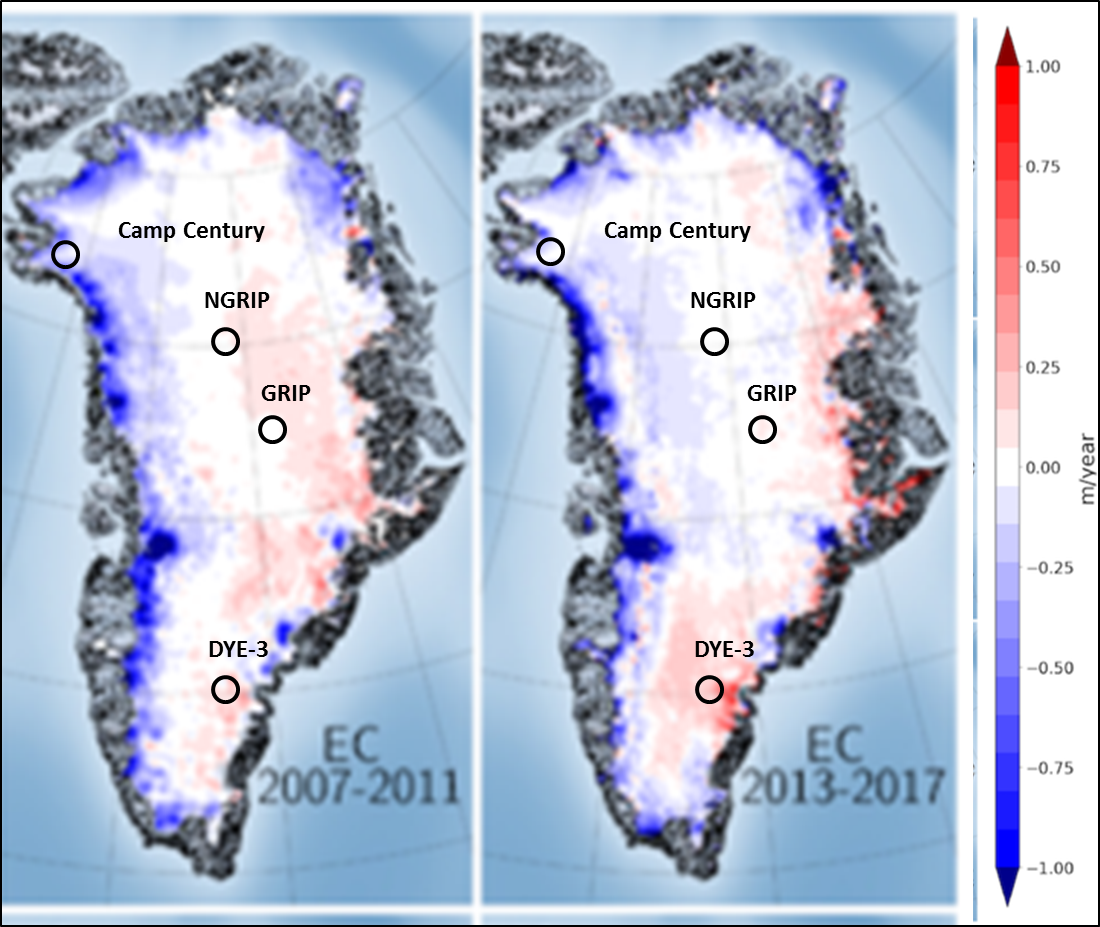
The scale is in meters per year. Note that there has been very little change in ice elevation at these locations. Using my Mark I eyeball, I estimated the annual changes in elevation from 1995-2017.
Using the 2009 elevations provided by Vinther, I calculated the elevations of the four locations from 11,700 years ago up to 2017.

But, but, the Greenland ice sheet is still shrinking! When it all melts, sea level will rise by 7 meters!!!
We petroleum geologists are obsessed with calculating volumes of oil and gas reservoirs and we spend a lot of time making things called “isopach maps” and running “volumetrics“. Fortunately for me, Eric Gaba – Wikimedia Commons user: Sting made an isopach map of the Greenland ice sheet.

Almost all of the recent thinning is in the outboard areas of the ice sheet (“Same as it ever was”). I downloaded a high-resolution copy of the isopach map and digitized the contours using NeuraMap volumetric analysis software. The area and volume of the isopach map were inline with estimates in USGS Professional Paper 1386–A, Table 2, page A77.
- Area: 1,736,095 km2
- Volume: 2,600,000 km3
I used the 10 m contour as the 0 contour. The area of the 0 m contour was very close to the USGS area.
| Contours (m) | km2 | Acres |
| 3,200 | 888 | 219,434 |
| 3,000 | 49,381 | 12,202,209 |
| 3,000 | 896.1 | 221,429 |
| 2,500 | 364,162 | 89,986,345 |
| 2,000 | 723,269 | 178,723,576 |
| 2,000 | 5,395 | 1,333,230 |
| 2,000 | 9,186 | 2,269,815 |
| 1,500 | 1,065,247 | 263,228,385 |
| 1,000 | 1,347,485 | 332,970,919 |
| – | 1,737,393 | 429,319,196 |
The volume was a little higher than the USGS estimate; but well within the range of other recent estimates. The USGS cites a 1954 reference for this number and also cites Bamber et al., 2011, which puts the volume at 2,900,000 km3. Bamber has subsequently upped his estimate to 2,960,000 km3.
| Volumes | km3 |
| Method | In situ |
| Trapezoid | 2,980,626 |
| Pyramid | 2,953,938 |
| TrapPyra | 2,961,940 |
| Simpson | 2,844,332 |
| 3/8Rule | 2,725,668 |
| VerticalSlice | 2,979,256 |
| Step | 2,456,431 |
| Average | 2,843,170 |
As can be seen, estimates for the volume of the Greenland ice sheet vary widely and the methods of volumetric calculation yield a pretty wide range of results… Yet modern climate “scientists” can detect 0.015% annual changes in its mass… Go figure!
This is what happens if I drop the 1,000 m contour by 10 m:
| Volumes | km3 | |
| Method | Lose 10 m | |
| Trapezoid | 2,977,601 | 99.90% |
| Pyramid | 2,950,926 | 99.90% |
| TrapPyra | 2,958,915 | 99.90% |
| Simpson | 2,844,332 | 100.00% |
| 3/8Rule | 2,725,668 | 100.00% |
| VerticalSlice | 2,976,230 | 99.90% |
| Step | 2,453,891 | 99.90% |
| Average | 2,841,080 | 99.93% |
99.93% of the Greenland ice sheet doesn’t melt and/or calve into the ocean. The USGS paper states that if the entire ice sheet were to melt, sea level would rise by 6.5 meters. In the highly unlikely scenario above, sea level would rise by a whopping 4.8 mm.
- 6.5 m * 0.07% = 0.00478 m
What happens if I drop the 1,000 m contour by 100 m?
| Volumes | km3 | |
| Method | Lose 100 m | |
| Trapezoid | 2,947,019 | 98.87% |
| Pyramid | 2,920,467 | 98.87% |
| TrapPyra | 2,928,333 | 98.87% |
| Simpson | 2,844,332 | 100.00% |
| 3/8Rule | 2,725,668 | 100.00% |
| VerticalSlice | 2,945,636 | 98.87% |
| Step | 2,428,207 | 98.85% |
| Average | 2,819,952 | 99.18% |
- 6.5 m * 0.82% = 0.0531m
That’s just over 2 inches of sea level rise.

RCP8.5: Junk Science on steroids
If you review their paper in Nature, you’ll see that the nightmare scenarios are all ginned up with the RCP8.5 model scenario, the one where Doctor Evil melts the icecaps with a space “laser.”
This section adapted from: U.S. Climate Resilience Tool Kit: Greenland Stays Frozen in 2100… Even Under RCP8.5
I stumbled across something very useful yesterday on Climate-Dot-Gov’s U.S. Climate Resilience Tool Kit page.
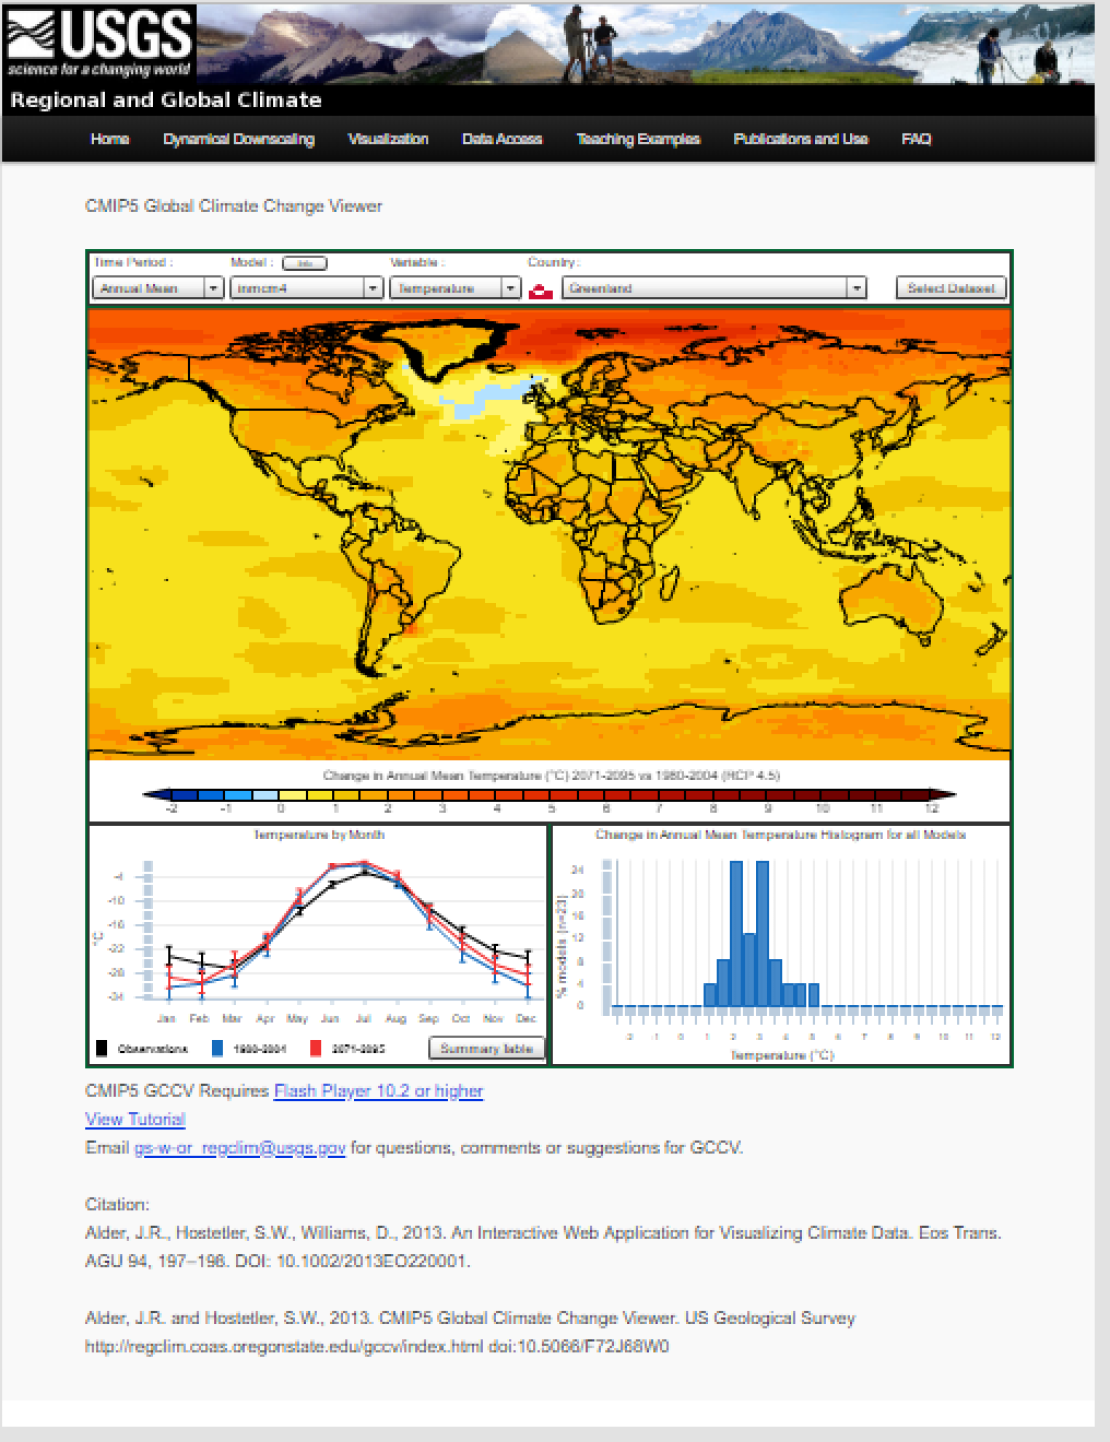
The widget generates CMIP5 or PMIP3 model outputs for specific countries and a temperature change map of the world. You can also spit out plots of each model. And these outputs display the actual temperature ranges rather than anomalies.
Since Greenland is such a great climatic playground, I started playing around with it.
Greenland Stays Frozen in an RCP8.5 Bad Science Fiction Nightmare
The first thing I did was to hit Greenland with RCP8.5.

While the histogram indicates a 5.1 °C rise in the average annual surface temperature. It’s thought that the Sangamonian (Eeemian) interglacial was at least 5 °C warmer than today and Greenland retained much of its ice. However, most of that 5.1 °C rise appears to be in winter and the average July temperature is projected to still be below freezing, only 2-3 °C warmer than the 1980-2004 mean.
Andy May’s brilliant analysis of NCA4 featured this image:

Andy noted the following:
INM-CN4 is labeled and it, alone, is tracking the observations with enough accuracy, yet it does not predict dangerous temperatures in the future or any significant human influence on climate.
This drew some standard ad hominem and/or unsupported dismissals of Dr. Christy’s work and derision of INM-CM4. So I downloaded UAH 6.0 and HadCRUT4 and plotted 5-yr running means at the same scale as Dr. Christy’s 2016 plot.

UAH 6.0 generally plots within 0.1 °C of the average of 3 satellite datasets, closest to INM-CM4. HadCRUT4 plots well-below the model-mean closest to the only model that runs hotter than INM-CM4. Note that there’s not a lot of difference between HadCRUT4 and UAH 6.0. (0.1-0.2 °C is not a lot of difference).
Here are the RCP8.5 and RCP 4.5 outputs for INM-CM4 in Greenland:

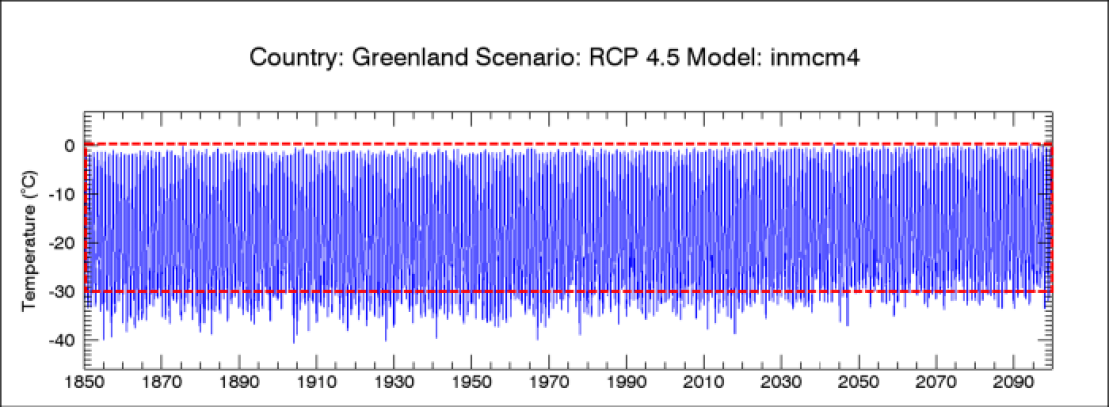
Both models indicate that Greenland won’t be significantly warmer in 2100 than it was in 1850. Almost all of the warming comes from an increase in the minimum temperatures.
1850 was very cold by Holocene standards.

Where is Inigo Montoya when you need him?
Tipping Points: “You keep using that [phrase], I do not think it means what you think it means”
The Physics World article closes with this…
Previous research has suggested that we have already passed the point of no return for the Greenland Ice Sheet, with no hope of preventing a complete meltdown, but Briner and his colleagues are not convinced that this tipping point has passed. “It is clear that we are now committed to a lot of ice loss through this century, but our simulation shows that if we follow a low-emissions pathway the rate of ice-loss may slow as we approach 2100. It is possible to leave future generations with a healthy Greenland Ice Sheet,” he says. Lenton concurs and thinks there is still time to act. “Even if tipping points have been passed, because the ice sheet dynamics are relatively slow, it is possible to ‘overshoot’ an ice sheet tipping point temporarily and still recover the situation. That of course requires bringing greenhouse gas levels down, which is going to require deliberate greenhouse gas removal on top of stopping greenhouse gas emissions.”
Physics World
There you have it… The bear will always remain just out of sight in the woods.
Added Bonus
A couple of weeks ago a massive chunk of ice – equivalent in size to the Caribbean island of Montserrat – broke away from north-east Greenland.
Physics World
- Montserrat 102 km2 (39 sq mi)
- Manhattan 59 km2 (23 sq mi)
Montserrat ~ 2 Mahattans
Adapted from: 2012: The Year Greenland Melted (AKA Alarmists Gone Wild) and Manhattan-sized Icebergs!
Manhattan-sized Icebergs are insignificant relative to Greenland-sized ice sheets.
- Manhattan: 34 square miles.
- Greenland ice sheet: 660,235 square miles.
Manhattan = 0.005% of Greenland ice sheet. 99.995% of the Greenland ice sheet did not participate in this event.
If one Manhattan-sized chunk of ice calved into the ocean every year and there was no snow accumulation in Greenland for 1,000 years, Greenland would lose 5% of its ice sheet. A little perspective on Manhattan-sized chunks of ice…

(Wikipedia and Google Earth)
Briner shows Greenland Ice area just a nudge down from the highest extent in 8000 or so years.
Greenland temperature reconstruction..
Yes, it has warmed a bit since the Little Ice Age.
SO WHAT !.. Be very glad it has.
And any “guess at the future” using CO2-based climate models, is bound to be WRONG.
Begone with your facts and rationality!!!
Whose?
“It is possible to leave future generations with a healthy Greenland Ice Sheet,” he says.”
What the heck is a healthy ice sheet when it has clothes on? Do they get diseases and their health deteriorates? It is ice, for crying out loud.
There is nothing wrong with half the Greenland ice sheet melting. If sea level rises 2 metres in 1000 years, so be it. Few buildings are designed to last 1000 years. The next ones will be on higher ground. NYC downtown is already built more than 2 metres higher than the original elevation. More than 3 metres in most locations.
It is too bad so many people have lost all historical perspective.
I wonder how long it takes for the “melt” to reach the Pacific.
It hasn’t risen in the last century.
The latest MSL measurement puts it 87 mm LOWER than the first measurement in 1914:
http://www.bom.gov.au/ntc/IDO70000/IDO70000_60370_SLD.shtml
Most of the level changes of the ocean are due to interplanetary gravitational dynamics and have little to with ice melts. Looking over “sea level” change over a century in sydney harbour, its up
And down all over the place
Mr. Middleton,
How unfair of you to resort to actual facts and science.
NPR, Gavin Newsom, PBS, the WaPo, Bill McKibben, Pravda, CNN, the La-La Times, Joe Biden, MSNBC, CBS, ABC, the swamp creatures and Haaaaaaaaavard insist that you emphasize feelings.
The previous interglacial, the Eemian, was warmer and lasted millennia longer than the Holocene so far. Best guess is that the Greenland Ice Sheet’s Southern Dome melted about 25% more than at present. Its Northern Dome was about the same as now.
That’s with hippos in the Thames at London, without benefit of a Neanderthal Industrial Revolution.
Actually the hippos came as far north as Yorkshire.
And there was water buffaloes on the Rhine and monkeys in Bavaria.
We ain’t quite there yet…
Greenland’s ice is not very old. I don’t know what all the fuss is about.
Frankly I hope it becomes a temperate climate in Greenland, releasing millions of hectares of summer cropland. Florida and parts of Georgia can go under water. It will have an amazingly productive fish production capacity.
Good collection of actual data, as usual, David. I like to turn to actual historical events to get a crude idea about climate. Eric the Red moved from Iceland to Greenland (there’s a clue, the Vikings named it GREEN!) during the last of the Medieval Warm Period, around 1,000 AD. They were greatly pleased to find grass their cows could eat and set up several villages. Then the Little Ice Age kicked in and by 1,500 AD they left. So, when the Vikings return (not the NFL Vikings, they’re spiraling downward in BLM dysfunction, the actual Eric the Red relatives) we will see clearly that Greenland is returning to normal. Some of the Vikings construction is emerging from somewhat retreating ice sheets (there’s another clue). Greenland is connected to the North American Plate (the spreading ridge goes through the mniddle of Iceland), and is drifting WSW around 5 cm per year, so moving into areas of more solar energy. Wait for it. OK, don’t wait for it the movement is too slow.
Around 55,000 people live in Greenland today and 4000 or so are Danes. The peak of Vikings living in Greenland was about 5000.
It doesn’t seem like Greenland was a hotspot then or now, so it’s about normal.
They called it Greenland because naming the other place Iceland turned out to be a bad PR move. To encourage “that other place” as well it was called Vineland.
It is possible that either the Norse or an immigrant group from the north shore of Spain who landed in Nova Scotia in 1300 AD were the source of knowledge for the First Nations living on the Niagara Peninsula who had steel spring crossbows when “first contact” was made in the 16th century. The true history of European / Amerindian contact is still incomplete.
“Greenland ice free in as little as a 1000 years” – in one of the very first paragraphs. That’s when I stopped reading any further!!!
Using PIOMESS, The total Greenland Ice Mass since 1900 looks like this..
I am still amazed that a WW2 planet crashed on Greenland and when they found it was buried under 250+ feet of snow.
High accumulation on the southern dome. It wouldn’t last that far south otherwise. Remembet that the southern tip of the Greenlad Icecap is at the same latitude as St Petersburg.
All that means is that there has been 250 feet worth of snowfall. It doesn’t mean the glacier is 250 feet taller. Remember, glaciers flow.
Great analysis and data trawling, David!
Brilliant article, David. Kobashi 2017 and Vinther 2009 are excellent references.
Science is becoming mythology to people that get a lot of exposure.
I think it was you who once compared the accumulated loss of Greenland’s mass to a lot less than the mass we loose when we clip our nails. That’s quite graphical.
Thanks Javier… The coolest thing is that I just reposted portions older posts of mine.
An enormous waste of effort David – because the Greenland ice sheet is plainly going to keep losing mass.
Why wouldn’t it?
The GIS is not going to disappear in 1000 years.
It was little different from now during the long, hot Eemian Interglacial.
Hasn’t Greenland been gaining ice the last couple of years?
Not wasted, David. Most of us reading don’t have closed minds.
Whooooshhhh!
What’s that sound?
That’s the sound of the point, sailing completely past, or even through the empty-headed Griffendope’s head.
Same as it ever was.
Try to follow along.
Adapted from: A Geological Perspective of the Greenland Ice Sheet (which I intentionally didn’t use in the post, so I could use it in the comments).:
99.58% of the Greenland Ice Sheet (GrIS) has not melted since 1900.
Based on the asserted loss of ice since 1900, the GrIS has lost the equivalent of a Lake Superior-sized ice cube. However the GrIs remained larger than the Gulf of Mexico (by volume) despite losing a Lake Superior. The Gulf of Mexico has a volume of about 2.5 million km3. If the GrIS melted, the volume of water would be about 2.71 million km3. Before losing Lake Superior, the water volume was 2.72 million km3.
How does all this compare to the evolution of the GrIS in the Late Pleistocene and Holocene? For this perspective, I relied on Tabone et al., 2017. They devised a model to simulate how the GrIS has evolved over the past 250,000 years.
Who would have guessed that the “Anthropocene” GrIS is actually larger than it was during the Late Pleistocene? WUWT? X-axis is in calendar years AD(BC).
David, you should know by now, that if it goes past 1 + 1 = 2..
…. griffool CAN NOT and WILL NOT follow.
Things get beyond its capabilities, very quickly. !
The Griffian Perspective:
The Geological Perspective:
It is far easier to fool people than to convince them they’ve been fooled.
Griff does not want to admit he’s a fool because his world view will collapse.
Middle wits do this.
Empirical science is right wing politics!
David
I love to see numbers illustrated this way. I just told my son about this. He remarked that few people have any sense of proportionality and that the Lake Superior/Gulf of Mexico analogy will go over the heads of most. I would like to see people like Josh translate this into cartoons that can convey the facts to get more people to notice and think about them.
Your post was a total waste of even your PUNY effort, griffool.
As the AMO changes. It will probably start gaining mass. Why wouldn’t it. !!
There has been a slight drop since the LIA…. SO WHAT..
to be expected as the Earth, THANKFULLY, warms from the coldest period in 10,000 years.
You have seen the massive BENEFITS to sea life from the drop in Arctic sea ice slightly towards the Holocene norm, haven’t you griffool
Or are you in deep hatred of sea creatures as well as being in total climate change DENIAL. !
Greenland Ice mass, according to PIOMESS, looks like this since 1900, griffool.
STOP YOUR MINDLESS PANICKING !
Maybe because more snow may fall on Greenland during the accumulation season than melts off during the summer season. How do you know that if the climate does in fact warm that the winter storm track won’t move north and large wet snowstorms will constantly move over Greenland causing overall ice growth?
There is no melting in Greenland most months of the year, only accumulation. The temperatures are so cold there anything that falls sticks during the cold months. Ice loss is totally dependent on the 2 month melt season from mid June to mid August, which last year started later and ended earlier.
As David’s article states, it will take a very long time to exhaust the ice in Greenland. Trying to forecast out a chaotic system even 10 years is to be a fool’s errand.
Follow along: http://polarportal.dk/fileadmin/polarportal/surface/SMB_curves_LA_EN_20201001.png
You certainely assume, as some “scientists” do, the actual status is the normal one.
Nothing is more wrong than that idea..
Krishna, for your post to make any sense at all, you will have to define what YOU mean by the adjective “normal”.
“If you can’t define something you have no formal rational way of knowing that it exists. Neither can you really tell anyone else what it is. There is, in fact, no formal difference between inability to define and stupidity.” — Robert M. Pirsig, Zen and the Art of Motorcycle Maintenance
Wrong is to think, we have a climate “normal”, and if the actual status is changing, it’s bettwer or worst or whatever. As we realise, we have no “normal” we can’t be “doomed”.
In other words, why trust data, go with the models.
Don’t waste your time responding to this drivel. My buddy Griff is just throwing disruptive comments into the conversation because his Chinese masters pay him to. He doesn’t know, believe, or care a whit about CAGW no matter what it is named this week.
Ice. Snow. More ice. More snow. Winter ops. Gotta genuinely hate these words. They can kill you and those behind in more than one creative way.
And no one gets to model the benefits of more clement warmer weather. Go figure, what is that they don’t understand in the process ?
These stark conclusions come from new simulations which, for the first time,,,,,
So, we’re doomed/not doomed/maybe doomed/maybe not doomed….. My head is spinning.
In the greater schemed of things, I doubt it will make a smidgen, or even a half-smidgen, of difference. But I’ll see if I can crank out the Doctor’s Tardis and take a trip into the future, just for the heck of it.
It’s nice to know that the people who write up these stories conveniently forget real history and the real reaso those Norse guys moved to the American continent: they were starving to death.
You have a nice day, and thanks for another Exciting Story of Pending/Not Pending Doom that I can tell all my friends and relatives about….. if they ever quit giggling over the grants seekers.
No those around in 1000 years will have a nice new landmass to play on, not sure where the doom comes from.
“Unprecedented ice loss is predicted for Greenland Ice Sheet”
Be sure to let us know when those Viking farms come out of the permafrost.
You mean the “unprecedented Viking farms”?
I remember reading years ago that early visitors to Newfoundland described it as a green and temperate land. The reason I saw given for this was that the Gulf stream went up the East Coast of America, making it all much warmer. This was said to have happened during the LIA, exacerbating the cooling in Norther Europe.
Did that happen? What would it do to Greenland and Arctic temperatures? What would happen to the Labrador current?
What a great read. I particularly liked the Figure 14 and Figure 15 temperature graphs 🙂
Their 1000 year insane claim it most likely 2500% exaggerated.
From a graph and notes by Fettweise et al. 2008 I have the following (in Danish) on my weather page:
Greenland ice mass 1900-2018
Greenland has lost 0.4% of its inland ice over the last 100 years. This compares to 0.004% per year, which means that all the ice would disappear in about 25,000 years; but before then we must assume a “new ice age” spoils the chance.
Even during the long, hot MIS 11 Superinterglacial over 400 Ka, the northern GIS remained intact. It appears the the southern ice sheet melted, except for a cap on the tip, which probably existed even in the Pliocene.
https://sites.ualberta.ca/~areyes/BertoPage/Publications_files/Nature_MIS11-Greenland.pdf
Question: The numbers of the left vertical axis are listed as negative numbers in degrees Celsius. I get that the average temp on the graph is 30 C, but why are they listed this way?
This is for Fig 1
EIGHTY years?
I thought AOC said we only had TEN.
These people are idiots, and criminals. Or criminals and not idiots?
Either way, their science sucks, but I believe desperation is setting in.
Eventually they will say, “But after this glaciation ends, just think how hot it will be then.”
I love this website!
If we are doomed, why are worry? We are doomed.
These catastrophic “models” are tiresome; if we cry wolf every single day, we stop worrying about the wolf.
“why worry”, I mean.
And of course Greenland is pretty much COLDER than it has been for most of the Holocene.
Just a tiny bump out of the COLDEST period in some 10,000 years.
Been there done that several times. Grew up in California waiting for the Big One. Lived through the Ice Age predicted in the 70s. Mt. St. Helens.
Great post David, I miss the old like buttons, but this forces me to write a comment. A good thing.
Thanks Andy. I just copied it from old posts of mine and yours… 😉
1. Receive your private commission to write another piece of catastrophic climate propaganda. (do not reveal sources)
2. Select a ludicrously catastrophic outcome to terrify the public with.
3. Write your terrifying conclusion first! (NB this is important as it will be used by the BBC, Guardian, NYT, Greenpeace et al as their own screaming end-of-the-world-is-nigh headlines. The scarier the better)
4. Next, write the actual ‘study’. Use multiple worst-case modelled scenarios to map out a ‘pathway to catastrophe’, thus arriving at the catastrophic end point you set out to arrive at in the first place.
5. Ask your pals to review it for you. Buy them a beer.
6. Revel in the joy as global MSM run with your ‘definitive study’ across all platforms.
7. For bonus points hope Greta or Al personally name check your invented work of pure fiction.
8. Bathe in the glorious afterglow of your Saving the Planet virtue, as you become the centre of sciency-attention for a bit.
9. Do some easy media interviews on left-wing platforms only. Remember to slander any opposing voices and repeatedly assert ‘the science is settled’.
10. Collect another 6 or 7 figure grant for your next climate fairy story.
“5. Ask your pals to review it for you. Buy them a beer.”
5b. Say that you will pal-review one of theirs in exchange.
ps.. Imagine what would happen to you in “climate” alarmism quarters if, when reviewing a Mickey Mann paper, you DARED to suggest anything was wrong with it.
You would be ostrichised for the rest of your non-career.. (yes, I know it is spelt incorrectly)
Well, sea level is rising and the water has to be coming from somewhere. Good bets in order of amount: Antarctica, Greenland, alpine glaciers, and maybe ground water extraction. Thermal expansion is probably bullshit.
Are Antarctica and Greenland melting? Considering that it was shown that the average temperature of Greenland is -30°C Uhm probably not. Losing ice because more ice calves into the sea than snow that fell on the interior? Well maybe that just could be.
Not that it really matters, but:
“Considering that it was shown that the average temperature of Greenland is -30°C Uhm probably not.”
A bit of surface ice may occasionally melt in late summer, but normally compensated for via white global warming in the winter.
Carl Friis-Hansen October 2, 2020 at 7:24 am
And most winters the sun melts the ice on my roof, and as soon as the melt water flows over the eaves, it re-freezes into icicles. The so-called main stream media is forever showing us rivers of Windex flowing into moulins and claiming it flows to the bottom and produces lubrication which in turn accelerates the ice flow and iceberg calving process. And of course they imply that this has never happened before.
From my list of tag lines, quotes etc:
Observing something for the first time, doesn’t mean it has never happened before.
It has been observed before. It was all observed and described in detail by Nordenskiöld during the first ever scentific exploration of the icecap in 1883.
Here is a map of the area he explored with meltwater rivers, lakes, moulins etc:
http://runeberg.org/polexp1883/0233.html
http://runeberg.org/polexp1883/0234.html
But of course modern scientists don’t read old literature. I mean Nordenskiöld may have been the first to travel the Northeast Passage, and the first to cross a major icecap (on Svalbard), but he was not in the least woke.
Steve
Typically, those surface cracks close at the depth at which the ice behaves plastically instead of brittlely. So, melt-water may reach bedrock at the margins where the ice is only a couple hundred feet thick. That might result in some erratic acceleration of ice streams at the margins, in the Summer, but probably have little impact upstream, where basal friction is more important than any claimed buttressing. The movement of ice can be very complex over an irregular terrain, having low pockets of stagnant ice, and ice shearing up over ridges or around monadnocks.
The subglacial topography of Greenland makes it pretty well impossible for the ice sheet to collapse…
The vast bulk of Greenland has been unusually cold all this summer.
Are they saying Greenland will be Green again. The Artic well be Ice Free. Renewed Shipping Lands will open. All according to computers model with how many variables?
I seem to remember Big Al said the Artic would be “Ice Free” by 2009.
” It’s thought that the Sangamonian (Eeemian) interglacial was at least 5 °C warmer than today and Greenland retained much of its ice. “
If anything more as a matter of fact, here are the relevant proxy data from the Eemian of Greenland that I know of:
Site: NEEM, Lat: 77.45 Proxy: Oxygen Isotopes. Temperature rise: 8 degrees
Reference: NEEM Community Members 2013. Eemian interglacial reconstructed from a Greenland folded ice core. Nature 493:489-494.
Site: Thule, Lat 76.50 Proxy: Pollen, Insects. Temperature Rise: 4 degrees (warmest month)
Reference: Bennike O, Böcher J. Early Weichselian interstadial land biotas at Thule, northwest Greenland. Boreas. 1992;21:111–118.
Site: NGRIP, Lat: 75.10 Proxy: Oxygen Isotopes. Temperature rise: 5 degrees
Reference: North Greenland Ice Core Project Members. 2004. High-resolution record of Northern Hemisphere climate extending into the last interglacial period. Nature 431 : 147 – 151.
Site: GISP2, Lat: 72.57 Proxy: Oxygen Isotopes. Temperature rise: 6 degrees
Reference: Yau, A. M. et al 2016. Reconstructing the last interglacial at Summit, Greenland: Insights from GISP2. PNAS http://www.pnas.org/cgi/doi/10.1073/pnas.1524766113
Site: GRIP, Lat: 72.57 Proxy: Oxygen Isotopes. Temperature rise: 5 degrees
Reference: Johnsen SJ, Dahl-Jensen D, Gundestrup N, Steffensen JP, Clausen HB, Miller H, Masson-Delmotte V, Sveinbjörnsdottir AE, White J. 2001. Oxygen isotope and palaeotemperature records from six Greenland ice-core stations: Camp Century, Dye-3, GRIP, GISP2, Renland and NorthGRIP Journal of Quaternary Science 16 : 299 -307.
Site: Renland, Lat: 71.30 Proxy: Oxygen Isotopes. Temperature rise: 5 degrees
Reference: Johnsen SJ, Dahl-Jensen D, Gundestrup N, Steffensen JP, Clausen HB, Miller H, Masson-Delmotte V, Sveinbjörnsdottir AE, White J. 2001. Oxygen isotope and palaeotemperature records from six Greenland ice-core stations: Camp Century, Dye-3, GRIP, GISP2, Renland and NorthGRIP Journal of Quaternary Science 16 : 299 -307.
Site: Jameson land, Lat: 70.50
Proxy: Plants. Temperature rise: 5 degrees (warmest month)
Reference: Bennike O, Böcher J (1994) Land biotas of the last interglacial/glacial cycle on Jameson Land, East Greenland. Boreas 23:479–487
Proxy: Insects. Temperature rise: 6-11 degrees (warmest month)
Reference: Böcher, J. (2012). Interglacial insects and their possible survival in Greenland during the last glacial stage. Boreas, 41(4), 644–659. doi:10.1111/j.1502-3885.2012.00251.x
Proxy: Mollusces, Forams. Temperature rise: 3 degrees (SST, warmest month)
Reference: Funder, S., Hjort, C., Landvik, J.Y., Nam, S.I., Reeh, N., Stein, R., 1998. History of a stable ice margin—East Greenland during the Middle and Upper Pleistocene. Quaternary Science Reviews 17, 77–125.
Site: Pakitsoq, Disko Bay, Lat: 69.44 Proxy: Oxygen Isotopes. Temperature rise: 4 degrees
Reference: Reeh, N., Oeter, H., Letreguilly, A., Miller, H., and Hubberten, H.-W. (1991). A new detailed ice-age oxygen-18 record from the ice sheet margin in central west Greenland. Global and Planetary Change 90, 373-383.
Unfortunately no data from southern Greenland.
So it would seem that the annual temperature was at least 5 degrees warmer, than now, particularly in North Greenland, that winter temperatures probably rose more than summer temperatures, and temperatures on land more than SST.
“The widget generates CMIP5 or PMIP3”
So we have Chimp and Pimp. Even a misreading of the acronyms gives you a good idea if the usefulness of the models.
Well, all very interesting, but it’s much simpler than all of that.
What’s with all the billions & billions?
Just a big number to impress the science illiterate reporters and proles?
Appropriate scientific short hand would use Giga-tonnes, Gt, which amounts to the same thang. Also a km^3 of water.
The land mass of Greenland is covered by 2.6 to 2.8 MILLION Gts of ice and snow.
8,800 Gt is 0.326%!!
35,900 Gt is 1.33%!!!!
BFD.
Nick
All this feigned concern for “billions of tons” of ice loss, and simultaneously, apparently “billions of tons” of ocean water are consumed by subduction.
https://scitechdaily.com/each-year-billions-of-tons-of-ocean-water-falls-into-the-deep-earth-lower-mantle-where-it-has-extraordinary-oxidation-power/
It’s a race between post modern ‘journalism’ and climate science to alarm and extrapolate the worst case scenario without full explanation of that scenario and its construction.
Anthony: I’m a PhD Environmental Science & Engineering, MS,BS Chemist. I don’t study graphs from the raw data shown in the NOAA report. I do a more advanced process of statistics and mathematical data fits that is a method proven in chemistry to study chemical reactions giving clearer view of the situation. If you are interested, we can join, and I can show you the method used in data of brainwaves and EKG’s, which I used to study better sleep disorders and onset of diabetes, heart disease. We would need to access the raw NOAA data that build the graphs. I believe it can help us improve understanding the data. This is a method that I developed and haven’t published yet. My email: [redacted by AW] Thanks
A great post, David! In your comments, there is a figure which seems to show an accelerated ice loss between 2002 and 2017, which would amount to about -0.13% in 15 years, or 0.0087% per year. Even if that ice loss were to continue indefinitely, it would take about 11,500 years to completely melt Greenland’s ice cap.
Of course, this assumes there is no future Little Ice Age between now and the year 13,520 which would reverse the trend. There was a warm period during the Roman Empire, followed by a cooling, then another Medieval Warm Period, followed by a cooling. Two cooling trends in the last 2,000 years, so it is likely there will be several cooling trends in the next 11,500 years!
When we hear alarming reports that “an iceberg the size of Manhattan calved into the sea”, these events are observed in summer, when there is daylight nearly all the time (or some very short nights, depending on latitude). But those who observe these summer calvings are not there all winter, when repeated blizzards dump more snow on the ice cap, mostly in darkness. Just because there is no one around to watch the snow doesn’t mean it didn’t fall.
The snowfall is likely heaviest along the east coast of Greenland, since the Gulf Stream brings enough warm water northward to keep the ocean to the east mostly ice-free for most of the winter, while mainland Greenland is bitterly cold without any sunlight, and the high altitude of the ice sheet. Storms tend to track just off the east cost of Greenland in autumn and winter due to the sharp temperature difference between the ocean and land (similar to the nor’easters along the Atlantic coast of the United States), with an ample supply of moisture from the open ocean to generate snow over the land.
clever title, but why are only “Greenland is doomed” headlines sarcastically offered – over and over – when there is no science over the years showing the opposite? (i.e., that Greenland has stabilized or is growing over terms more than a year)
just curious. I would seem biased unless there is a good reason. 🙂
If 4000 years of ice accumulation has been reversed, to whom do we credit the saving of the world from a glacial periord? Coal miners, oil drillers, Henry Ford? Or all of them?
Or of course, none, as it both ups and downs are natural variations.
If my slide rule can be trusted it takes 360 billion tons of melted ice to raise sea level one millimeter.
So nothing to worry about !
Cheers
Mike
Someone please help me out; seriously.
See FIGURE 1 of the paper.
In Fig 1, from about 9000 BC to about 7000 BC (roughly 2000 years ) the temperature record shows warming of about 12 C over that time period.
Can anyone please explain what caused that warming?????
A similar, but smaller warming magnitude occurred from about about 4500BC to about 2500 BC (roughly 2000 years); the temperature record shows about a 4 C warming over this period.
Can anyone please explain what caused this warming??
I assume that volcanic activity caused periods of cooling; but does not the cooling affects of volcanic activity cease after a few years; say, 2 to 5 years as the dust / debris falls out of the atmosphere thus once again allowing “normal” sunlight to reach the earth’s surface?
So what caused the several periods of cooling shown in FIG 1. that lasted from 1000 to 2000 years??
And once again, for the nth time, what caused the Medieval Warm Period?
Look forward to a response; any response.
I seem to recall that RCP8.5 is basically impossible as there are not enough reserves of fossil fuel to consume at RCP8.5 growth rates for another 80 years.
It took a while to assemble the idea that CO2 categorically does not have a role to play in climate and sea level changes.
Many a model has been destroyed by the drill or euphemistically called ‘the rotary lie detector’. The climate change sea level change argument, in my view, cannot get past the results from three deep ice core holes in Greenland Dye 3, GRIP and GISP2.
The drilling stats are as follows:
Hole Elevation (m) Total Depth (m)
GRIP 3200 3028.8
GISP 2 3208 3055
Dye 3 2479 2035
Each of these core holes reaches basement with GRIP finishing just below current sea level and the other two slightly above.
Work done the bottom of GRIP and Dye 3 in terms of microbiology indicate that a temperate climate consisting of conifer forests existed some 450,000 years ago and stretching back another 400,000 years.
(Willerslev E et al; Ancient Biomolecules from Deep Ice Cores Reveal a Forested
Southern Greenland Science. 2007 July 6; 317(5834): 111–114. doi:10.1126/science.1141758.)
The climate was about to enter the next glacial period. However, sea level was then 100 metres below the current position. Miller KG et al, The Phanerozoic Record of Global Sea-Level Change. Science 25 November 2005: Vol. 310. no. 5752, pp. 1293 – 1298 DOI: 10.1126/science.1116412.
The CO2 level from Vostok was about 290 ppm at the same time i.e. 450,000 years BP when ice began to accumulate onshore Greenland: http://www.ncdc.noaa.gov/paleo/indexice.html.
Ice accumulation continues to the present day unhindered and unchanged through sea level changes; CO2 variations, 4 glacial periods and 4 Milankovitch cycles. At the peak of each of the cycles temperatures in excess of freezing were evident. Both the Arctic and indeed the Antarctic the rate of accumulation of ice continued without a break and at the same periodic rate with no evidence of melting when temperatures were at their peak. There were changes to finer points of ice stratigraphy but nothing to stop the inexorable rate of accumulation.
From your blog you do not appear to have drawn the distinction between the unbroken record of ice accumulation of at elast 430,000 years in both the Arctic and Antarctic and thaqt of the ‘temporary’ ice adavances and retreats associated with the glacial and interglacial periods.
The intriguing aspect of all of this is that from 450,000 years the climate in permanent ice areas in both Greenland and Antarctica remained constantly increasing.
Another curious fact is that the sea level rose some 100 metres when there was no ice to begin with from Greenland and there was no evidence of melting of the permanent ice from Antarctica.
The outstanding questions are where did the water come from to enable the oceans to rise 100 metres and also what caused the ice to begin to accumulate in Greenland and continue for some 450,000 years without a break at both ends of the Earth?
I enjoy your blogs.
Shriek.
Run for the hills.