
Chris Slocum, Colorado State University
Hurricane Laura blew up quickly as it headed for the Louisiana coast, intensifying from a tropical storm to a major hurricane in less than 24 hours. By the time it made it landfall, it was a powerful Category 4 hurricane with 150 mile-per-hour winds.
The Atlantic has seen several hurricanes rapidly intensify like this in recent years.
In 2018, Hurricane Michael unexpectedly jumped from Category 2 to Category 5 in the span of a day before hitting the Florida Panhandle. Hurricanes Harvey, Irma and Maria in 2017 also met the definition of rapid intensification: an increase of at least 35 miles per hour in a 24-hour period. Based on preliminary reports from the National Hurricane Center, Laura gained 65 mph in one 24-hour period and, more impressively, added 80 mph from Aug. 25 to Aug. 27.
But do all these fast-growing, powerful storms in recent years mean rapid intensification is becoming more common?
With information about hurricanes coming through social media and phone apps, that’s a question hurricane scientists like myself are hearing a lot. It’s useful to consider a few things: the history of U.S. hurricanes, why the Atlantic is currently so active, and the ingredients that allow storms to strengthen so quickly.
What makes storms blow up?
Just as a pastry chef needs all the ingredients to successfully make a cake, storms like Laura need favorable conditions to be able to form and rapidly intensify.
Three key ingredients help a hurricane rapidly intensify:
- Warm ocean waters. Hurricanes draw energy from warm surface water, particularly when it’s at least 80 degrees Fahrenheit or warmer.
- Ample moisture, or water content in the atmosphere, to maintain clouds.
- Low vertical wind shear. This is a measure of how the wind changes speed and direction with height in the atmosphere. High wind shear will disrupt the clouds, making it hard for the storm to stay together.
When all of these ingredients are present, vigorous thunderstorms can form and organize, allowing a robust eyewall to develop. Large-scale changes in ocean temperature, like the El Niño–Southern Oscillation and the Atlantic Multidecadal Oscillation, can also have an impact on hurricane activity.
Because these ingredients change, the Atlantic hurricane season varies year to year. This year, as the seasonal forecasts created by Colorado State University and the National Oceanic and Atmospheric Administration warned, the ingredients are favorable for an active season with more major hurricanes. A review of storms from 1981 to 2012 found that 70% of major Atlantic hurricanes – those reaching Category 3 or higher – had gone through rapid intensification. https://www.youtube.com/embed/9-_obMEF_2o?wmode=transparent&start=0
Why don’t all storms grow this quickly?
Just having the right water temperature and moisture won’t ensure that storms will undergo rapid intensification or become major hurricanes.
We saw that with Hurricane Marco. It swept through the Gulf of Mexico just ahead of Hurricane Laura but weakened to a tropical storm before landfall.
A big difference was the wind shear. The thunderstorms powering Marco’s core struggled to stay connected to its circulation as high wind shear in the Gulf of Mexico stripped them away.
When then-Tropical Storm Laura passed over Cuba into the Gulf, the high wind shear conditions had receded, leaving nothing but a favorable environment for Laura to develop catastrophic winds and a dangerous storm surge.
As with ice skaters who pull their arms in during a spin to rotate faster, the thunderstorms of Laura’s eyewall pulled in the atmosphere around the storm, causing the winds to accelerate into a high-end Category 4 storm. While there are additional complexities to this process, a theoretical framework for intensification that I further developed with colleauges highlights how the location of eyewall thunderstorms relative to the storm’s maximum winds triggers rapid intensification. This theory has been supported by eyewall observations collected during “hurricane hunter” flights.
So, are these events becoming more common?
This is a challenging question and an active topic of research.
Because rapidly intensifying hurricanes are fairly rare, there isn’t enough information yet to say if rapid intensification is happening more often. The hurricane research community has consistent, reliable observations of storm intensity only since the start of the satellite era and routine storm-penetrating “hurricane hunter” flights since the 1970s.
We have seen more rapid intensification events in recent years, and some scientists have concluded that the warming climate is likely playing a role. However, we’ve also had more active hurricane seasons in those years, and more work needs to be done in this area to understand global trends, such as why hurricanes are crossing ocean basins more slowly.
To try to answer this puzzle, hurricane researchers are using historical records to help refine mathematical theories and computer simulations of storms to better understand rapid intensification. The new knowledge will continue to improve forecast guidance and lead to a better understanding of how hurricanes will change in an evolving climate system.
[Deep knowledge, daily. Sign up for The Conversation’s newsletter.]
Chris Slocum, Physical Scientist, NOAA and Cooperative Institute for Research in the Atmosphere, Colorado State University
This article is republished from The Conversation under a Creative Commons license. Read the original article.
I have read that the very hot loop current in the gulf of Mexico can quickly super charge a hurricane. Especially if it goes across one the eddy’s. I remember it being said that is what pumped up Katrina
“very hot loop current ”
That’s due to ocean heat content. The SST is closely related, but ocean heat content correlates more strongly to rapid intensification than SST. For example Patricia had one of the most rapid intensifications in history thanks to double the normal OHC: https://journals.ametsoc.org/bams/article/98/10/2091/70040
Here is what i’m referring to https://en.wikipedia.org/wiki/Loop_Current
My reading of the wind speeds of Laura at land fall is that they were less than 200 everywhere. Yes. Gust were higher. Buy you don’t use gusts to measure wind speed
Less then 150 you mean?
” By the time it made it landfall, it was a powerful Category 4 hurricane with 150 mile-per-hour winds. ”
I have not seen any ground evidence of category 4 damage, it ground readings of a cat 5 rating for Laura.
This might be the only trend. Here in Australia 100 years ago, a Cat 4 would still be pulling out telegraph poles 100 miles inland. Now a Cat 5 pulls off a few rooves and some guttering soon after landfall.
Funnily enough, no research shows rapidly weakening hurricanes after land fall getting worse due to global warming.
I meant less than 100!
There is a correlation between solar flares or CME’s hitting the earth sparking (no pun intended) rapid intensification of tropical storms and typhoons/hurricanes. Not sure about this one, but many a very strong typhoon/hurricane forms or intensifies immediately after a solar event.
Additionally there are all kinds of other reasons a TS can increase or decrease intensity. What we really need are more “computer simulations” to help us figure this all out. I’m sure whatever they come up with will be 97% correct.
Smart man. Low pressure systems can do a lot to a climate system. Just look at what is going on this week in the USA. Throw in loading the dice and their location due to certain factors, and the sun strongly influencing the ENSO and other teleconnections, and you have climate swings.
“ This is a challenging question and an active topic of research.”
I always cringe when statistical analysis and scientific research become conflated in the minds of the “researchers”.
“Study” is meant, but we’re too late to undo decades of such conflation.
Hypothesis: The Earth’s on-going weakening geomagnetic field allows tropical cyclones (TC’s) to spin with less magnetic backforce resistance. Additionally geomagnetic storms disturbing the quasi-steady state local geomagnetic field lines, allows in the short term for TC strengthening events if other physical conditions for the TC’s intensification are also present (low wind shear aloft, favorable SST, etc).
Background: Hurricanes are large convective heat engines where water is the working fluid. The eenrgy is derived from water changing between 2 physical states (liquid, to gas, back to liquid) where heat is transported and released between two temperatures regimes, T1 at the SST surface and T2 at the tropopause-stratosphere boundary layer. The work and efficiency of this heat engine is modeled as a Carnot Cycle.
Water is a polar molecule, and along with significant amounts of sodium and chloride ions near the surface, becomes a spinning solenoid with a generated TC magnetic field lines that are resisted by the local Earth’s geomagnetism. The Atlantic basin is particularly susceptible to this effect due to the current configuration of the geomagnetic field lines in the western Atlantic, Carribean, and Gulf of Mexico. (see link below for NOAA?NGDC declination field lines.)
NOAA has built this Java-enabled map of historical magnetic declinations which allows a visualization of how the geomagnetic field lines have changed over the past 430 years as the calculated position of the Earth’s poles have moved. Note: this map is only isogonic lines but does not depict the weakening of field strength that is also on-going. The spacing between the isogonic lines indicates a gradient in the field, but not it’s strength.
https://maps.ngdc.noaa.gov/viewers/historical_declination/
A total field intensity map is here (warning: 3.1 Mbyte pdf file):
https://www.ngdc.noaa.gov/geomag/WMM/data/WMM2020/WMM2020_F_BoZ_MILL.pdf
(to be continued as “replies,” to avoid “awaiting moderation” snags).
As a physical mechanism, Gauss’s Law is the governing equation and Biot-Savart Law in particular for Hurricanes.
Gauss’s Law explained:
https://en.wikipedia.org/wiki/Gauss%27s_law_for_magnetism
Biot-Savart Law explained:
https://en.wikipedia.org/wiki/Biot–Savart_law
Past work by others:
Substantial rigorous physical modeling and effort has been done in this area by others regarding modeling the static magnetics and the much more difficult magnetohydrodynamics of tornadoes and other mesoscale-supercell thunderstorm systems within a local geomagnetic environment.
Here:
https://www.scribd.com/document/45838943/Supercell-Thunderstorms-and-Tornadoes-An-Electromagnetic-and-Thermodynamic-Approach#
And here (particular note should be taken of the graphical depiction in Figure 2 of this manuscript):
https://agupubs.onlinelibrary.wiley.com/doi/pdf/10.1029/97JD00146
And here, (paywalled sadly) a more general treatment of the Lorenz Force generated by the circular motion of charged particles in a magnetic field in atmospheric vortex phenomena.
https://www.sciencedirect.com/science/article/abs/pii/S0304388607000484#!
(to be continued as “replies,” to avoid “awaiting moderation” snags from too many URLs).
A very good primer on this magnetic phenomenon was written by Robert A Dickerson, PhD produced I believe around 2005- or 2006.
PHENOMENOLOGICAL ANALYSIS OF FORCES IN HURRICANE DYNAMICS
Robert A Dickerson, PhD
download pdf at:
https://ams.confex.com/ams/pdfpapers/107571.pdf
The magnetics part of his work is the 2nd half of this paper. The first half is on the development of the Coriolis effect that primarily drives TC spin effects.
I need to add to support the hypothesis above:
The Earth’s geomagentic strength has declined about 9% over the last 200 years.
“Earth’s Magnetic Field Is Weakening 10 Times Faster Now”
https://www.livescience.com/46694-magnetic-field-weakens.html
In the figure in the above Live Science article, we can we see that the geomagnetic field has decreased in intensity most of the Western Hemisphere. Here:
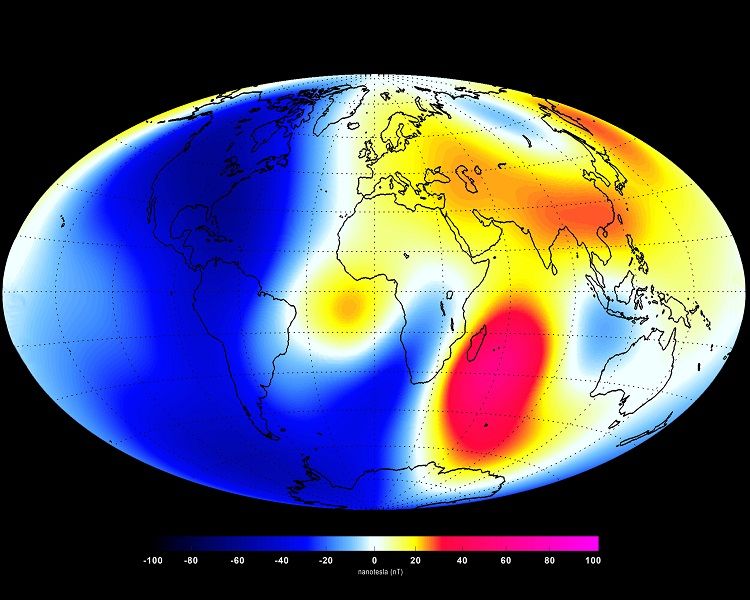
And from NOAA they show the current annual rate of change (in nanoTesla, nT) of the z-component of the Earth’s magnetic field.
https://www.ngdc.noaa.gov/geomag/WMM/data/WMM2020/WMM2020_Z_SV_BoZ_MILL.pdf
That rate of change (in nanoTesla, nT) in the DownComponent (Z) of Earth’s magnetic field is between -100 nT/yr to -200 nT/yr across the Atlantic Basin hurricane development region and into the Gulf of Mexico.
Pseudoscience hurricane atmospheric scientists like Emmanuel Kerry at MIT just keep ignoring this reality of a changing geomagnetic field strength explanation and keep on claiming “climate change” as the reason for more intensification TC episodes, like some carnival barker. But the geomagnetic explanation is far more persuasive if someone were to actually follow the data on this subject.
“It is difficult to get a man to understand something when his salary depends upon his not understanding it.”
– Upton Sinclair
If I’m going to diss that MIT climate carnival barker I should at least get his name right, “Kerry Emanuel”, MIT’s head climate clown.
Joel,
Regarding the various loose connections between storms and the Earth’s magnetic field lines, In recent months I have been frequently looking at the global wind patterns and major gyres (not just the tropical ones) in the mobile radar app I use. I have noticed in those same months that frequently and perhaps constantly there is a high speed gyre just off the coast on Antarctica, straight south of the center of Australia. This seems to be the same location as the magnetic South Pole per that map. Is this a coincidence?
ThinAir,
Do you see a corresponding Northern Hemisphere gyre in Siberia, north of Lake Baykal?
The depiction of the 2020 Z-component of the geomagnetic field (downward pointing) is here:
https://www.ngdc.noaa.gov/geomag/WMM/data/WMM2020/WMM2020_Z_BoZ_MILL.pdf
(warning: 3 Mbyte file download)
The current year, 2020, we find an active season.
(The “number of named TC” is a BS metric since NHC changed their naming methodology recently)
I graphed the planetary Ap index for the current Atlantic TC Season to date.
Also I used the NOAA tropical cyclone archive to create an Index number for the current Hurricane Season and plotted that as well.
The plot is at this link for your viewing pleasure:
https://drive.google.com/file/d/1cDv_e97ePCBR_Z3Qq8oBEBQsVbSiPFVo/view?usp=sharing
The plot of the planetary Ap index is from NOAA’s SWPC from 1 June to 5 September, 2020.
A graphical plotting at SWPC of station and global K and A indices for the last 30 days is here:
https://www.swpc.noaa.gov/products/station-k-and-indices
and the historical Ap index data I plotted was taken from the SWPC FTP Warehouse at the NCEI link listed on that page.
Summary of hypothesis and predictions:
I see clear evidence that tropical cyclone formation and intensification episodes increase when the Ap geomagnetic index spikes. This is a clear indication that Atlantic basin TC’s respond to geomagnetic influences. Thus their is evidence to support the work of others that tropical cyclones are influenced by the geomagnetic field and its changes. Perturbations in the z-component of the local geomagnetic field in which the Tropical Cyclone is spinning is essentially a “pumping the gas pedal” by reducing the Lorenz force that opposes an intensification. A weaker static geomagnetic field (Z-component) will come under more influencing perturbations from geomagnetic storms.
Hypothesis prediction: If on-going the global geomagnetic field continues to weaken in the coming decades, these tropical cyclone intensification and formation events will also increase.
On the land the wind speed were much lower, ie when compared to old Hurricanes.
At Cameron the sustained highest wind speed was 101mph and gust of 127mph.
It also had a higher pressure than most of the oldeer storms coming in at 17th.
I wonder where this one will go?
https://www.ventusky.com/?p=23.7;-39.0;4&l=rain-3h&t=20200913/0000
Odd the website shows it already having hurricane winds but NHC still shows it as just a disturbance.
Depends on the model.
Supposed to be a fish storm

That’s my bet too.
“A review of storms from 1981 to 2012 found that 70% of major Atlantic hurricanes – those reaching Category 3 or higher – had gone through rapid intensification.”
“Because rapidly intensifying hurricanes are fairly rare”
Uhhh, 70% is rare?
If, for example, there were 10 storms in those 31 years, 7 of them, making 70%, would still perhaps not provide enough data to generate much insight. Then again, perhaps there just isn’t enough of the right kind of data to provide the confirmation bias being sought.
It was a sudden intensification. Then again, so was the prediction that it was going to intensify.
I guess it all depends on what time frame you are considering. It was forecasted by the NHC to be a 90mph hurricane four days earlier, 11pm forecast Saturday night. They bumped it up as the intensification intensified.
In one place he says that 70% of major hurricanes go through rapid intensification. Then a few paragraphs later, he says rapidly intensifying hurricanes are fairly rare. So which is it?
70% is rare on an inverse logarithmic scale /sarc
Is the water any warmer ? Few weeks ago I was on a Texas beach and the water was warmest I have ever felt there.
I live on S Padre Island. Monitor the offshore buoy report nearest the Island. It has been below average all summer. I also believe the weather has been noticeably cooler than last year, and until the last week mostly lower humidity.
“Warm ocean waters. Hurricanes draw energy from warm surface water, particularly when it’s at least 80 degrees Fahrenheit or warmer.”
If you will permit, I would like to add something to this. The warm waters can’t be just the top foot or two of the ocean. If it’s just the surface, then the storm will exhaust the stored energy quickly. When the warm waters goes deep, there is energy for the storm to continue and to grow, not just form.
I like MarkW point, mentioned something about surface in last post about paper on ocean carbon uptake. Sever Hurricane Celia (1970) was a broad storm, saw horizon to horizon lightning, came ashore at Port Aransas more like a very wide tornado, highest winds in rear. Laura, like the song better, apparently killed the Lake Charles radar when the front part hit. Since storm waves reach far down moving fish around, I have long thought that they needed more T-S profiles. Hurricanes are idiosyncratic, different personalities, if you like and there are papers on lightning and hurricane strength.
As to the warm Texas beach, early norther, wind out of north, but not very strong. Never seen more recent data on number of northers reaching Gulf per month, how far they penetrate and what are the heat budgets. We had one in August, not unknown, moves fish around.
The highest sustained (not gust) wind readings I could find during Laura’s landfall was 98mph.
Likewise observation damage I have seen show at best a strong cat 2 or weak cat 4
Storm surge was only 50 percent of predicted.
Weak cat 3
If it realy was a cat 4 storm, it disintegrated Immediatly at land fall.
Well the African wave train has hit it’s stride in what the alarmists and their press are already calling a “record season” simply based on the number of named storms, despite the fact that for the last few years storms are being named that would have never been named before and so that certainly isn’t objective criteria.
But when the news isn’t as bad as it was hyped to be they have to fabricate something to keep the hype going.
As long as the waters remain relatively warm off the gulf and eastern coasts of the US, the potential for near shore amplification will remain. But that is not a function of more warm water, but a function of the location of the warm water. If there is some “science” that says that climate change will cause pockets of warmer than usual water to concentrate off certain coast lines I have not seen it. If there is, then I would be interested to see the explanation a the mechanics/physics that causes the warm water to concentrate off the coasts due to climate change.
Oh! BTW any claims of this tropical cyclone season being especially bad due to climate change are hoarse hockey since the global ACE is well below average. http://tropical.atmos.colostate.edu/Realtime/
It’s simply not true that Hurricane Laura was a Cat 4 when it made landfall, it was barely a Cat 3. See Dr. Cliff Mass’s post. The article states that rapidly intensifing storms are rare and there is insufficient statistics to say if they’re becoming more common. In the very next paragraph it concludes that we have seen more of them in recent years. So, insufficient statistics but we somehow know that we’ve seen more? LAUGHABLE. The energy that powers hurricanes comes from temperature DIFFERENCES between higher air and near sea surface temps, NOT from the sea water surface temp alone. It’s a fundamental law of thermodynamics. Look up Carnot efficiency.
More likely the cooler temps of a borderline La Nina reduced wind shear. There are reduced east pacific hurricanes as a result. These extremely localized observations that are a small subset of global climate are not really useful in climate change discussions. When El Nino spins up again, suddenly the lack of hurricane stories will be replaced by warmer pacific SSTs. It’s getting ridiculous.
MarkW
Was correct to question his statement.
However the temperature of the water at the base of the Cyclone is not an imperative and the reason the cyclone exists in the first instance. They remove heat from the footprint, but the temperature of the footprint after rotating mass occurs is not critical as confirmed when with the mountainous terrain of Hispaniola preventing it from strengthening, but did not kill it. Yes they weaken, but they do not stop.
The authors conclusions are shallow ( no pun intended) by his defining statement on key ingredients. These are the Hurricane industries go to statements and are inadequate. Dr Judith Curry has clearly stated that the cause of rapid intensification is not known.
Three key ingredients help a hurricane rapidly intensify:
1 – Warm ocean waters. Hurricanes draw energy from warm surface water, particularly when it’s at least 80 degrees Fahrenheit or warmer.
2- Ample moisture, or water content in the atmosphere, to maintain clouds.
3 – Low vertical wind shear. This is a measure of how the wind changes speed and direction with height in the atmosphere. High wind shear will disrupt the clouds, making it hard for the storm to stay together.
Really, this is all it takes to make a Tropical cyclone. Perhaps the author could explain Hurricane Alex in January 2016 in the high latitude Atlantic. Rare, but still needs explaining.
https://en.wikipedia.org/wiki/Hurricane_Alex_(2016)
Hurricanes exist (form, intensify and rapidly intensify) primarily from the rate and intensity of tropical convection in the equatorial region. Three hurricanes existed during Laura’s life
Laura – Aug 20th to 29th – 23rd TS – 25th Cat 2, 26th peak Cat 4 – 27th landfall
Typhoon Bavi – Aug 21st to 27th, – 22nd severe TS, 24th Cat 2, 25th Cat3, 26th hit land
Marco – Aug 20th – 25th – peak 23rd cat 1
Marco was simply eaten by Laura as it was down wind, which consumed its energy source – convection. The same applies to the weakening of Hurricane Genevieve in the East Pacific, again down stream.
The cyclone community needs to add the critical point 4 – Convection – the primary driver.
Convection is the key driver of tropical cyclones both in the immediate vicinity, and globally. Convection is not a constant, it occurs in surges of immense capacity, it is these surges that cause the formation to Tropical storm and most importantly rapid intensification, aided by local conditions points 1 to 3 above, and the Gulf is a prime spot for rapid intensification.
From Wikipedia
On August 23, Laura attained large amounts of convection but still appeared ragged on satellite imagery, with the mountainous terrain of Hispaniola preventing it from strengthening. Later that day, however, Laura managed to resume strengthening.[203] Early on August 25, Laura entered the Gulf of Mexico and became a Category 1 hurricane at 12:15 UTC on the same day.[204] After its upgrade to hurricane status, Laura began explosively intensifying, reaching Category 2 status early the next morning.[205] Laura’s explosive intensification continued, and at 12:00 UTC on August 26, it became the first major hurricane of the season, with 1-minute sustained wind speeds of 115 mph (185 km/h).[206] Six hours later, it was further upgraded to Category 4 status, boasting winds of 140 mph (220 km/h).[207] Following its upgrade, Laura continued to rapidly strengthen due to favorable conditions, reaching a peak intensity with 1-minute sustained winds at 150 mph (240 km/h) and a minimum central pressure of 937 mbars, at 02:00 UTC on August 27, as the storm was nearing landfall.[208] At 06:00 UTC, Laura made landfall near Cameron, Louisiana, with 1-minute sustained winds of 150 mph (240 km/h) a central pressure of 938 mbar (27.70 inHg),[209] tying the 1856 Last Island hurricane as the strongest land falling hurricane on record in the state of Louisiana since 1851
Of great interest is the reduction in global wind speed.
With regards
Martin
Marco was not “eaten” by TS Laura.
Marco’s convection core was shredded by SW upper levels winds that sheared it off the storms to the North East while the low pressure was south of New Orleans . It simply lost its convection engine core swept away to over Alabama.
When Marco was shredded in the early hours of Monday 24 August, TS Laura was still on the south side of Cuba over 700 miles away, it wasn’t even in the Gulf of Mexico at that time. That distance is more than enough to separate the two systems influences on each other considering that Marco emerged off the Yucatan while Laura came across the atlantic and Carribean before entering the GoM.
No No No on Michael that was a classic and Harvey and Laura too and rapid feedback, Go to weatherbell.com posts before that. all 3 of them were right out of Dr John Lee tropical meteo class I took in 1976 ( Lee was an FSU PHD and one smart cookie.. I still bow down when I see him in town). , My goodness that was textbook, busting a trough, JMA loaded with VV ideas and MJO phase 2 just like Michael and Laura. . Harvey also, Here I just wrote on this, and went back to the 1944 hurricane season
https://www.cfact.org/2020/09/04/its-the-nonsense-not-the-climate-that-is-reaching-extremes/
You folks might find the metrics I have developed by no one cares about, average ace/storm in seasons and decadal impact scores then again maybe not. But heh que sera, ce le vie. etc
“We have seen more rapid intensification events in recent years, and some scientists have concluded that the warming climate is likely playing a role. However, we’ve also had more active hurricane seasons in those years, and more work needs to be done in this area to understand global trends,”
Thank you Chris Slocum. Since you are with NOAA and Colorado State, surely you know Tom Knutson and if Knutson etal 2010 is still the climate science position on the impact of AGW on tropical cyclones then a single season in a single cyclone basin does not contain any useful information on a relationship if any between AGW and tropical cyclones.
Please see
https://tambonthongchai.com/2019/11/14/hurricane-obsession/
Rapid intensification is not becoming more common, our ability to record has become far better than it ever was.