Reposted from Dr. Judith Curry’s Climate Etc.
Posted on August 25, 2020
by Ross McKitrick
Two new peer-reviewed papers from independent teams confirm that climate models overstate atmospheric warming and the problem has gotten worse over time, not better.
The papers are Mitchell et al. (2020) “The vertical profile of recent tropical temperature trends: Persistent model biases in the context of internal variability” Environmental Research Letters, and McKitrick and Christy (2020) “Pervasive warming bias in CMIP6 tropospheric layers” Earth and Space Science. John and I didn’t know about the Mitchell team’s work until after their paper came out, and they likewise didn’t know about ours.
Mitchell et al. look at the surface, troposphere and stratosphere over the tropics (20N to 20S). John and I look at the tropical and global lower- and mid- troposphere. Both papers test large samples of the latest generation (“Coupled Model Intercomparison Project version 6” or CMIP6) climate models, i.e. the ones being used for the next IPCC report, and compare model outputs to post-1979 observations. John and I were able to examine 38 models while Mitchell et al. looked at 48 models. The sheer number makes one wonder why so many are needed, if the science is settled. Both papers looked at “hindcasts,” which are reconstructions of recent historical temperatures in response to observed greenhouse gas emissions and other changes (e.g. aerosols and solar forcing). Across the two papers it emerges that the models overshoot historical warming from the near-surface through the upper troposphere, in the tropics and globally.
Mitchell et al. 2020
Mitchell et al. had, in an earlier study, examined whether the problem is that the models amplify surface warming too much as you go up in altitude, or whether they get the vertical amplification right but start with too much surface warming. The short answer is both.

In this Figure the box/whiskers are model-predicted warming trends in the tropics (20S to 20N) (horizontal axis) versus altitude (vertical axis). Where the trend magnitudes cross the zero line is about where the stratosphere begins. Red= models that internally simulate both ocean and atmosphere. Blue: models that take observed sea surface warming as given and only simulate the air temperature trends. Black lines: observed trends. The blue boxes are still high compared to the observations, especially in the 100-200hPa level (upper-mid troposphere).
Overall their findings are:
- “we find considerable warming biases in the CMIP6 modeled trends, and we show that these biases are linked to biases in surface temperature (these models simulate an unrealistically large global warming).”
- “we note here for the record that from 1998 to 2014, the CMIP5 models warm, on average 4 to 5 times faster than the observations, and in one model the warming is 10 times larger than the observations.”
- “Throughout the depth of the troposphere, not a single model realization overlaps all the observational estimates. However, there is some overlap between the RICH observations and the lowermost modelled trend, which corresponds to the NorCPM1 model.”
- “Focusing on the CMIP6 models, we have confirmed the original findings of Mitchell et al. (2013): first, the modeled tropospheric trends are biased warm throughout the troposphere (and notably in the upper troposphere, around 200 hPa) and, second, that these biases can be linked to biases in surface warming. As such, we see no improvement between the CMIP5 and the CMIP6 models.” (Mitchell et al. 2020)
A special prize goes to the Canadian model! “We draw attention to the CanESM5 model: it simulates the greatest warming in the troposphere, roughly 7 times larger than the observed trends.” The Canadian government relies on the CanESM models “to provide science-based quantitative information to inform climate change adaptation and mitigation in Canada and internationally.” I would be very surprised if the modelers at UVic ever put warning labels on their briefings to policy makers. The sticker should read: “WARNING! This model predicts atmospheric warming roughly 7 times larger than observed trends. Use of this model for anything other than entertainment purposes is not recommended.”
Although the above diagram looks encouraging in the stratosphere, Mitchell et al. found the models get it wrong too. They predict too little cooling before 1998 and too much after, and the effects cancel in a linear trend. The vertical “fingerprint” of GHG in models is warming in the troposphere and cooling in the stratosphere. Models predict steady stratospheric cooling should have continued after late 1990s but observations show no such cooling this century. The authors suggest the problem is models are not handling ozone depletion effects correctly.
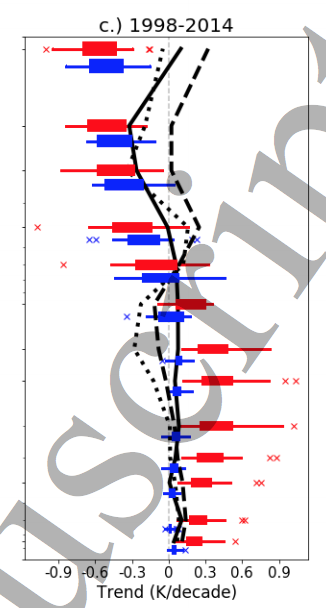
The above diagram focuses on the 1998-2014 span. Compare the red box/whiskers to the black lines. The red lines are climate model outputs after feeding in observed GHG and other forcings over this interval. The predicted trends don’t match the observed trend profile (black line) – there’s basically no overlap at all. They warm too much in the troposphere and cool too much in the stratosphere. Forcing models to use prescribed sea surface temperatures (blue), which in effect hands the “right” answer to the model for most of the surface area, mitigates the problem in the troposphere but not the stratosphere.
McKitrick and Christy 2020
John Christy and I had earlier compared models to observations in the tropical mid-troposphere, finding evidence of a warming bias in all models. This is one of several papers I’ve done on tropical tropospheric warm biases. The IPCC cites my work (and others’) and accepts the findings. Our new paper shows that, rather than the problem being diminished in the newest models, it is getting worse. The bias is observable in the lower- and mid-troposphere in the tropics but also globally.
We examined the first 38 models in the CMIP6 ensemble. Like Mitchell et al. we used the first archived run from each model. Here are the 1979-2014 warming trend coefficients (vertical axis, degrees per decade) and 95% error bars comparing models (red) to observations (blue). LT=lower troposphere, MT=mid-troposphere. Every model overshoots the observed trend (horizontal dashed blue line) in every sample.

Most of the differences are significant at <5%, and the model mean (thick red) versus observed mean difference is very significant, meaning it’s not just noise or randomness. The models as a group warm too much throughout the global atmosphere, even over an interval where modelers can observe both forcings and temperatures.
We used 1979-2014 (as did Mitchell et al. ) because that’s the maximum interval for which all models were run with historically-observed forcings and all observation systems are available. Our results would be the same if we use 1979-2018, which includes scenario forcings in final years. (Mitchell et al. report the same thing.)
John and I found that models with higher Equilibrium Climate Sensitivity (>3.4K) warm faster (not surprisingly), but even the low-ECS group (<3.4K) exhibits warming bias. In the low group the mean ECS is 2.7K, the combined LT/MT model warming trend average is 0.21K/decade and the observed counterpart is 0.15K/decade. This figure (green circle added; see below) shows a more detailed comparison.

The horizontal axis shows the model warming trend and the vertical axis shows the corresponding model ECS. The red squares are in the high ECS group and the blue circles are in the low ECS group. Filled shapes are from the LT layer and open shapes are from the MT layer. The crosses indicate the means of the four groups and the lines connect LT (solid) and MT (dashed) layers. The arrows point to the mean observed MT (open arrow, 0.09C/decade) and LT (closed arrow, 0.15 C/decade) trends.
While the models in the blue cluster (low ECS) do a better job, they still have warming rates in excess of observations. If we were to picture a third cluster of models with mean global tropospheric warming rates overlapping observations it would have to be positioned roughly in the area I’ve outlined in green. The associated ECS would be between 1.0 and 2.0K.
Concluding remarks
I get it that modeling the climate is incredibly difficult, and no one faults the scientific community for finding it a tough problem to solve. But we are all living with the consequences of climate modelers stubbornly using generation after generation of models that exhibit too much surface and tropospheric warming, in addition to running grossly exaggerated forcing scenarios (e.g. RCP8.5). Back in 2005 in the first report of the then-new US Climate Change Science Program, Karl et al. pointed to the exaggerated warming in the tropical troposphere as a “potentially serious inconsistency.” But rather than fixing it since then, modelers have made it worse. Mitchell et al. note that in addition to the wrong warming trends themselves, the biases have broader implications because “atmospheric circulation trends depend on latitudinal temperature gradients.” In other words when the models get the tropical troposphere wrong, it drives potential errors in many other features of the model atmosphere. Even if the original problem was confined to excess warming in the tropical mid-troposphere, it has now expanded into a more pervasive warm bias throughout the global troposphere.
If the discrepancies in the troposphere were evenly split across models between excess warming and cooling we could chalk it up to noise and uncertainty. But that is not the case: it’s all excess warming. CMIP5 models warmed too much over the sea surface and too much in the tropical troposphere. Now the CMIP6 models warm too much throughout the global lower- and mid-troposphere. That’s bias, not uncertainty, and until the modeling community finds a way to fix it, the economics and policy making communities are justified in assuming future warming projections are overstated, potentially by a great deal depending on the model.
References:
Karl, T. R., S. J. Hassol, C. D. Miller, and W. L. Murray (2006). Temperature Trends in the Lower Atmosphere: Steps for Understanding and Reconciling Differences. Synthesis and Assessment Product. Climate Change Science Program and the Subcommittee on Global Change Research
McKitrick and Christy (2020) “Pervasive warming bias in CMIP6 tropospheric layers” Earth and Space Science.
Mitchell et al. (2020) “The vertical profile of recent tropical temperature trends: Persistent model biases in the context of internal variability” Environmental Research Letters.
HT/Cam_S
“WARNING! This model predicts atmospheric warming roughly 7 times larger than observed trends. Use of this model for anything other than entertainment purposes is not recommended.”
It would indeed be funny if this wasn’t so serious.
and by entertainment you mean Science Fiction, Horror and Post Apocalyptic Hollyweed (sp) Movies. Like the day after tomorrow when global warming causes hell to freeze over.
Mr. Mulholland: So if we put a climate model on facebook or twitter, they will put a warning label on it? Oh, sorry, warning labels for republicans and sceptics only.
Here’s funny- The NBA players walked out and wanted the season cancelled. The people in charge of the league issued a statement that the playoffs would resume and the season would be finished.
That was the english translation, the statement was issued in mandarin.
In the 1960 computers were used to simulate things and the results were printed on cheap 18 inch wide paper.
Several sheets made nice bird cage liners.
No shortage then, either.
What term might one use to characterise someone who denies the models have a consistent bias upwards, i.e. a ‘warming’ bias?
A ‘denier’?
Reckless.
Liar?
mosher
Seward
I deny that they are climate models.
They pretend to be climate models.
The physics of climate change is not known with enough precision to construct a real climate model.
What are called climate models are really biased computer games. The bias shows in the consistent over prediction of warming that does not change over the decades. The Rusian model is an exception. A real model would be revised to be more accurate, but that never seems to happen with the climate computer games.
The so called models represent the personal opinions of their owners on climate change physics … and those personal opinions are biased by a hatred of fossil fuels and man made CO2.
I see the so called clinate models as props along with with the government bureaucrats with science degrees. Props used by politicians to demand more political power over energy used by the private sector. Not because they love to control everyone, of course, but ONLY because they want to save the planet for the children.
“…but ONLY because they want to save the planet for
thetheir children.”In this view, everyone else can just piss-off and serve their children as peasants and house-servants.
Fixed it.
Lysenko.
They’re climate-prediction games, not models. Almost all “climate-scientists” are actually just gamers.
On a more serious note and going to something that has bugged me about the climate models for years now, as it happens I did some work about 20+ years ago using CFD software modelling fluid flow around ship hulls (I am a naval architect by profession). I had just wanted to do some model testing but was told the tank was booked out for 6 months or so but the university had just purchased some CFD software. OK I said so they gave me the manual and a password onto the system and left me to it. It was abit like wanting to fly somewhere only to be given the aircraft manual, the keys to the plane and told teach yourself to fly.
Anyway I got my first model set up and pressed ‘calculate’ and came back the next day. ( Number crunching your way through the Navier-Stokes equiations, even for a simple, constant density, constant temperature and assumed frictionless single fluid takes time even on a Sun workstation). Suffice to say I scratched my head when I saw the 3D graphic of the wave pattern. The actual vessel had been operating for a few years and I had photographs of her wave pattern at full speed and they were not anything like as big as what the output data was indicating, about half the height in fact.
AT some point I figured out or read somewhere that the model mesh size could be the problem, i.e. it was too coarse, and the model had converged to a ‘false solution’. I made a new mesh with a finer mesh, particularly in the area of highest waves at the bow and pressed ‘calculate’ again and came back a few days later. Hey preston! A realistic model that compared well to the full size photographic evidence.
To explain what happens, firstly a coarse mesh means lots less simultaneous equations to solve and thus lots less time for the machine to take. Broadly for a surface madel, a mesh 10 times as fine has 100 times more number crunching to do all other factors the same so there is a practical incentive to have a coarser mesh. For a 3D mesh it would be 1000 times.
I visualise what also happens as being a bit like when (as a kid) you flicked a wave down a rope and watched it travel. If you replaced the rope with a chain with the same weight per metre and repeated the exercise you might expect a similar looking wave. If however you redused the number of links to create a ‘coarser’ chain the wave would stsrt to look different and likely dissipate quickly along the length. At some point of longer links it simply would not travel or may even do some bizarre thing and lock up.
So, my point? What if the climate ‘models’ are simply too coarse to properly model the complex mechanics of the atmosphere and its land-sea interactions, particularly around the equator where you have many, many high activity local events and they simply converge to a consistently false solution?
It is not hard to see the incentive to ‘deny’ by ignoring the difference between the models and reality as it may well be that a ealsiticly accirate model mesh is just beyond the capability of computers or the time they take to solve a case and that leaves aside any unrealistic simplifications of the models themselves in terms of the various phenomena they take into account.
Happy to be slapped down on this one but it does bug me as to how and whay these model results are so consistently wrong.
For some reason, for me, you name seems a perfect fit to your profession (maybe its just some SS Seward floating around in the grey area of one of memories I can’t quite recall.)
I am generally to lazy to do what you did. I simply adjust (what I consider) appropriate input parameters of the model to fit to the observed, rather than fixing the model. (And my modeling isn’t generally as complicated as yours).
Anyway, if you have time to respond, what do you think of the 22′ Bartenders. I’ve got a friend whose father built one and he wants to get it back into the water … has been in inside storage for about 25 years. I was just wondering about the plywood integrity….
Yeah, I reckon my path was ordained long before I actually arrived.
I was brought up between a large estuary and the ocian and spent my childhood and youth in, on and under water or just mucking around in boats. Getting called ‘seaweed’ in grade 1 taught me to sort the bullies out and now only the closest of friends even dare and then only as a segue to asking what I want to drink…
Re the Bartender 22′, if it has been kept dry and covered it could well be OK. Marine grade ply has been around for quite a while. My Dad and my uncle built a 21′ ply boat we used for most of my childhood, i.e. 60 odd years ago and it was Ok 25 years down the track except for the foredeck which had caught the weather. All in all good prospects if it has been looked after but have a shipwright have a good hard look at it is my suggestion.
lots less simultaneous equations? Should be a lot fewer simultaneous equations. Sorry, I just can’t stand it anymore. Look up fewer vs. less in a grammar book. You’re not alone. Hardly anyone pays attention.
Maybe they could get the guys at Imperial College to explain how they got such incredible Covid-flu predictions? Along with BSE, H1N1 and a number of other superb predictions.
Did I say “predictions”, obviously I meant “huge amounts of grant money and publicity”
Mike,
You mean “projections”
Got to use the correct bafflegab.
Given the amount of money involved that should be bafflegrab.
Ask Neil Ferguson to explain. He’s their “expert”.
The climate is a coupled non-linear chaotic system. That means it’s impossible to predict accurately. If you have enough models/model_runs, you might find attractors.
In one of the early IPCC reports they stated that the climate is chaotic and pointed out that accurate prediction is impossible. They seem to have dropped that in recent reports. link
Here’s how chaos becomes deterministic.
http://www.palisad.com/co2/chaos2gold.pdf
You should note that the average ratio between the BB emissions of the surface and emissions at TOA is within a few of percent of the golden mean of (1 + sqrt(5))/2) = 1.601803… across the entire surface of the planet.
Is this just a coincidence or is the the consequence of chaos?
You may want to think that the same coincidence can happen across the entire surface of the planet and at all times, but to me. that’s not a coincidence, but is characteristic of what it must be.
To apply this to the climate, i0 is the NET solar input, o1 is the NET radiant emissions of the surface consequential to its temperature, i1 is the energy offsetting the surface emissions and o0 are the emissions of the planet offsetting i0. Clouds provide the chaos as they modulate the ratio of the planets emissions to the surface emissions, that is, they chaotically modulate the transfer function as characterized by g.
Note that the constant average ratio only applies to the output path from the surface to space. The input path is still affected by the albedo, where the constant ratio characterizing the output path is maintained independent of the albedo, despite the albedo being dependent on the clouds manifesting the chaos.
OK… do me a favor: Apply your i0, o1, i1 and i0 factors to the respective SWIR and LWIR inputs/outputs on an earth balance chart like the one on this site:
http://theinconvenientskeptic.com/2010/11/the-earths-energy-balance-simple-overview/
Then show me how the LWIR values and Net absorbed +0.9 W/m² would change IF the “not evil” CO2 fell 100 from 420 to 320 PPM. Would the balance drop to 0.0 W/m²? I don’t think so… in which case you’d have proven CO2 is indeed not evil. Thus taxing it would be counterproductive.
UV,
Easy. First, create 2 more conserving pairs. One for reflected solar energy and another for non radiant energy entering the atmosphere from the surface (latent heat and thermals) and its offset returning to the surface.
We can now say that when these two new pairs are conserved, whatever effect they have on the temperature and NET emissions has already been accounted for. A 4×4 identify matrix quantifies the steady state and since the 2 new pairs have no additional effect, we can write the normalized transform as {1, 0, 0, 0},{0, 1, 0, 0},{0, 0, a0, 1},{0, 0, 1, a1} which can be reduced to {a0,1},{1,a1}.
Per Trenberth’s misleading diagram, i0 = o0 = 239 W/m^2 and o1=i1=395 W/m^2 whose ratio is only 2% higher than the golden ratio.
If CO2 changes, only the affects it has on the albedo will have any effect on the temperature, since both the Sun and golden ratio are constant. The mechanism by which CO2 acts is to increase the minimum clear sky absorption which decreases the additional absorption required from clouds in order to absorb enough surface emissions to establish the required ratio. Given constant atmospheric water, the fewer clouds contain more water per unit volume and are more reflective, so it’s hard to say what the net effect is, except to say that it’s small and nothing to worry about.
There is no reply button to co2’s below post (Aug 28 6:55 pm PST). So I will reply to my own post here and hope he sees it.
Easy? OK… but I need more time to noodle on it because tied up today and tomorrow. Are you referring to a net energy (not flux) balance like in this chart?
http://theinconvenientskeptic.com/wp-content/uploads/2010/11/FT08-Blocked1.png
Where upwelling BB is shown as very low (63) and thermals + latent are predominate?
IE: 17 + 80 + 63 = 160 vs sun 161 = +1 balance?
Or something like this chart where the above are highlighted in pink boxes?
Oops… can’t post images here.
UV,
I’m referring to the NET radiant fluxes, i.e. energy in the form of photons. The flux in and out of space is obvious (i0/o0) but the NET flux entering and leaving the surface consequential to its state (the temperature) has been bastardized to include non radiant flux and its return to the surface whose entire effect is already included by the average temperature and its BB emissions. These BB emissions comprise the entirety of the NET radiant flux leaving the surface, i1, and the required offset from the atmosphere, o1 (in/out is relative to in/out of the atmosphere).
Incorrectly characterizing the return to the surface of this non radiant energy as part of the ‘back radiation’ return does not make this a legitimate component of the RADIANT balance.
The apparent imbalance of 1 W/m^2 is wrong and no such average imbalance actually exists and if anything it’s just a rounding error. If there was a persistent imbalance, each year would be monotonically warmer (or cooler) than the previous one and this isn’t even close to what’s observed. It’s presumed to exist only to support the flawed idea that there’s a lot of pent up warming that hasn’t yet manifested. In other words, the IPCC also dramatically over estimates the time constants which are months to years and not the decades to centuries they assume. If the time constants were really this long, we would barely notice any differences between the seasons.
OK… got it. Thanks. Wish you could present all that to IPCC ! Make you own earth energy balance chart and post link to it here when you have time.
Key is non-radiant flux being included with radiant on current e-balance charts. Plus the fact that LWIR is called “thermal” energy when in fact it can’t “heat” air, surface or water imo. Wavelengths too long and frequencies too low.
UV,
I was an expert reviewer for AR6 and much of this and a lot more was in my report. They ignored it because the scientific truth precludes their reason to exist. If an entrenched bureaucracy with an agenda is good at anything, it’s insuring its continued existence.
Have you seen this?
http://www.palisad.com/co2/gbm.pdf
Richard Feynman: “It doesn’t matter how beautiful the theory is, or who made it, what his name is or how important he is. If it disagrees with observation, with experimentation, with reality – it’s wrong. And that’s all there is to it.”
The corollary being that even an ugly theory that agrees with reality could be right.
“no one faults the scientific community for finding it a tough problem to solve”
…no, we’re faulting them for lying about it….claiming they are accurate, when they know they are not
and producing reams upon reams of the same old false crap…..all based on the same old false crap
and they know it
You are exactly right. They are a bunch of rent-seeking dishonest charlatans who can’t seem to see their hands in front of their faces. They are so invested in the disproven CO2 hypothesis that they are failing to investigate any alternative theory. It is ruinous because our non-scientific politicians don’t know any better and the media, more ignorant of the science than they, are leading the bandwagon to idiotic “green” solutions that will do much more harm than good.
They have literally been taking food away from the poor to keep their Socialist hoax moving forward.
Latitude,
Please distinguish between climate modelers and scientists. There are many good scientists that have been shut out of pubs and grants by the former. They have hurt the reputation of good science.
I know of no expert in partial differential equations or numerical analysis that would support any IPCC conclusions based on climate models.
Gerald Browning
Thanks from our ~ sea level Tropics, for this: one Armageddon less.
The depressed have to find another track, and there is still more choice now: Covid-Plandemic or Trump US vs CCP China cold war.
Canada wins the prize again. They also have the world’s highest proportion of nursing home deaths at 82%.
No wonder we have a superiority complex. Always better than the Americans.
“I would be very surprised if the modelers at UVic ever put warning labels on their briefings to policy makers.”
Do they actually think Junior and Climate Barbie would: a) understand a warning label or b) care?
When you’re trying to get re-elected and you’re dumb as the dirt you wear on your face…you just preach to the Green Cult and hope for the best.
That’s because the Canadian Government is responsible for their Health Care Costs
Must clear the books as quickly as possible
This is what can happen when you put any Government in charge of providing Health Care
But the notion of “Death Panels” was kray kray, doncha know!
Good report. “…no one faults scientists…” is not correct because I fault them, that is, those who do not attempt reality checks of their work. The models run hot because that is where the money is. Reality check? or Bank check? Guess which wins.
What’s even worse is many of them blame natural cooling for the reason the models are so wrong. As most of us know, natural oceans cycles have been a strong warming influence over those 40 years.
-The PDO has been positive for about 75% of the time including the last 7 years.
-The AMO has been positive for the last 25+ years.
-ENSO has seen El Nino conditions in 6 of the last 7 years.
Both major volcanic eruptions in that time period occurred in the first 12 years. That creates yet another natural warming influence on the trend.
In reality, the lack of warming is “worse than they think”.
I wasn’t expecting to find as much good or new information as there is here.
“’It’s tough to make predictions, especially about the future” — baseball-playing philosopher, Yogi Berra
50% of the CMIP5 ensemble has been out of range vs observations for 21 years yet are still being promoted as an unquestionable warming trajectory.
I used CMIP5 not CMIP6 and found that correlations between forcing and temperature depend on time span. The finding implies that stable ecs at 80 years and longer and unstable at 30 years or less. Maybe they should check their work at time spans longer than 1979 to 2014.
https://wp.me/pTN8Y-oX
Well, what’s going to happen when cooling kicks in 10 to 15 years from now and continues for a few decades? Going to be really hard to hide the fall when crops get frozen in June and it starts snowing in early September above 40N. My suggestion is turn the graph upside down.
They will tell us, it was a good way promoting Green ideas, what else ?
That won’t stop them from being eaten.
Well, what’s going to happen when cooling kicks in 10 to 15 years from now and continues for a few decades?
They’ll tell us that global warming is responsible.
Oh, wait, they already covered that bet, more than 16 years ago:
https://www.livescience.com/3751-global-warming-chill-planet.html
https://yaleglobal.yale.edu/content/will-global-warming-trigger-new-ice-age
“… Maybe they should check their work at time spans longer than 1979 to 2014…”
Clearly stated in the summary. That is the timeframe for which all observational data, including historical forcings, is available (also looked at 1979-2018 using model projections for the end period).
One acronym for the modelers: GIGO
That includes the code. No model is better than the assumptions of the modeler.
“No model is better than the assumptions of the modeler.”
That is the crux of the matter. Now if they’d try removing CO2 from the models…
Or is that what the Russians do with theirs?
Somebody please post the Russian model trend graph. As I recall it looks similar to the UAH observed data. About +0.4°C anomaly from 14.0°C baseline. NOT +1.1°C like biased GISS shows!
Dear NASA: Please fire GISS asap. Take away their right to paste the NASA logo on their data!
As I understand it, while pure Mathematics give true results when they can, computers have to run different formulas than mathematics to get a “similar” result. But a problem, especially as relates to the enormous problems of Computer Climate Models, is that it is impossible for them to be correct because of:
1) Machine Epsilon; the Finite Representation of Computers (very limiting)
2) Parameterization (guessing)
3) Un-preserved Variables
4) Unknown Variables, and unknown unknowns – Cosmic rays were recently found to influence climate
With the possible exception of future quantum computing, it is IMPOSSIBLE for Computer Climate Models to ever be correct. And it is not a limit on the power of computers. If we suddenly had a computer a trillion times faster and more powerful, we’d simply get the wrong answer faster. Computer Climate Models are junk, only useful for experimentation and hypothesizing. Have you seen how the European Model for Hurricane path prediction of Laura was at least 100 miles to the west of where it actually went onshore. The American Model was off only 27 miles, or so. If Weather Models (and there are at least 6 or 7) can’t agree where a hurricane will make landfall in 36 hours, why THE HELL would anyone believe (i.e. give ANY credence whatsoever, even over lunch) Computer Climate Models can predict decades into the future. Computer Climate Models are junk to Climate Policy.
See Dr. Christopher Essex, Canadian Mathematician, tell you why Computer Climate Models cannot be correct: https://youtu.be/19q1i-wAUpY (1 hour, 7 minutes, stick with it, it is well worth the time)
All good points. Add to that:
* Assumptions of the person writing the code
* Does the code actually do what they think it does?
As a programmer myself, I am very familiar with both of these. There are always certain assumptions when you work on a piece of code, whether you are aware of them or not. Most of the time, those only affect minor implementation details, but I have faced cases several times where those assumptions caused the code to have problems under certain circumstances.
Also, I test the hell out of my code. But what I work on is very deterministic. I know what outputs to expect from the inputs. How can you possibly test code where the outputs for a set of inputs are unknown? How do you know, for example, that you don’t have a multiplication error with an extra digit? Simplistic example, but I think it makes the point.
BTW, If MY assumptions here are way off-base, feel free to point out where. I haven’t done modeling so I might be thinking incorrectly.
TonyG, You’re so right about the code itself. An apparent perfect case in point is the British fellow that had model forecast-ed up to 2.2 Million deaths in the USA due to COVID. Early in the COVID “crisis”, his model’s projection of so many deaths contributed to unnecessary fear responses that helped to shutdown our economy – the total of the damages may never be fully know, the same for the actual causes. When examined by other programmers, his code was found to be junk – like what you are saying. See: https://www.foxnews.com/world/imperial-college-britain-coronavirus-lockdown-buggy-mess-unreliable
I am a retired programmer having worked in the semiconductor industry (factory automation). I pretty much worked only in C, C++, and Smalltalk. The types of programming that you (assuming here) and I did was more deterministic, controlled and practical than Climate Modeling, I think. The compiled programming languages themselves, and the IDEs that support the coding, have safeguards in them to help prevent the afore mentioned limits of the hardware.
If you can find the time, watch Dr. Essex’s (above) video; I think you will also conclude that Computer Climate Modeling is implicitly futile, and is extremely dangerous for policy decisions – nothing good can come from it; it is a tool for socialist advocacy, i.e. EVIL.
These models work by starting with an estimate for the many variables then calculating the model and comparing the new values with the original then iterating again using the previoius values. If the system behaves in a relatively smooth manner the model should converge to smaller and smaller differences between iterations until some level of acceptable consistency is achieved.
So what could go wrong?!!
1 The model maths contains elements that are crude approximations or are otherwise unrealistic and send the model calculations off track.
2 The model mesh, i.e. rhe number of points at which the model is evaluated at are too far apart and large fluctuations can actually occur in the intervening regions that the model is oblivious to. The result of this can be for apparent convergence to a ‘result’ but just a false one.
What a pity that these admirable papers won’t be available for input to the next IPCC round, for a variety of reasons.
I haven’t made my mind up yet as to what those reasons will be, but rest assured that they will be VERY good reasons…
This seems to be a hallmark of modern “science”: models trump data. I’ve seen it just recently in the whole mask debate “Models show masks prevent spread of Covid-19”. I’ve been seeing it creeping into the hard sciences, too.
They’ve forgotten (if they ever knew) Feynman’s admonition “It doesn’t matter how beautiful your theory is, it doesn’t matter how smart you are. If it doesn’t agree with experiment, it’s wrong.”
Using the new … “Coupled Hybrid Integration Model Project” or CHIMP, Scientists have developed a method where “Daily Atmospheric Representative Temperature Sensors” or DARTS can more accurately predict future climatic regimes.
Yes, that is correct a CHIMP can now predict the future climate using DARTS
Charles, give Bryan a WUWT T-Shirt for that one……
Mosher will be here any moment to explain in broken grammar riddled with typos that these papers are “not even wrong”.
It will be something to do with how foolish everyone is except him, and how modelling is not prediction, and prediction is not modelling or some inane variation.
+100
“I get it that modeling the climate is incredibly difficult, and no one faults the scientific community for finding it a tough problem to solve. ”
The scientific community is not trying to solve the problem of climate. All the good scientists have been driven from the field.
All that’s left are climate modelers, who play video games with their models. None of that approaches trying to solve the problem.
Science takes hard gritty work to advance a single step. The climate problem will be solved by physical meteorologists and ocean physicists collecting data and making reductionist hypotheses about how various bits of the climate work. Wrong hypotheses get weeded out. Eventually, the predictively successful bits get tied together into a working physical theory.
Climate modelers will never, ever, get there. They’re not scientists. They have no concept about how to proceed. They conduct a charade.
The problem is few so called scientist want to do the work of collecting the data. It a lot easier to model something. If the model wrong they don’t blame the model. They simply claim the actual result(weather) is wrong, don’t believe you lying eyes after all in not freezing in June, that was your imagination. My brother in laws loss to frost in mid August in the first decade of this century was only and illusion. Hard work is something that go lost with the younger generations.
You see this continually today. There was s paper on here recently about water runoff when it rains. It was obvious the author had never even played outside in the rain let alone talked to any farmers with decades of experience. Just created some assumptions on which to base the model and full speed ahead – and the peer reviewers didn’t even notice! They just check the math – not reality.
No model based on assumptions should ever be used for predictions. A projection of the model result into the future might be useful but generally only over a short time period. If the model can’t can’t even handle short term how can it trusted to handle long term? Things don’t just “average” out in the real world. Details matter.
Tim,
The peer reviewers don’t check the math because it is a buddy check. Heinz Kreiss and I checked the math and found that not only are climate models based on the wrong atmospheric dynamical system, they also have misused numerical analysis by applying numerical methods to discontinuous continuum solutions with large continuum errors.
Read my article in the September issue of the journal Dynamics of the Atmospheres and Oceans. The manuscript could not be prevented from being published because of the rigorous mathematics.
Gerald Browning
Gerald,
I logged onto Science Direct and found this
https://www.sciencedirect.com/science/article/abs/pii/S037702651930096X
You do not seem to be on Academia or Research Gate.
Have you considered Research Gate? membership is free.
Phillip,
That is the correct manuscript. I explain in great detail why the hydrostatic system used by all global climate models does not satisfy the Bounded Derivative Theory requirements necessary for the solution to evolve on the large scale of atmospheric motion. Basically the original scaling by Charney in 1947 was correct and that led to the use of the hydrostatic assumption by modelers based on the necessary balance between the two large terms in the time dependent equation for the vertical component of the velocity. Unfortunately the scaling by itself does not ensure that the solution will evolve as the scaling suggests. For that to be the case the initial data must satisfy elliptic constraints derived by ensuring higher order time derivatives be independent of the fast time scales. The hydrostatic system does not satisfy these constraints but the reduced system introduced in my manuscript does. This is a mistake that has been made in a number of fields (e.g. oceanography and plasma physics), namely that even though two large terms must balance to a certain degree, setting them exactly equal leads to to the wrong (and usually ill posed) system.
Feel free to ask me any quwstions or for more details.
Gerald Browning
Phillip,
That is the correct manuscript. I wrote a long response but I went to eat dinner and I may have waited to long to finish the response. Basically the hydrostatic assumption used in all global climate models is based on the assumption that two large terms in the scaled system must balance exactly. Unfortunately that leads to a system (the hydrostatic system) that does not ensure that the ensuing solution will evolve as prescribed in the scaling.
For this to be the case. one must derive spatial elliptic constraints on the initial data using the Kreiss Bounded Derivative Theory. Using those constraints along with a time dependent equation for the slow variable leads to a reduced system that is well posed for both the IVP and the IBVP and accurately describes the evolution of large scale motions in the atmosphere. It turns out that the reduced system also describes smaller scales of motion (Browning and Kreiss 2002).
Gerald Browning
Phillip,
That is the correct manuscript. I have written two responses but they have not shown up. I will wait until tomorrow and try again.
Gerald Browning
Phillip,
There is thread on this site that contains a version of my manuscript as submitted called “Structural Errors in Global Climate Models” if you do not have access to the journal.
I would be happy to answer any questions you have about the manuscript in any level of detail .
Gerald Browning
I suspect you are right about the good scientists, the modelers and how the science will develop. But what about the current perceived importance of climate models?
Governments base policies on their output, there are trillions of dollars to be made at the expense of the taxpayer and we shall destroy much of our way of life on the alter of false model projections.
The modelers and their climate science friends clearly have massive influence. They appear to be supported politically and endorsed by the IPCC/UN, WMO and numerous environmental and academic organisations and financially supported by massive funding by governments.
Here, we have papers confirming that the models greatly exaggerate warming and your own contribution, which shows that the uncertainty renders the models useless. In summary, globally, governments are set to destroy our economies on the basis of rubbish science.
Where are the pressure points? How can we best respond? I’m sure the military have an appropriate phrase but it escapes me for now. I’ve followed the science closely for a dozen years and it is becoming more and more obvious that carbon dioxide is a minor player. It is imperative that governments are convinced of this, but how can we achieve that? That should be our discussion. I agree that slow, incremental advancements will eventually unlock the secrets of our climate. What we need to do right now, is demonstrate to governments that they are squandering their economies on false science.
The “climate problem” has not changed for hundreds or thousands of years… how do humans make sure they are safe from the climate when it is a challenge, how do they use it to advantage to grow things, how to predict when the weather will be bad or good or hot or cold or rainy or dry, where to move to when possible or necessary to find a more suitable climate and weather, and how to enjoy it on vacation.
Modern technology has fulfilled nearly every requirement necessary to sit back and enjoy the climate. Modern transportation ensures we can move to nearly any climate we desire. “Climate” is not a “problem”. The worst “problem” we have is protecting ourselves or moving out of the way of bad weather, warnings we now get days in advance. Or perhaps a century in advance for sea level rise.
Thus, the worst “climate problem” we have only exists in mock models, known to be fictions.
So the science IS settled. All global warming models are over-stated.
Well, of course, maybe we could just stop playing with climate models altogether and accept what the ice core data told use 20 years ago, namely, temperature change precedes CO2 change. The science says there is no need to do this climate modeling at all.
Now, if you want to collect real data, and try to make more accurate weather predictions, that would be science. But the “climate” models have nothing to do with science at all.
Is it just me, or does it seem the journals are starting to turn against global warming ?
Journals have started to accept sceptic arguments and writings, which are based on real science, with observational and measured proofs. They have to do it, because public opinion has moved away from alarmist visions. This game has been going on some 30 years now, and absolutely nothing has happened.
“They” have only put a label to us “deniers”. I call “them” science deniers, and “they” get mad, which is nice, but it works.
I have blamed their arguments, which are only arguments from somebody, and nothing else. One of “them” contact me and he told me he tried to find real arguments. And finally he understood that he had been living in this lie for too many years. He has seen the light and I´m sure that he´s not alone with that light.
Sceptical arguments are growing, and I think that media is bored to cencor all them, because, after all, it´s maybe 60-40 to alarmists still, but “deniers” group is growing. It´s been a big and fun job to convince alarmists to change their mind to look what real science says. And this site is best place to get real information. Thank you all, you have been and still are the source and root to all information. And special thanks to Anthony Watts for this site. This is endless treasure chest to help fight against aggressive propaganda.
“One of “them” contact me and he told me he tried to find real arguments. And finally he understood that he had been living in this lie for too many years.”
I love it! 🙂
I think it is a good idea to challenge alarmists to find real arguments in favor of Human-caused Climate Change, and as we can see from this example here, one person tried to find a real argument and realized there are no real arguments in favor of it.
Most alarmists assume Human-caused Climate Change is based on a solid scientific foundation, but it’s not. When you start looking for that foundation, you can’t find one. All you find is speculation about how CO2 interacts with the Earth’s atmosphere. Too many people don’t challenge or even think about the basic foundation of Human-caused Climate Change. They assume that has already been established. They would be incorrect.
Can’t wait to see Mann’s\ Santer’s\Schmidt’s ( pick an idiot!) ” refutation” – they’ll call it debunking-when they hope John Christy and Ross McKitrick aren’t looking.
So they can’t even hindcast accurately? If this wasn’t costing poor people the loss of affordable energy, I would think it was a bad joke. The fact that all of them do this indicates some coordination.
As has often been pointed out, climate models are inherently incapable of being validated, if only because of the available historic data has less detail and is thousands of times shorter than would be needed for realistic validation.
And, as has also often been pointed out, the results from an unvalidated model are no more than the illustration of somebody’s hypothesis.
An increase of cirrus clouds should have a) an inhibiting effect on evaporation while b) raising temperatures. With both effects working against each other, there is a logical explanation at hand why the tropical troposphere (aka “hot spot”) is not warming as predicted.
Of course upstream the logical chain it means it is not CO2, but contrails warming the planet. This makes a lot of sense, since arguable anthropogenic warming only started in the 1970s and since then strictly followed the extend of increasing air travel. Also this explains why there is no warming in Antarctica of course.
Well, what you have done is pointed out the serious and immediate need to go adjust the data (agian) since it obviously is wrong (again). Maybe we can mix in internal domestic house temperature measurements this time since we have already mixed in the Ocean temperature data? Or perhaps we have missed some available proxy data like fossilized hail air pocket gas analysis, or ancient moss growth rings?
Since the models are correct and we know this from our faith, it is the data that MUST be wrong.
Hmm, another way to fix this is to develop 20 new models and average them in, after all, the more models you use to produce an average, the more correct the answer must be.
“who you gonna believe, me or your own eyes?” – Chico Marx
[written from the NCR on Aug 27, where the temp is 95F]
Chris, Pls check back with us on a temp update on January 27 from the NCR.
The Greenhouse in a Greenhouse Effect.
In the meantime I am up to coincidental correlation #9 in my concept of sunspots directly affecting temp changes in the 3.4 ENSO region. Here was today’s update “Coincidence #9, temps in the 3.4 region warm slightly just as I suggested the other day because there is no active areas on the sun. Temps in the 3.4 region should continue to rise, if no active areas appear.” … https://www.spaceweatherlive.com/community/topic/1817-waiting-for-the-sun/
I am going to see just how many coincidental correlations I can amass over the course of the rest of this year. I am using Tropical Tidbits daily 3.4 update to track any changes in temps in the 3.4 region occurring after the appearance or disappearance of sunspot groups/H-alpha plages in either hemisphere of the sun. So far since the beginning of May there have been 9 coincidental temp shifts in the 3.4 region which have followed the 9 changes in solar activity over the same period of time.
Well isn’t it obvious? The ENSO area is controlling the sunspots. All part of CliSci 10101.
I am a neophyte in all this but has there been any work on a completely blind study where a blind output of various models were compared against a likewise blind observations/ empirical data / mother nature?? Manipulate the data so it is unrecognizable and let math wizards go at it.
“The Canadian government relies on the CanESM models “to provide science-based quantitative information to inform climate change adaptation and mitigation in Canada and internationally.”
Michael Crichton’s words, comparing today’s politicized climate science with the science of eugenics and Lysenkoism, are stalking the climate pseudo-science modeling community with his words of warning about this situation. What is being foisted on the public as “science” is absolute garbage crap. All these models are junk computer-simulations, parameterized and tuned with precision to give desired outputs, about as much in common with reality as the CGI stuff coming out a Hollywood CGI science-fiction shop these.
Then idiots like the entire AAAS staff of psuedo-scientists push a narrative that we must “follow the science.” Well, their “science” is pseudo-science garbage. They should be ashamed. But they are not. Shame was discarded 25 years ago when Cargo Cult climate modeller Ben Santer was allowed to make a 1-man edit to the attribution section of the IPCC’s Second AR without being sanctioned and tossed out. Now they are only driven by rent-seeking and political ideology that has corrupted all of science to their rent-seeking, self-promoting behaviors.
Nice to see a scientific presentation of the obvious that there is a huge bias in X-Box climate. I’m not a climate scientist, but over the past decade, I’ve presented the same conclusions (as have many others) here at WUWT – ballpark, models 300% too high. Moreover, the projected growth of tropical temperatures should be virtually in the neighborhood of zero. Even the Climate Wroughters seemed to know this a decade or two before now in their climate theories.
I was in Lagos, Nigeria in 1965-66 and in Cotonou, Benin and Lome, Togo in 1998, all at the same Latitude ~4°N and within a few hundred km E to W on the seacoast and summer temperatures were 28-30°C, as they are today and as they will be 60yrs hence. The constant refrain that poor folk in the hot countries are going to suffer most with global warming is well known to even the Climate Wroughters to be unmitigated bull.
How many times have I (and others) also had to say that most of the warming occurs in polar regions, and in winter in the temperate zones? Let me see through the ‘chaos’ for a minute to advise that the world population, tropical, polar and temperate won’t notice, let alone suffer. The temperate zone at worst would have to turn burners up to the max to get anywhere near 1.5C of warming by 2100, polar region’s winters would drop from -40C to -37C in the real worst case and tropical regions won’t see any change. Vote for Trump.
“The sheer number of models makes one wonder why so many are needed, if the science is settled.” Exactly.
But isn’t the world going to end in 2030? Better build another model to save us.
The Noah’s Ark model!
A pragmatic conclusion comment, rather than an explanatory one. The CMIP5 Tropical troposphere miss by about 3x was more than adequately demonstrated by Christy to Congress. A big credibility hit to the ‘climate science’ community. My several past posts on CMIP5 had reasonable explanations. Computational constraints force large grids, which forces parameterization, which drags in the attribution question.
One would think they would fix their embarassing model problem in CMIP6, rather than make it twice as bad. And my previous CMIP5 parameterization/3 decade best hindcast explanation for their hot model problem DOES NOT explain 2x hotter CMIP6.
The longer the world goes without any of their resulting predictions starting to come true (temps not rising as predicted, sea level rise not accelerating, arctic summer ice still there, polar bears doing fine…) the more skeptics win and climate change gets defunded. Evening rolling Blackouts in CA caused by too much solar don’t help their cause, either. Nor the bankruptcy of Tonapah.
“… the more skeptics win and climate change gets defunded.”
It won’t matter if Joe Biden wins (actually K Harris) and the Democrats also take the US Senate. They’ll then have what they are really after, total power. And they won’t make the political “mistake” they committed in 2009-2010 of allowing a Senate filibuster to stop them (Their much championed ObamaCare/ACA turned into a political disaster for democrats simply because they lost the filibuster-proof 60 votes with Scott Brown taking Ted Kennedy’s seat in January 2010. Then they couldn’t fix the deeply flawed enabling legislation after they’d voted it in without reading it first). So they’ll ditch cloture-filibuster rules by the second the day after they have a Senate majority.
With control of Congress and the White House, the climate end-game will be in their hands. It’ll be “climate justice” spending and labeled “green” to ignorant masses and the Fed and treasury crank up the printing presses. Regulations without end will come to snuff-out any industry or business that attempts to oppose them in the courts. It’ll be pay-to-play politics California style mandated from Congress and a Harris Administration (Joe will be long gone). And they’ll pack in 4 more progressive Associate Justices to Supreme Court if Chief Justice Roberts gets in their way.
The Chief Justice seems to like legislating from the Bench. He doesn’t seem to understand what the words “make no law” means in the U.S. Constituion. The Left won’t need to replace him. He’ll fit right in.
The Climate Models are not designed to predict future Climate or Weather, they are sdesigned to terrify the public and frighten them into a state of maleable compliance where they will respond positively to the command to “Open your wallets and say after me,’Help Yourself'”.
48 models?!! OMG. I’d only purposely investigate that many models if perusing the SI Swimsuit Issue.
“I get it that modeling the climate is incredibly difficult, and no one faults the scientific community for finding it a tough problem to solve. But we are all living with the consequences of climate modelers stubbornly using generation after generation of models that exhibit too much surface and tropospheric warming, in addition to running grossly exaggerated forcing scenarios (e.g. RCP8.5). ”
Exactly, well said, and this out of control train has to be stopped because the consequences based on those lies are going to be draconian for future generations.
This is **excellent** news but I would question even the “observed” 0.15 degrees per decade “warming trend”.
Just think of the factors which can influence temperature measurements. They include urban “heat island” effects, the repositioning of some measuring stations and so on.
Look at this article (for example) –
https://wattsupwiththat.com/2010/03/21/find-the-weather-station-in-this-photo/
Quote – “We have now looked at 18 separate stations (out of a total of 103), in three separate categories. So far, **not one** of these stations meets the criteria of being “away from large urban centres” and the CRN quality standards of NOAA/NCDC in terms of siting. ”
– end quote
Also here –
https://wattsupwiththat.com/2013/06/29/aging-weather-stations-contribute-to-high-temperature-records/
Quote – “New paper finds that aging weather stations record much higher daytime temperatures, 1.63°C higher than new stations
While we are all watching the heat wave developing in the US southwest, here is something to consider. **Albedo** (reflectivity) on the surfaces of weather station shelters changes with time, something I and the volunteers have documented with the Surface Stations project.”
– end quote
I would also like to know what the “measurement error” is in that 0.15 degrees figure.
When you consider that (and factor in the things mentioned), I find it laughable that anyone can claim **any warming trend at all! **
The facts are adjusted to fit the conclusion. Warming is real. Manmade CO2 is the cause. We must restrict fossil fuel use, tax carbon, and produce electricity only from solar, wind, and maybe hydro. The Climate Ayatollahs have spoken. Now kneel and pray for the next cargo ship from China to arrive.
{sarc}
the correct answer is “intentionally perpetuated fraud”
Smoking Guns!!
https://www.marketforum.com/forum/topic/57636/