
Ebru Kirezci, University of Melbourne and Ian Young, University of Melbourne
Over the past two weeks, storms pummelling the New South Wales coast have left beachfront homes at Wamberal on the verge of collapse. It’s stark proof of the risks climate change and sea level rise pose to coastal areas.
Our new research published today puts a potential price on the future destruction. Coastal land affected by flooding – including high tides and extreme seas – could increase by 48% by 2100. Exposed human population and assets are also estimated to increase by about half in that time.
Under a scenario of high greenhouse gas emissions and no flood defences, the cost of asset damage could equate up to 20% of the global economy in 2100.
Without a dramatic reduction in greenhouse gas emissions, or a huge investment in sea walls and other structures, it’s clear coastal erosion will devastate the global economy and much of the world’s population.
In Australia, we predict the areas to be worst-affected by flooding are concentrated in the north and northeast of the continent, including around Darwin and Townsville.

Our exposed coasts
Sea levels are rising at an increasing rate for two main reasons. As global temperatures increase, glaciers and ice sheets melt. At the same time, the oceans absorb heat from the atmosphere, causing the water to expand. Seas are rising by about 3-4 millimetres a year and the rate is expected to accelerate.
These higher sea levels, combined with potentially more extreme weather under climate change, will bring damaging flooding to coasts. Our study set out to determine the extent of flooding, how many people this would affect and the economic damage caused.
Read more: The world may lose half its sandy beaches by 2100. It’s not too late to save most of them
We combined data on global sea levels during extreme storms with projections of sea level rises under moderate and high-end greenhouse gas emission scenarios. We used the data to model extreme sea levels that may occur by 2100.
We combined this model with topographic data (showing the shape and features of the land surface) to identify areas at risk of coastal flooding. We then estimated the population and assets at risk from flooding, using data on global population distribution and gross domestic product in affected areas.

Alarming findings
So what did we find? One outstanding result is that due to sea level rise, what is now considered a once-a-century extreme sea level event could occur as frequently as every ten years or less for most coastal locations.
Under a scenario of high greenhouse gas emissions and assuming no flood defences, such as sea walls, we estimate that the land area affected by coastal flooding could increase by 48% by 2100.
Read more: Water may soon lap at the door, but still some homeowners don’t want to rock the boat
This could mean by 2100, the global population exposed to coastal flooding could be up to 287 million (4.1% of the world’s population).
Under the same scenario, coastal assets such as buildings, roads and other infrastructure worth up to US$14.2 trillion (A$19.82 trillion) could be threatened by flooding.
This equates to 20% of global gross domestic product (GDP) in 2100. However this worst-case scenario assumes no flood defences are in place globally. This is unlikely, as sea walls and other structures have already been built in some coastal locations.
In Australia, areas where coastal flooding might be extensive include the Northern Territory, and the northern coasts of Queensland and Western Australia.
Elsewhere, extensive coastal flooding is also projected in: – southeast China – Bangladesh, and India’s states of West Bengal and Gujurat – US states of North Carolina, Virginia and Maryland – northwest Europe including the UK, northern France and northern Germany.

Keeping the sea at bay
Our large-scale global analysis has some limitations, and our results at specific locations might differ from local findings. But we believe our analysis provides a basis for more detailed investigations of climate change impacts at the most vulnerable coastal locations.
It’s clear the world must ramp up measures to adapt to coastal flooding and offset associated social and economic impacts.
This adaptation will include building and enhancing coastal protection structures such as dykes or sea walls. It will also include coastal retreat – allowing low-lying coastal areas to flood, and moving human development inland to safer ground. It will also require deploying coastal warning systems and increasing flooding preparedness of coastal communities. This will require careful long-term planning.
All this might seem challenging – and it is. But done correctly, coastal adaptation can protect hundreds of millions of people and save the global economy billions of dollars this century.
Ebru Kirezci, PhD candidate, University of Melbourne and Ian Young, Kernot Professor of Engineering, University of Melbourne
This article is republished from The Conversation under a Creative Commons license. Read the original article.
Based on the Tol FUND model damages the majority of damaged come from people who will MOVE to the sea level impacted areas.
No adaption is required, just changing the planning policy of supposed future flood areas.
Here in Melbourne where the authors are from, there is already existing sea level rise policy for new buildings.
Thus the already small impact will become non existent
Oh dear, people living in areas of coastal erosion are now told it’s climate change.
A cliff exitst for a reason.
No no no, cliff erosion is a new phenomenon that didn’t happen until the invention of the Ford Bronco. Before the Ford Bronco, cliffs spontaneously generated themselves through cliffmosis.
Might, may, could, would, maybe, perhaps? Geez, what a bunch of weasels. I could win the LottoMax tomorrow night, and might give every commenter here on this post a million bucks. (It is $80 Mil) But then I would have to buy a lottery ticket, and I don’t waste my money on odds so long, that it will never happen. The odds are just as great that the sea level might, may, could, perhaps also go down by 3-4 mm a year by 2100. Or did they consult with an astrologer? How can they say BS like this and get away with it?
Earthling
They are paid to say it. They more they support the religion the greater the chance over long-term funding.
And there no maybe, could etc about that.
Regards
We are at the level where claims will come that space aliens may decide to exterminate us to save earth, because we dont care about climate change a new study says. Pure trash science fiction ad hoc stupidity. I bet I could start a cult with earth friends that will re colonise earth after the alien extinction, made up by stoned vegan hippies willing to do anything the aliens tell them to, through me of course.
I am losing gaith in humanity, rational humans are few and far between.
Commenting just in case – I could use the dosh
Quit predicting so far out. By 2030, it’s too late to change anything so it’s party time after that!😀
“Results show that for the case of, no coastal protection or adaptation, and a mean RCP8.5 scenario, there will be an increase of 48% of the world’s land area, 52% of the global population and 46% of global assets at risk of flooding by 2100.”
“Results show that for the case of, no coastal protection or adaptation, and a mean RCP8.5 scenario, there will be an increase of 48% of the world’s land area, 52% of the global population and 46% of global assets at risk of flooding by 2100. ”
https://www.nature.com/articles/s41598-020-67736-6
I thought RCP 8.5 had been dismissed as “delusional” ?
Even the IPCC said it was not a realistic prediction but an outlier to give some idea about total runaway climate. I don’t think I ever seen even the most rabid global warmers admit to expecting RCP8.5 because it is nearly physically impossible and major adaptations will have to be put in place well before 2100.
They also used RCP 4.5. But don’t go into how detrimental that may be. Gotta preserve the meme; don’tcha know.;)
It will cost 20% of the global economy by 2100? Even if were true, that is a hell of a lot better than over 50% of the global economy being destroyed by “green” energy scams.
(Oh, by the way, there is a very simple way to move people in the First World out of flood zones. Just stop subsidizing the issue of any flood or sea surge insurance for those areas. This has worked quite well here in Arizona. Places like Bangladesh are a different and far more difficult problem, however.)
It will cost 20% of the global economy by 2100?
Did you notice the cute math trick they pulled?
Under the same scenario, coastal assets such as buildings, roads and other infrastructure worth up to US$14.2 trillion (A$19.82 trillion) could be threatened by flooding. This equates to 20% of global gross domestic product (GDP) in 2100.
So, as I read it, the sum total of over a century worth of construction will be worth 20% of ONE year of GDP. Less than 0.2% per year, and that’s a WORST case scenario with NO mitigation strategies implemented. What property owner (or country) is going to watch sea levels rise and do NOTHING for the next 80 years?
Their tricks are more duplicitous than that. They say 20% of global GDP could be at risk. This is a percentage of an annual productivity. The likelihood of all that amount of damage occuring in a short period of time is ridiculously tiny, but they imply it. T hey keep suggesting that insurance companies are not competent to judge future risk from climate change even though they have all the relevant data and have been perfecting their risk models for hundreds of years. They don’t say what the at risk number is today. Nor do they seem to be aware that the annual GDP also contains the amount spent on repair and reconstruction.
The Chinese understand the pseudo science of AGW and continue to commission a new major coal plant every week. And they have more than 300m people living on the coast.
Anybody who invokes the RCP 8.5 at this point is a scientific fraud.
Thank you, David M.H.
“Under the same scenario, coastal assets such as buildings, roads and other infrastructure worth up to US$14.2 trillion (A$19.82 trillion) could be threatened by flooding. This equates to 20% of global gross domestic product (GDP) in 2100.”
That would place global GDP in 2100 at $71 trillion.
Global GDP in 2019 was already $88 trillion (nominal) or $138 trillion (PPP).
Since the GreenMarxist goal is to have no industry, No power, no economy, no hope, then 20% of nothing will be a negligible amount. No worries, be happy.
We can all make a living doing each others laundry.
You assume they will let us have clothes.
We’ll be warm enough to not need clothes. Yippee!
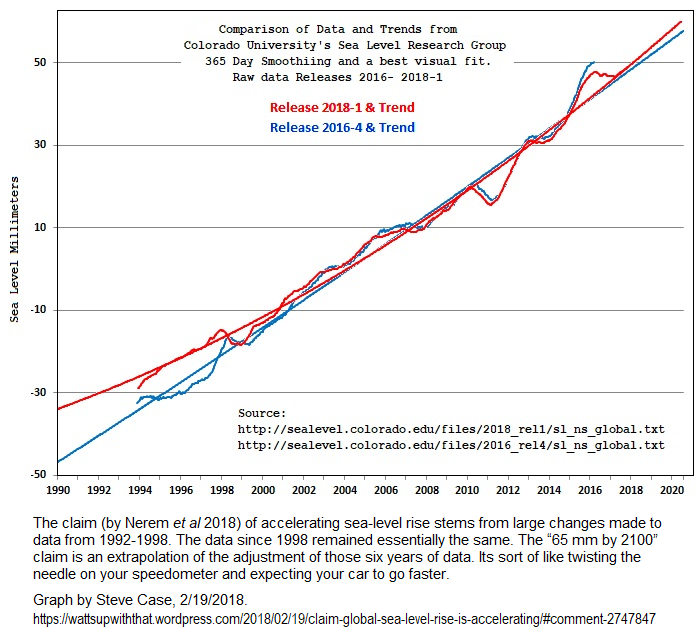
In 2017 Nerem et al studied the NASA satellite sea level readings and after fitting a quadratic curve from 23 years of values extrapolated to 2100. In my paper “Accelerating Sea Level Rise – Reconciliation of Tidal Gauge Readings with Satellite Data” I queried both these concepts and proposed that the deviation of the satellite readings from the linear best fit line was just as good using a 22 year sinusoidal variation. Over the last 2 year or so I have continued to analyse the NASA readings as they are released every month or two. These extra readings have gone to show that the fit of the sinusoidal variation has improved, and a slightly modified equation derived. The next 2 years may be sufficient to show which approach is best but, in the meantime, I am showing 3 related plots.
First the NASA data is plotted, and the best linear and quadratic curves fitted.
https://drive.google.com/file/d/1kfAV7IJc7E5oxMdg4vhoFrhNlWdkwqbv/view?usp=sharing
Secondly the raw NASA readings are used to calculate how much they vary from the linear best fit. Plotting these makes it easier to see the trends whilst still giving the same acceleration. The figure
https://drive.google.com/file/d/1ejy1eKEszPGp8E2b-oiIdY-PGaKuOTQl/view?usp=sharing
shows the residual values (actual reading minus linear fit) drawn as the blue dotted line.
the Nerem best fit quadratic plotted as the grey line showing an acceleration of 0.0994mm/year2
The “best fit” sinusoidal curve appears as the orange line (=3.4*SIN(PI()*((4+2*A1)/23)) in Excel Format) and
the difference between Nerem’s quadratic and the sinusoidal is shown in yellow.
The next the figure
https://drive.google.com/file/d/1xpysI8S95k21z0YgYeq9W3br3jZgSjh_/view?usp=sharing
shows another aspect of the Nerem approach that indicates that the perceived acceleration is mainly due to the method used and is not inherent in the actual data.
This figure again shows the residual values (actual reading minus linear fit) drawn as the blue dotted line
The green dotted line is a quadratic best fit
The Sinusoidal curve is shown as the red line
and the red dotted line shows a best fit quadratic line based on the sinusoidal values giving an acceleration of 0.0732 mm/year2 nearly 75% of the Nerem value. This is due to the short period of about 25 years considered and the starting date of 1993 which is plotted as t=0.
In case anyone as missed my original work, or my references to it have got lost in the recent changes the 3 relevant files are
https://drive.google.com/file/d/17lXnNtsLSlzSOx7tRvbDPwYMDibpvXKG/view?usp=sharing
https://drive.google.com/file/d/1UfuXDp1-bxLC5rzw7gapSXRqhMuJTGx3/view?usp=sharing
and
https://drive.google.com/file/d/1vlFt1nPRREGsh_5qvYEunOLJoMBdIYqA/view?usp=sharing
I looked at this data set back in 2016. (Data through June)
My quadratic values are quite different from yours, differing by a factor of 3 or more (!)
This is perhaps a cautionary tale of doing a second order fit where:
1) the curvature is very small, and
2) there is lots of variation in the data.
Just a few extra years of data had quite an impact on the calculated values.
I was doing a fair bit of tide gauge data back then, my favorite was Boston. The record starts at Jan. 1921 and is almost unbroken. One feature of this long data set is the sine wave which is caused by the nodal precession of the moon. The nodal precession has a period of 18.60 years. In the tide gauge record, it manifests as a sine wave with a period of *exactly* 4x, or 74.4 years, with a half-wave of 37.2 years. I have *no idea* why it shows up as 4x the base period. In any event, this precession shows up in tide gauge records in many locations, sometimes more, sometimes less.
On big feature of this precession, is the trend is on the upswing since ~1970.
So……
If you start a SLR graph anytime between 1970 and 1985, and plot with a quadratic fit, you have “discovered” acceleration in the Sea Level Rise. OMG! Gorbal Warmling – IT’S WORSE THAN WE THOUGHT(tm). Which, of course, is exactly why they do that. (They never mention that when you plot all the data, the sine wave trend of the data is unmistakable.)
I have no idea how the nodal precession effect will show up in the Sat. data, which nominally, is supposed to be global. But this data set has been processed, corrected and adjusted so much, I am not sure how reliable it is for such small and long term second order effects.
Thanks for your comments
The accelerations are very sensitive to period used. Using the NASA data (not modified as with Nerem) I calculated the slopes and accelerations using data starting from 1993 to 2002, then 1993 to 2003 and so on in steps of 1 year up to recent 1993 to 2019. As you can see from the graph
https://drive.google.com/file/d/1GOB-36lTdJykqA5MMpXNh52UGedHZ275/view?usp=sharing
the acceleration for the period 1993 to 2016 is greatly reduced and for 1993 to 2012 it even gave a small de-acceleration. So it was all down to when you start and the period used, But still Nerem gets away with it.
The acceleration in the Tidal Gauge reading showed up when I analyzed the CSIRO results which I put down to an approximate 60 year cycle. See
https://drive.google.com/file/d/1UfuXDp1-bxLC5rzw7gapSXRqhMuJTGx3/view?usp=sharing which shows this up nicely.
Curious, your CSIRO data shows a persistent curvature across the whole 100 years of the data set. You superimposed your sine wave on top of that curve.
The Boston data set is absolutely straight. The quadratic curve lies right on top of the linear curve, totally covering it. Even when plotted in different colors, the two lines are virtually indistinguishable. (what tiny curve there is, happens to be negative(!))
So how can we have SLR acceleration in one corner of the globe and not another?
CSIRO, hmmm…….
If you look at the site below they plot the Tidal Gauge Readings from 1880 to 2013 and there is a definite curve. Downloading the readings and fitting curves gave an average slope of 1.6 mm/year and an acceleration of 0.0126mm/year2 – much smaller acceleration than Nerem. I did show that could be due as part of very long behavior over long periods in the region of 1000 years and so would not be long term acceleration but part of a short part of a sinusoidal variation. Individual places have their own variations. I recently contacted CSIRO and asked about updating to 2020 the readings. They were very helpful but it seems satellites rule the day – pity such a great data set is not maintained.
https://climate.nasa.gov/vital-signs/sea-level/
Nerem is a mess. It’s based exclusively on satellite altimetry. They ignored the much higher quality coastal (tide gauge) measurements, entirely.
What’s more, they created the “acceleration” which they reported by revising 15 year-old Topex-Poseidon data, to slow the rate of sea-level rise which that long-retired satellite had measured before 2003, thus creating the appearance of acceleration in the recent data, by comparison.
What such revisions really show is how malleable & unreliable satellite altimetry “measurements” are, compared to tide gauges—which show zero SLR acceleration:
https://sealevel.info/satellite_altimetry.html
As usual, Steve Case is on the case:
I live about 5km from the first photo which is at Wamberal ,Central Coast NSW..
This area has been constantly eroded as the houses were built on sand hills without any buffer zone.
Access to the beach has been and is through a block called “the ruins” where a house stood and was washed away in 1974.
Just about 2km south is the suburb of North Avoca and there was no damage to the houses there because they have a buffer zone sand dune in front. The sand dune has been eroded but will be replenished in summer.
The council has fought the building of protection walls as this generally scours out the beach which is a public space.
It is rubbish to suggest that sea level change has increased as Fort Denison in Sydney Harbour records an annual sea level rise of about 1.8MM per year and this has been linear for a century at least.
Ditto for Collaroy.
The houses are so valuable that the Northern Beaches council tried to buy back the properties many years ago but were unsuccessful.
The properties at Wamberal are vaued up to AUD 6 million and at Collaroy up to AUD 10 million.
Yeah but people who KNOW that the seas are rising dangerously would never buy a seaside property.
Except Barack & Michelle of course, because back in 2015 there was this moment when he stopped the seas from rising.
Or so his teleprompter told him.
It’s a very, very nice house:
https://www.sealevel.info/Obama_seaside_villa_Marthas_Vineyard/
(scroll down for photos)
Not even even of the usual MSM suspects in Australia are linking the Wamberal to climate change because they all know the issue has been around since the 1950’s and the first major problem in the 70’s as you noted. This is a typical clueless university dropkick proving how stupid and biased they really are.
More importantly, I believe that the recent erosion at Wamberal (affecting as I understand it maybe twenty or thirty houses) was caused by high tides due to a deep ‘East Coast Low’ pressure system (i.e. being a common enough phenomena here in Oz to deserve its own name!), which I doubt can be demonstrated to be due to ‘climate change’. Maybe building some groynes out from the high tide mark could arrest the scouring of sand from this particular stretch of beach, as is common elsewhere. Otherwise, caveat emptor!
RCP 8.5.
Fail!
Why does anybody bother with the one sided Conversation?
Why did these people buy property so close to eroding cliffs in the first place? I’ll bet for every person that bought land there, at least 100 walked away because they could see that eventually the cliff would erode.
It reminds me of people who buy homes on a floodplain and are surprised when their homes are periodically flooded.
There’s one borne every minute they say.
I believe they were promised a defensive concrete sea wall (If it is the Aussies you refer to)
More complicated than that, the residents are actually willing to to build there own sea walls. The problem is the end of you wall may make it worse for the properties next door and so you will face a damages claim and the council for allowing it. Hence the council won’t allow any single resident to build a wall.
What they need is a plan, legislation and an agreement to do all the walls at the same time. Hence the debacle has dragged on for 70 years.
From what I have read about this study, in order to make its dire predictions it is counting on the collapse of the Thwaites Glacier in West Antarctica, causing sea levels to rise 3 metres due to that. The collapse would allegedly begin within decades.
https://www.dailymail.co.uk/sciencetech/article-8576745/Coastal-flooding-predicted-rise-50-cent-2100.html
Yeah. Sure.
Obama, AlGore, Billy Gates, just everyone who purchased sea level properties & mansions should probably start to worry, sell and invest in zombie apocalypse style concrete tower bunkers and float planes.
Bill Gates’s house is actually on Lake Washington, which is not affected by the sea level.
https://www.realtor.com/news/celebrity-real-estate/bill-and-melinda-gates-purchase-beach-house-in-del-mar/
He just dropped $43M on this, which falls under the “sea level properties & mansions” category.
You thought Bill Gates only owned one house? That’s precious.
Al Gore’s “oceanfront” property in SoCal is actually 3km inland and 60m above sea level.
Nobody said SoCal or even oceanfront (despite your quotes).
Condo he bought in San Francisco is less than a half-mile from the ocean. Old USGS map says the elevation there is 25′, but there are online development plans nearly along that same 25′ contour that say it is more like 8′.
Regardless, in AIT, Gore said a 20-foot sea level rise was possible “in the near future.” That would certainly threaten his SF condo building at a minimum.
When actual prices of coastal real estate starts falling with falling demand, then I’ll believe this is serious.
What the F$tards haven’t bothered to understand is that this damage is from East Coast Lows, not sea level rise. According to the “science” – the frequency and intensity of ECLs is forecast to REDUCE with the forecast climate change. It’s not hard to find. https://coastadapt.com.au/cyclones-and-east-coast-lows The BOM says “no trend” http://www.bom.gov.au/weather-services/severe-weather-knowledge-centre/eastcoastlows.shtml
In two days, tropical storm will cause flooding in Florida.
Erosion, been happening for thousands of years. Don’t build where it can happen and don’t build on a flood plain.
I was discussing this the other day and pointed to a NOAA page that gives a figure of 1.8mm/yr global sea level rise, with local variations due to subsidence or uplifting. Where does this author get the 3-4mm/yr value? Do they have some special gravitational forces at work around Australia?
https://tidesandcurrents.noaa.gov/sltrends/slrmap.html
“Do they have some special gravitational forces at work around Australia?”
My model indicates that this is due to the “Heavyweight” research conducted in Australia on the topic of Sea Level Rise. Studies Suggest that as this ponderous research continues to accumulate, the gravitational field from all this added mass will steadily intensify. SLR will continue to be shown to be increasing geometrically, as a result.
Glad I could help.
I believe density is also a leading factor!
NOAA uses ground-based tidal gauges, a technology that has been in use for over a century now.
The 3-4mm per year figure comes from satellite-based altimetry, a technology introduced in the 1990s.
By pure coincidence (of course), the rate of sea level rise jumped from 3 mm/year exactly when the satellites were introduced.
Arrgh! Forgot that “less than” and “greater than” signs are trapped. The last sentence should read:
By pure coincidence (or course), the rate of sea level rise jumped from less than 2 mm/year to greater than 3 mm/year exactly when the satellites were introduced.
The economy today is 20% less than it could have been had other policies prevailed. Do you notice?
What trash. “Sea levels are rising at an increasing rate…” No they aren’t. Sea level is relative to land level, and it is unique to each location. Some places are subsiding, others are rebounding.
Could, maybe, expected: weasel words that mean nothing is going to happen, we just want to terrify you.
We need impact laws that require that any company/contractor/entity building a building within 200ft ASL must now escrow emergency clean-up funds and a complete strip-out plan in order to deal with pollution their building will cause should sea level rise.
Additionally the first 200 feet ASL of all new construction must be IMMUNE to water inundation and saturation, this includes sewage, storm systems, water, power, internet and all other functions.
Cities within 200 feet ASL may no longer charge property tax from any existing property as this is disaster profiteering, they must convert to taking no more than 2x the going property tax rate and placing it into Federal disaster escrow for said properties for when the tide comes.
Any existing agriculture within 200ft ASL must be given right-of-way to higher land in the immediate climate/area/biome without any qualification or limitation. All priority of re-enplacement must be given to agriculture and natural supplies. Planning, zoning and placement must preceed water intrusion by a minimum of 200 meters as the sea level rises.
Blah bleh buh buh bleh blaw bwuah buh bmeh baop blah blough beighlp blehp.
If the “crisis” was real, there would be real planning. There is no crisis. The glaciers are already displacing their mass in magma.
Literally 100% of the planet is stupid and so poorly educated they cannot see this.
The Netherlands is a rich, low-lying country that rarely floods.
Bangladesh is a poor, low-lying country that continually floods.
Conclusion: there is more Global Warming in Bangladesh than there is in Holland.
Can I have my grant now, please?
“Over the past two weeks, storms pummelling the New South Wales coast have left beachfront homes at Wamberal on the verge of collapse. It’s stark proof of the risks climate change and sea level rise pose to coastal areas.”
PROOF!! jeez mate, you’re easily swayed, I mean paid.
Maybe it’s just weather.
Was one of the most intense storms (Sygna) along the NSW coastline back in 1974 “stark proof” of climate change, or was that just stormy weather combined with a high tide?
Remember back a bit further to say 1703, a severe storm battered the UK it lasted more than a week, and killed thousands of people. It washed away the lowest street of houses in the village of Brighthelmstone (today’s Brighton). Was that “stark proof” of climate change too?
……and because you eggheads love to bring up Bangladesh at every opportunity, do you remember the tragic Backerganj cyclone of 1876 killing about 200,000 people, so much “stark proof” there.
Pitiful level of historical knowledge.
By 2100 almost no adults alive today will still be around. This is an unfalsifiable prediction, like so many others.
So sorry, this post reads as though I am predicting that almost no adults around today will be alive in 2100! Unfortunately, this prediction is certainly falsifiable and almost certainly true. Interchange the two sentences and the post makes far more sense.
Even if climate warms these studies vastly underestimate the flexibility of the economy. Business and people adjust to change in efficient ways.
They assume that everyone else is as dumb as the climate scientists, and would keep rebuilding in the same spots over and over again.
Over the last 10,000 years, sea levels have increased something like 6 feet, and somehow, civilization kept trucking.
A few years ago, a storm washed a couple of feet of sand off “our” beach. The cries of lost tourist revenues, the cost to dredge and replace the sand were considered but too immense so not done….last year another storm brought the sand back….no word of monetary effects….apparently weather-caused waterfront changes are only expected to COST taxpayers bigly.
Meanwhile, in the real world, 61 consecutive years of heavy CO2 emissions and monotonically rising CO2 levels have resulted in no significant, detectable acceleration in sea-level trends. In fact, in the great majority if long, high-quality measurement records there’s been no acceleration in rate of sea-level rise since the 1920s, or even earlier.
That includes Australia. This is Australia’s longest, highest-quality sea-level measurement record:
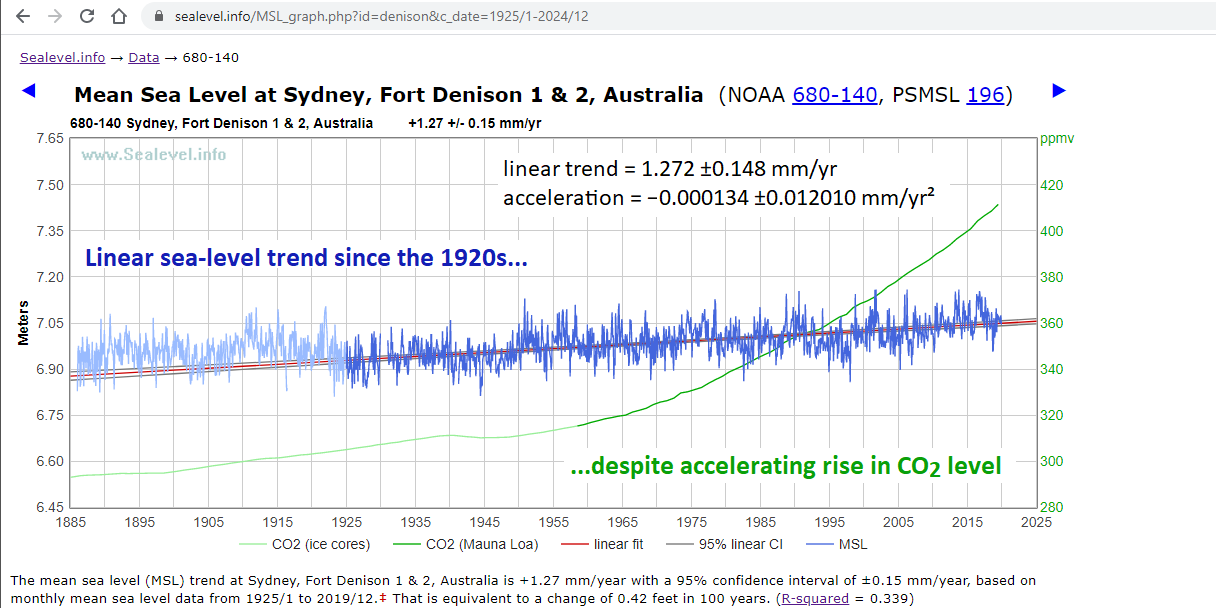
https://sealevel.info/MSL_graph.php?id=denison&c_date=1925/1-2024/12&lin_ci=0
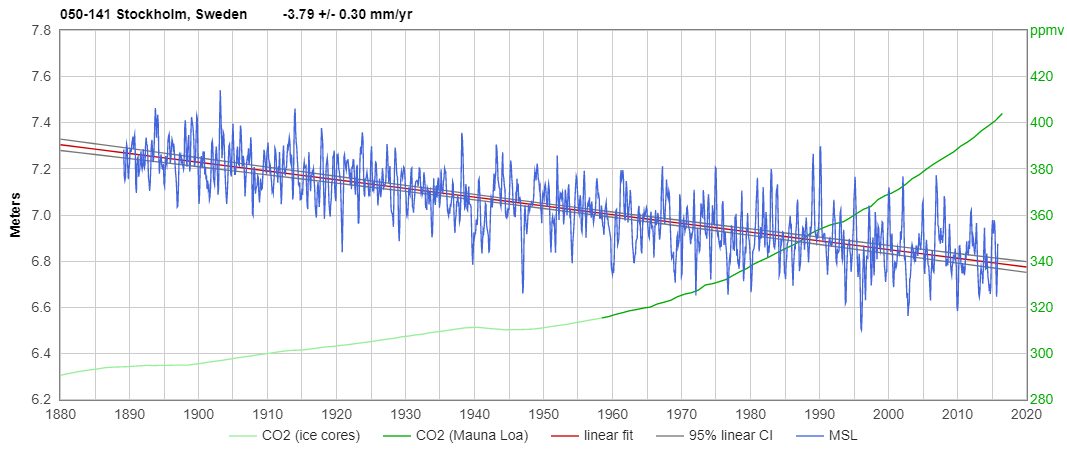
In fact, the global average sea-level trend is so minuscule that in many locations it is greatly exceeded by local factors, like sedimentation, erosion, and vertical land motion. Places with high rates of vertical land motion, like New Orleans (sinking) and Stockholm (rising), have sea-level trends which are very different from the global average. Greta Thunberg’s hometown is a example:
Some people think that global warming “simply must” cause accelerated sea-level rise because, after all, it melts ice, doesn’t it?
The answer is that, yes, it can melt ice, if the ice is already close to its melting point, but as the climate warms at high latitudes (where most warming occurs), it also increases snowfall on ice sheets and glaciers, adding to ice accumulation, reducing sea-level, and offsetting sea-level rise from other factors. Here’re some papers about it:
1. https://www.nature.com/articles/s41558-018-0356-x
2. https://www.nature.com/articles/354058a0
3. https://cp.copernicus.org/articles/13/1491/2017/cp-13-1491-2017.html
DB, the Australian Govt BoM data for the total record of sea levels at Fort Denison from May 1914 to June 2020, actually shows a fall in MSL of 63 mm [2.5 inches] for that 106 year period:
http://www.bom.gov.au/ntc/IDO70000/IDO70000_60370_SLD.shtml
And we must remember that Fort Denison is in a stilling pond [Sydney Harbour] adjacent to the broadest piece of ocean in the world.
Nothing happening. Only weather and storm surge.
Sea-level there spiked slightly (by about 10 cm) for around twenty years, between about 1902 and 1922. 1914 was within that “spike,” so average sea-level that year was slightly on the high side, which makes simply comparing graph endpoints a bit misleading.
I don’t know why the ABoM and PSMSL only report measurements at Ft. Denison back to 1914, since NOAA has data for Ft. Denison all the way back to January, 1886. NOAA has a note on their page for Ft. Denison which says:
“Under a scenario of high greenhouse gas emissions and no flood defenses, the cost of asset damage could equate up to 20% of the global economy in 2100.”
Kind of like saying if the Dutch had never built dikes the cost of asset damage could equate to . . .
Bjorn Lomborg gives a good drubbing to such inanities on pages 22-24, 30-34, and 185-188 of False Alarm. For example, one alarmist study projects sea level rise could inflict $100 trillion in damages, or 11% of global GDP, by 2100. But that’s only if we don’t adapt. The same study implies that, with reasonable projections of adaptation, the number of people flooded drops from about 3.4 million people in 2000 to about 15,000 per year in 2100. Bjorn writes: “Yes, dike costs will increase to $48 billion, and flood damages to $38 billion. But the total cost to the economy will actually decline, from 0.05 percent of GDP to 0.008 percent. And a 99.6 percent reduction in flood victims will be an undeniable victory.”
“Under a scenario of high greenhouse gas emissions and no flood defences,”
“However this worst-case scenario assumes no flood defences are in place globally. ”
Assuming that the entire population of the earth agrees to stop doing flood control, as humans have been doing for around 8000 years, if you ignore the insurance industry, which parts of the world have been practicing for 300 years (and requires continuous “investment” against future setbacks) then bad things could happen.
Suitable for scaring children. We miss you, Ed Wood.
‘the oceans absorb heat from the atmosphere‘
Really? How does that work?
Best,
Willem
Who knew that “climate justice” was out there but we did not have a clear picture from its promoters that it really means you get to pay for NYC subway upgrades, beachfront condos, and freshman-level geology lessons of land subsidence in delta regions like south Louisiana and Bangladesh. You will be told at the proper time when you are powerless to stop the wealth transfer.
The city of Townsville is in danger? Of flooding? Call the Powerpuff Girls! Or perhaps hire a few Dutch hydraulic planners.
This is kind of like when certain people figured out when and where solar eclipses would happen and then claim they had some kind of magical power to make them happen.
…..”research finds coastal flooding may cost up to 20% of global economy by 2100″
That is entirely provable right now.
No matter what the global economy is in 2100 it can be said that it will have been 20% better without coastal flooding.
See how that works in the woke world.
Make a claim that can never be disproven and you get to pretend as though it is a scientific finding.
In other news, the Sun MAY go nova tomorrow.
Not very likely, but the probability of it happening is not zero. Should I be worried . . . no.
It also did this erosion when MSL of Sydney was about 7cm lower than today, about 53 years ago (13.5mm/decade). It rose 6.4mm/decade from 1900 to 2000, the whole data to Dec 2019 has a rise of 7.6mm/decade. Some recent decades may indicate 20 to 28mm per decade but confidence interval is large (of the same order), cycles of 28 years show ups & downs. More corrections may have now been applied to the sensor data so it’s hard to keep track of reliability.
http://sealevel.info/MSL_graph.php?id=680-140
Sea level rise does not appear to be the major factor when you look at the timing and trends. It’s a sandy shoreline with a lack of natural rocky protections and open to water action at the base of the sand dune that erodes what is behind the existing coastline. Therefore what’s above falls down with nothing supporting it and then can also be washed away. If they built upon rock, it would have lasted much longer.
“Build on the rock and not upon the sand” Matthew 7:24-27 for the long quote.
How to you reply to low level drivel? Much of this work was covered before 1970. Sedimentologists like Robert Deitz had already identified beach dune migration systems that explained the deposition and erosion of beaches. He also provided the advancing paralic wedge model to explain how a body of sand migrates upwards and across the continental shelf, creates a strandline when a retreat takes place and then continue as before once sea level rises. Fairbridge in 1960 produced an excellent model of sea level changes including advances and retreats from 30,000 yrs BP. Drill proven to confirm his modeling – no computers involved just good hard geology that has stood the test of time.
If the citizens want to build close to the beach line their dwellings interfere with the shape of the wave taking it from a deposition cycle to the erosive cycle during storms and increasing the wind speed due to the venturi effect. Most beaches with only vegetation behind them can withstand the heavy storms of recent times. Beaches with dwellings near them suffer accordingly. In summary there is no good news for the owners of houses built on the dune headland at Wamberal Beach.
The only mechanism that may work is to dump the heavy basalt boulders behind the breaker line and create a wave platform for the waves to hit. That may dissipate the energy of the winter erosive wave a little, allowing for the possibility of deposition to take place rather than erosion.
To paraphrase-“The moment you see the words projections or projected reach for your wallet – you’re being had”
H/t to Congressman Hank Johnson. Everyone knows that the population of Australia has been and will continue to increase, its is this extra weight that is causing Australia to sink into the oceans.
(I think this has as much scientific weight as this ‘research’ from Melbourne University!)
Another factor involved in wall collapse is the design of agricultural drains and their misuse. This wrong design has been in newspapers about sea wall collapse in Oz in the past months. Nothing to do with climate change!
https://www.cornellengineers.com.au/how-agricultural-drains-wreck-houses/
Model fantasies and confirmation bias validations that result in new doom estimates. Simulated estimates that result in doom predictions for 2100…
Yeah, right!?
How about a prediction for next year? A result that is independently verified?
Not likely. There is no satisfaction from total failures; better to drool over their extreme opinion based estimates.
Truly pathetic