Comprehensive compilation of pre-historic temperature records shows that global warming is reaching levels not seen for at least 6,000 years
NORTHERN ARIZONA UNIVERSITY

Over the past 150 years, global warming has more than undone the global cooling that occurred over the past six millennia, according to a major study published June 30 in Nature Research’s Scientific Data, “Holocene global mean surface temperature, a multi-method reconstruction approach.” The findings show that the millennial-scale global cooling began approximately 6,500 years ago when the long-term average global temperature topped out at around 0.7°C warmer than the mid-19th century. Since then, accelerating greenhouse gas emissions have contributed to global average temperatures that are now surpassing 1°C above the mid-19th century.
Four researchers of Northern Arizona University’s School of Earth and Sustainability (SES) led the study, with Regents’ professor Darrell Kaufman as lead author and associate professor Nicholas McKay as co-author, along with assistant research professors Cody Routson and Michael Erb. The team worked in collaboration with scientists from research institutions all over the world to reconstruct the global average temperature over the Holocene Epoch–the period following the Ice Age and beginning about 12,000 years ago.
“Before global warming, there was global cooling,” said Kaufman. “Previous work has shown convincingly that the world naturally and slowly cooled for at least 1,000 years prior to the middle of the 19th century, when the global average temperature reversed course along with the build-up of greenhouse gases. This study, based on a major new compilation of previously published paleoclimate data, combined with new statistical analyses, shows more confidently than ever that the millennial-scale global cooling began approximately 6,500 years ago.”
Earlier this year, an international group of 93 paleoclimate scientists from 23 countries–also led by Kaufman, McKay, Routson and Erb–published the most comprehensive set of paleoclimate data ever compiled for the past 12,000 years, compressing 1,319 data records based on samples taken from 679 sites globally. At each site, researchers analyzed ecological, geochemical and biophysical evidence from both marine and terrestrial archives, such as lake deposits, marine sediments, peat and glacier ice, to infer past temperature changes. Countless scientists working around the world over many decades conducted the basic research contributing to the global database.
“The rate of cooling that followed the peak warmth was subtle, only around 0.1°C per 1,000 years. This cooling seems to be driven by slow cycles in the Earth’s orbit, which reduced the amount of summer sunlight in the Northern Hemisphere, culminating in the ‘Little Ice Age’ of recent centuries,” said Erb, who analyzed the temperature reconstructions.
Since the mid-19th century, global warming has climbed to about 1°C, suggesting that the global average temperature of the last decade (2010-2019) was warmer than anytime during the present post-glacial period.
McKay, who developed some of the statistical approaches to synthesizing data from around the world, notes that individual decades are not resolved in the 12,000-year-long temperature reconstruction, making it difficult to compare it with any recent decade. “On the other hand, this past decade was likely cooler than what the average temperatures will be for the rest of this century and beyond, which are very likely to continue to exceed 1°C above pre-industrial temperatures,” McKay said.
“It’s possible,” Kaufman said, “that the last time the sustained average global temperature was 1°C above the 19th century was prior to the last Ice Age, back around 125,000 years ago when sea level was around 20 feet higher than today.”
“Investigating the patterns of natural temperature changes over space and time helps us understand and quantify the processes that cause climate to change, which is important as we prepare for the full range of future climate changes due to both human and natural causes,” said Routson. He used an earlier version of the database to link Arctic warming to a reduction in precipitation at mid latitudes (see related article).
“Our future climate will largely depend on the influence of human factors, especially the build-up of greenhouse gases. However, future climate will also be influenced by natural factors, and it will be complicated by the natural variability within the climate system. Future projections of climate change will be improved by better accounting for both anthropogenic and natural factors,” he said.
The reconstruction of past global temperature is the outgrowth of several NAU research projects aimed at understanding the causes and effects of natural climate variability, work that was funded through more than $1.2 million in grants from the National Science Foundation. The team was recently awarded another $678,000 in grants from the NSF for related work extending through 2023.
###
I see the hockey shtick is back again, according to the cartoon. Welcome to the Adjustocene. My favourite new word, and it has a lot of new meanings.
Nah thats the hockey stick being debunked again. /
Many times.
First they had to eliminate the Medieval warm period, then they had to eliminate the Roman warm period. Now they have eliminated both the Minoan warm period and the Holocene optimum.
Anyone who believes that the Holocene optimum was only a few tenths of a degree warmer than it is today is either a liar, or totally incompetent.
No they’re still there but you have to look closely because they were weak and occurred at different times in different places and so aren’t going to be as prominent on a global average.
This is mixing incompatible data yet again. Ignoring time resolution which removes rapid variability from old proxy records.
Not only are they mixing data sets, but the red (recent) data has been adjusted upward. Furthermore, it does appear that they found the Holocene Optimum 6700 years ago, but their data lacks the resolution to show the three succeeding Warm Periods, the Minoan, Roman, and Medieval. They do show the steady cooling since the Optimum, but they fall for the falsified temperatures reported for the Modern Warm Period. They failed there completely.
The various methods for gleaning past temperatures from proxies are not the problem. They effectively are information regarding raw data. However, the red data is adjusted, and they should reject that and look at the raw data, which would change the recent temperature curve downward.
We also need to recognize that the urban heat island effect (UHI) is not a single adjustment to make to a temperature site’s data. They made one token adjustment years ago and consider it done. However, as the UHI effect increases with time, the downward adjustment has to be increased annually. The lack of adjustments for the growing UHI effect, which also grows when rural sites are closed, and the dishonest adjustments of the past (early 20th century) data downward to create cooling and recent data upward to create warming creates the supposed, fake upward trend of the red data above.
Why are they only going back 6500 years with the temperature reconstructions for this paper ?
Which temp reconstructions have been excluded ?
Do the reconstructions reflect the greatest worldwide spread ?
How was the data ‘processed’ and were the same methods applied consistently across the 6500 year time period ?
What happened to the MWP ? and the other warm periods.
We know that we are heading towards a glacial period at some point, the average temp over the thousand years 1000 – 2000 was lower than the previous thousands years, and that was lower than the previous thousand years. Any temperature fluctuations during each thousand year period are meaningless, it is the average which matters. Are we to assume any current warming will continue in the face of natural variation ?
the shtick now looks like a boomerang
Agreed Earthling2!
More delusional assumptions masquerading as science.
According to the article, decades are unresolved.
It is more likely that centuries are not well resolved, making any claims for high or low temperatures let alone anomalies unsupported.
It’s a nice graphic though. It even has a small furry animal in it. It’ll catch kindergartners’ attention.
what! no tree rings!??
PS love the “hockey shtick” & “Adjustocene” jabs!
This would be great if it were to be true. Staving off the descent into the cooling abyss of frigid death and simultaneously fertilizing the planet’s plant life from the sky. What’s not to like?
Totally, unless we overshoot.
Nah, it is an insurance policy on the next cooling cycle, like happens with natural variation. throughout history. It is the only thing we do know for sure, that climate oscillates in shot term and longer term cycles. If we could only be so lucky to warm up the entire good Earth, and not just Urban Heat Islands and significant land use changes, which is where we observe and record much of the weather/climate in action.
Humans are a part of earth, part of the natural world
For the climate religious I’m going to start telling them that the planet accidentally almost wiped all life during the last ice age, by mistake, as the CO2 content crept down close to 150PPM, humans and industrial society were created by earth/Gaia/god in order to restore CO2 levels to survival level.
Party on
“if it were to be true”
But it isn’t. !
We are just very fortunate to have had a period of strong solar cycles warming us from the coldest period in 10,000 years.
Indeed, monkeys will fly out of my rear end before a “climate scientist” makes a true prediction, or Loydo buys a calculator.
Pessimist
Please prove that an overshoot would be bad.
Secondly, since we still have at least 3C to go before we get back to the levels of the Holocene Optimum, please provide evidence that we will over shoot in the first place.
An overshoot to where the average temperature is 40C is obviously bad, just like CO2 going to 5,000 ppm would be detrimental. The reality remains that we are far closer to both levels being too low to sustain life than we are to an overshoot, and we aren’t doing anything that even the alarmists say would bring us to those levels.
Why would 5000ppm be bad? CO2 levels averaged 5000 to 7000ppm less than 100 million years ago.
5000ppm of Kool aid doesn’t seem to have had any affect on you either.
1. Global climate temperatures change over time naturally by a couple degrees.
2. For the past 6000 years the climate has cooled over the long run.
3. Cooler temperatures are worse than warmer temperatures. Worse in terms of crop yield, disease, life span, standard of living.
4. Even the IPCC admits that in any AGW, the first 1.5-2.0 C are net beneficial.
So even taking the paper at face value, there is a lot of benefits described. At
Stephen,
The paper suggests the nature rate of cooling is/was 0.1 degrees per thousand years. In contrast
human activities are responsible for warming at a rate of about 1.5 degrees per hundred years. That
is a massive difference and an increase of over 100.
The Nyquist sampling criteria and what it informs about observing cycles in nature totally eludes your conceptual thinking Izaak.
Joel,
there has been consistent warming over the last 100 years with short term flucuations. The sampling methods used would pick up a century of warming even if they wouldn’t detect short term evens like El Ninos. The current rate of warming is far higher that what has every been occured in the historical record even when averaged out. And it doesn’t show any signs of slowing down.
That’s simply not true Izaak, and if you have widely read climate reconstruction papers and papers on the modern thermometer based temperature records you would know that. There is nothing unusual about the modern warm period, the rate, or the absolute temperature, either in the thermometer temperature record, or proxies of the last few thousand years.
This new paper disagrees and contradicts thousands of previously published papers – it’s clearly just another alarmist propaganda headline grabber. Alarmists love to talk about consensus. Well the weight of published evidence says the consensus on this paper would be that it is junk science.
Izaak, the other problem with both the assertions in the write up (I did not read the actual paper) amd your assertion here is that half of the warming they point to happened before 1950, before which even the IPCC says it is possible to detect anthropogenic influence on climate, and the rate of warming from mid-19th century to 1950 is similar to recent warming rates. That makes those 100x warming rates you claim concern for well within natural variation – or throw out IPCC and all supporting research claims and start over. Your choice.
The recent warming started 50 years prior to the big ramp up in CO2.
While CO2 has been rising steadily over the last 70 years, temperatures have been going up, down and sidewise. The claim that only CO2 can explain this warming just doesn’t pass the laugh test.
Mr. Walton
There has been a lot of warming in the past 20,000 years including mild harmless intermittent warming in the past 325 years.
That warming since the 1690s was at least +2 degrees C’.
Most of that warming can not be blamed on man made CO2.
It is only an assumption that warming since 1975 was caused only by man made CO2 — not a fact as you seem to believe.
With brainwashed climate alarmists like you, we are asked to believe 4.5 billion years of natural climate change mysteriously ended in 1975 and suddenly man made CO2 became the climate control knob.
Gullible people like you may believe that but intelligent people ask for an explanation of how and why that would have happened.
We get no explanation and are character attacked as science deniers by the same people who make always wrong scary climate predictions using computer games that predict whatever the
owners/programmers want predicted.
Our current climate is wonderful and has been improving for over 300 years.
The climate may have been better — slightly warmer — during the Holocene Optimum.
Much of the modern warming is from repeated adjustments and wild guess data infilling of the surface temperature record.
And who says warmer winter nights in Alaska are bad news — the climate alarmists hide the pleasant details of climate change by using a global average temperature that not one person lives in.
Here in Michigan USA, we have had little warming … and we want more warming.
Warming is good.
COOLING IS BAD.
Those are the only two trends on our planet.
The paper is full of shit. The Minoan, Roman and Medieval periods were warmer than now (based on where and when they could grow various crops, even though we have better tech) and were followed by plunging temps of the Late Bronze Age Collapse, the post Empire Dark Age, and the Little Ice Age with it’s blood bath of famines, plagues and revolutions. The drops in temps were anything but slow and gentle.
+1000 PCMan999
PC You beat me to it, of course they are all hidden in th low temporal resolution smoothing with the modern high temporal resolution record creating the uptick.
A more honest approach would be to use the same smoothing across the whole time scale but of course that would produce a very ordinary looking graph.
Exactly! And this is just one of the multiple dishonesties that the likes of Loydo, Izaak, Mosher and the paper authors attempt to exploit for alarmist propaganda purposes. Half truths, fraudulently merged, to create a useful lie.
“…. developed some of the statistical approaches to synthesizing data from around the world…..” pretty much tells the story.
One needs to remember that Daniel Fahrenheit invented the thermometer in 1714, they weren’t accurate for the first 100 years because of quality control issues. So “data” before 1850 is “made up” from lake bed pollen and tree rings and bug castings, which simply aren’t accurate within 2 degrees C for a summer average. But apply the statistical square root of N samples, and these bad statisticians decide they know the temperature within a tenth of a degree. So their graph is the result of a compilation of “confirmation bias” rather than actual technical data, along with their desire to be eligible for more research funding.
They have found tree trunks frozen into the tundra hundreds of miles north of the current tree line, that data back to the Holocene Optimum. Anyone who believes that less than 1C of warming can explain that is drunk on warmista kool-aide.
The proxies all diverge from thermometer readings in the last 50 years or so. This is obviously due to global warming. (/s) ….makes one wonder how the proxy baselines were developed….
Roman/ Minoan Optimum were not warmer than today in the European Alps according tree data from Austrian Alps (Nicolussi & Patzelt).
https://core.ac.uk/download/pdf/148217593.pdf
Then why the [blank] did the romans have trade routes through passes that are blocked by glaciers today?
I’m a little too lazy to go through that PDF.
Were the trees that were analyzed previously under the glacial ice?
@ Richard: Which pass is Blocked by ice today and was used during Roman times?
“In contrast human activities are responsible for warming at a rate of about 1.5 degrees per hundred years”
There is absolutely no evidence that is the case, except in growing urban areas.
Urban areas are not “global”
Adjustments are not real temperature rise, yet they are by far the largest human thumbprint.
adjustments COOL the record
the trend in GLOBAL RAW ( SST + SAT)
is
GREATER THAN
the trend in GLOBAL ADJUSTED (SST+SAT)
The Ocean raw records (70% of the total) are adjusted to be cooler
The SAT (land records) (30% of the total) have minor adjustments that make them warmer
IN SOME AREAS ( mostly the USA)
the COMBINED SST+SAT record is COOLED BY ADJUSTMENTS
So you admit to cooling the past and warming the present. Thank you!
foot in mouth, yet again, hey mosh.. So funny
Yes we know that adjustments cool the past, to fabricate a warming trend.
If you are speaking of temperature records over the past 150 years, see climate4you. HADCRUT warms nearly all years. It clearly does not cool. GISS cools near everything prior to about 1950 and warms near everything after that.
Steven Mosher
Could it be possible to shout your answer? I can´t hear you.
As usual, Steve only tells half the story, the half that supports his fantasies.
Yes, most adjustments do cool the record. However they cool the past, in order to claim a bigger rate of increase.
Just leaving the temperature records at whatever the weather station operator recorded in the logbook that day would be fine with me. Eliminates the possibility of double dipping for Time-of-day or UHI adjustments by people who lie with statistics.
“GISS cools near everything prior to about 1950 and warms near everything after that.”
NASA needs to fire GISS and abandon Columbia U. And prohibit GISS from pasting NASA logos on it’s “data” and graphs. They have been horrible at cooling the 1940’s heat wave and warming the 1970’s cold wave… all to pretend a 1°C uptrend since ~1979… while UAH is only half of that. https://www.nsstc.uah.edu/climate/
Then “BEST” from Berkeley U should be disbanded (sorry Mosher) to complete the elimination of fake news liberal college climate outlets.
They glue global average temperature trend to local proxy data. Can’t compare the two.
They can’t even glue recent local temperatures to local proxy data – that would give the whole game away.
Don’t worry, Isaak, it’s all false narrative.
No the global record is not glued to the local proxy data.
the proxy data is
LOCALLY CALIBRATED AND LOCALLY VERIFIED
Oh really? Provide evidence or admit you lied.
regional expectations of warming , and all that
You expect it to be warming
so by crikey, you make sure the record shows it.
Really? To what standard temperature reference was proxy data calibrated and verified to 12,000 to 200 years ago? What was the measurement uncertainty of the calibration reference? Please produce the signed and dated calibration certificates.
Mr. Mosher: Really? What does the proxy data tell us about the temp last week? Take your pick, the mouse house or glacier ice, marine sediment, pollen, any one of ’em, please do share the data on the temp readings from mouse houses for the last hundred years.
It’s comments like these that diminish respect for your comments.
That depends on the accuracy of the climate modelling back to 1850. Of course the big unknown is the temperature “data” for the Southern Hemisphere. Phil Jones, CRU, 2009 – “The issue Ray alludes to is that in addition to the issue of many more drifters providing measurements over the last 5-10 years, the measurements are coming in from places where
we didn’t have much ship data in the past. For much of the SH between 40 and 60S the normals are mostly made up as there is very little ship data there.”
So little data so many promises.
Phil Jones also said the Eartly Twentieth Century warming (from 1910 to 1940) was equal in magnitude to the warming from 1980 to the present.
Does this graph show a rate of 0.1 C degrees per thousand years? …
Hundreds of other papers show that the cooling was much more than that.
More closer to 2C per millenium.
Hundreds of other papers requesting funding for further research to refine their accuracy within 2C show that the cooling was….
Just clarifying it for us all, Mark…
Except it isn’t. The amount of warming that CO2 can do is limited to its doubling from 300-600 and it is somewhere between 0.75 and 1.5 C. From there the next doubling is 1200. I doubt we will even get to 600 but if we get a degree warming it will be beneficial.
Some other reading if you are interested:
http://www.drroyspencer.com/2020/06/cmip6-climate-models-producing-50-more-surface-warming-than-observations-since-1979/
About 15 years ago i had a friend who was German he and his wife were going to move to Germany because they were convinced tha the only habitable place was to be north of 50N. he said that southern Oregon was getting the climate of Malibu. I said:”that is a BAD thing?”
They returned a couple of years ago due to the refugee center that was two blocks from their house-in Stuttgart. they couldn’t have beer on the porch.
So if anthropogenic emissions didn’t result in sufficient CO2 levels until after 1950 to cause measurable AGW, what about the half degree rise from 1850 to 1950? Turtles?
What about the cooling 1950 to 1980 while CO2 rose?
That was natural. You have to take that out to really see the effect of CO2.
/s
Is the ocean system one of the best thermometer/calorimeter devices we know of?
How well to open levels correlate with this study?
Geoff S
looks like they used SST proxies
That’s just another way of saying they made it up. what serves as a proxy for sea surface temperatures from 6500 years ago?
Geoff, the authors admit that the sea level was 20 feet higher than today before the plunge into the last glacial cycle of the Ice Age we currently live in. They destroyed their theme with this comment.
Ron,
Yes, that was my point.
All proxy work has to match up with the ocean level thermometer, with explanations, or we have an unexplained mystery.
Since the hockey stick days I have pointed out that most proxy responses are calibrated against recent instrumental thermometry. To the extent that temperatures are adjusted, so will be the proxy reconstructions. Geoff S
Only climate lunatics suffering from ‘computer madness’ will pretend that the averages of proxy data are the same as real time data and, that CO2 at 3.4 km altitude in the tropics is the same as CO2 in polar ice cores.
What is “real time” data and how would you get it from 5000 years ago?
Is that a trick question?
What is a global average and how would you determine that figure from 1880? That’s right, you’d make it up!
Loydo, you either ignorantly or deceptively imply that he said something that he did not say.
Proxy data cannot capture even moderately rapid fluctuations. That is the point.
I love the pretzels these Climate Dowsers wrap themselves into:
”statistical approaches to synthesizing data from around the world, ”
“Synthesizing data” LOL, only in the climate religion.
Then apparently there were all those Fred Flintstone SUV gas guzzlers spewing CO2 and running down mastadons around 125 Kya when Sea Level was 25feet higher than today.
Joel, That jumped out at me also.
Translated “we invented algorithms that confirm our biases”.
Meaningless Mathematical Masturbation (M^3)
Oxymoron: synthetic data
It should be patently obvious to all that have looked at the temperature graphs for the last 6,000 years that the successive peaks have been lower. The Minoan warm period warmer than the Roman, which was warmer than the Medieval , which was warmer than the current “catastrophic” warm period. Thus, the overall trend over the last 6,000 years has been getting cooler. The entire notion that it is the warmest ever is simply false-pseudoscience.
It is not the first or last time that pseudoscience has sparked mass hysteria and poor societal decisions. We must not become arrogantly deluded that because we have seen past stupidity- insane superstition, fearmongering , propaganda and witch hunting that we are immune. To the contrary, the arrogant attitude that we are immune to propaganda makes us more vulnerable to propaganda.
“Thus, the overall trend over the last 6,000 years has been getting cooler. The entire notion that it is the warmest ever is simply false-pseudoscience.”
Are you choosing to just disbelieve what you see on the graph or do you have an evidenced-based reason to refute the result that suggests it is warmer now?
It’s not warmer, now. Loydo. That’s reality, no matter how much you deny it.
“It’s not warmer, now”
I’m going by the graph above, what are you going by?
models.. not reality
One day you will figure out that there is a difference.
The oceans are down six feet. At the current rate of rise it will take almost 1000 years to return to that level.
Loydo I have only one question to you. I have asked answer to that question from many like you over these years.
I live in Finland. Our northest part is Lapland. There is whole Medieval oaks in Laplands swamps.
Oak lives now in the most southest area of Finland, some 1200 kilometers from Lapland.
Now, the very easy and simple question to you Loydo:
How those oaks get to those swamps? And, if you can answer to that simple question, here is another very simple question: Why they do not live there now, when it´s warmer?
Are you, Loydo, the first person ever to give me the answer to this very simple question? I would love to change your rank on my climate idiots list.
Let’s try the tree trunks frozen in the tundra, hundreds of miles north of the current tree line.
Is that sufficient to prove that the Holocene was much warmer than it is today?
No Loydo, we are choosing to believe the hundreds of other studies that disagree with this study.
Why is it that warmistas insist that it’s only science when it agrees with their myths?
Plenty of evidence-based reasons to affirm that we are not living through the warmest period in the Holocene.
Biology is the best indicator. Trees cannot grow above the tree line in mountains, and this is due to temperature not precipitation. Dozens of studies show that present tree-line is well below the Climatic Optimum all over the world. In most cases by hundreds of meters. An example among many:
Holocene treeline changes on the south slope of the Pyrenees: a pedoanthracological analysis
“The spatial precision provided by this proxy allows us to show that the maximum exten- sion of the upper forest line was 400 m above the current line.”
And then we have the glaciers to confirm what trees tell us. There are many dozens of studies showing that glaciers were at their smallest about 6000 years ago.
Solomina et al. 2015 Holocene glacier fluctuations
“the retreating glaciers in most parts of the Northern Hemisphere are still larger today than they were in the early and/or mid-Holocene.”
Whoever says we are warmer now than during the Holocene Climatic Optimum is either lying, or fooling himself from improper evidence.
Your first link didn’t work.
From Solamina et al.2015
“These data show that the temperature in these regions was generally warmer than in the pre-industrial period by 1.1 to >4 C.”
So according to that study its about the same or even slightly cooler than today, but you want to jump in with “lying, or fooling himself”? Historic tree-lines and glacier lengths reacting and moving in response to “orbital forcings” can not be compared with the abrupt forcing of modern warming – comparing a three thousand year long plateau with a 100 year spike caused by a pulse of CO2. CO2 goes in quick but takes a long time to come out so here’s the thing, there is a massive warming momentum now baked in which will see these phenomena accelerate and continue for centuries. In a thousand years time many of these glaciers will be long gone and tree-lines will have marched up the hills.
So back to the question is it warmer now? I would say it probably is, but if it isn’t with the rate of warming we have observed it will be in a decade or two.
Try this link and hit the link to the paper once there. It appears in Academia copied links don’t work.
https://scholar.google.com/scholar?hl=en&as_sdt=0%2C5&q=Holocene+treeline+changes+on+the+south+slope+of+the+Pyrenees%3A+a+pedoanthracological+analysis&btnG=
We were not discussing the speed of warming. We were discussing if we are warmer than the HCO or not. Trees and glaciers say no and you don’t need a model or proxies that need interpretation to know what they are saying.
The warming momentum is another hypothesis based on assumptions that may or may not be true. Personally I don’t believe it. The biosphere soaks up CO2 a lot faster than anticipated and CO2 probably has a smaller role in warming than most believe. The combination might mean warming momentum is another myth.
In a decade or two it is impossible that the trees will climb hundreds of meters and glaciers will melt what is required. I remind you that Jakobshavn Isbræ is growing at present. On top of that the warming rate has been decreasing, not increasing.
https://wattsupwiththat.com/2019/02/06/the-planet-is-no-longer-warming/
Rising ocean heat content shows no such decrease, if anything the rate is increasing.
https://www.nodc.noaa.gov/OC5/3M_HEAT_CONTENT/
I think you’re mistaking a couple of years of noise for a trend.
Jakobshavn? C’mon, glaciers are losing a metre of thickness pa. and accelerating – they’re falling of a cliff.

At that rate plenty more glaciers are gone in a decade or two.
I already demonstrated that the 9-year rate of warming, according to HadCrut 4 had a maximum in 2000 and it has been lower since.
https://wattsupwiththat.com/2018/08/29/what-is-warming-the-earth/
The last 4 years Jan 2016-Jan 2020 have seen a sea level rise of only 9 mm. Well below the average of 3.3 mm/yr.
https://sealevel.nasa.gov/
You’re measuring the dog’s wagging tail not the dog. One El Nino and your trend evaporates.
“major new compilation of previously published paleoclimate data, combined with new statistical analyses, … ”
When, exactly, did statistics replace physics?
Where is the physical theory that converts glacial ice-core metrics into Celsius?
Where is the physical theory that converts speleothem metrics into Celsius?
Where is the physical theory that converts pollen metrics into Celsius?
Where is the physical theory that converts packrat midden metrics into Celsius?
Where is the physical theory that converts coral metrics into Celsius?
Where is the physical theory that converts insect for-gods’-sakes larvae subfossil metrics into Celsius?
Such physical theories are nowhere to be found. No. Where.
The head-post graphic with its Celsius ordinate is a complete piece of pseudo-scientific garbage, just like the rest of the so-called field of so-called paleo-temperature reconstructions.
Honestly, I don’t think it’s actual frau*d, we’re seeing. More like they’re really that incompetent.
More like, “it brings home a paycheck so they’ll keep doing it.” At least until actual science calls BS on their paleo-divinations. But that first necessitate the unf-&#ing of the national academies by political actors masquerading as their science leaders.
Really Pat,
Are you claiming it is impossible to know anything about the past? Do you have a physical theory
that converts the direction of magnetic fields on pieces of tape to Celsius?
Reconstructions are not perfect but they are better than nothing and other than giving up and saying
we don’t know anything abou the past there is no other option. And they can be calibrated using careful
experiments.
Chicken bones tossed on the voodoo priestess’s table are not perfect either. Yet those chicken bones have about as much physical theory in divining the past temps as some of these methods to get a 1,000 year old temperature in < 1 deg C.
Actually I think the Voodoo chicken bone proxy for paleo temp reconstructions needs some serious grant money to understand this promising avenue of paleo climate dowsing.
We need to decolonise physics.
Voodoo chicken bone analysis is just the first of many indigenous truth-finding modalities that need to be reinstated if we as a society are to restore social justice to the physical sciences.
LOL!
Well Pat has a point. All those reconstructions can’t be directly converted into a temp gauge, just like the relative ratios of C14 and C12 can’t be directly converted to a date. I would trust ancient accounts of crop info more, like the Romans were growing grapes farther north and at greater elevations than today, or that Ming era Chinese were growing crops further north than we can today inspite of our greater tech, than O2 isotope ratios
There is a physical theory of steady radioactive decay for a C14 measurement. Alcoholic beverages must have natural levels of C14 as well indicating the EtOH came from biological fermentation rather than petroleum refining.
C13 to C12 ratio can indicate a biological process rather than a geochemical process, but not sure how a date come from that.
Rubbish; climate reconstructions are just hypotheses, and they can’t be calibrated via small scale experiments.
Isaak,
Look at the ice cores, for example. The deepest ice goes less than a million years old. That means there was no ice prior to a million years ago! What’s the explanation for that? Or …
What if ice melted and then re-iced? We’d have no history of that.
Both possibilities render the results useless.
You descend into stupidity, Izaak, when your position fixée requires you to misconstrue posts and even bastardize science itself.
You’re an intelligent guy. It’s a bit painful to watch you repeatedly betray your intellect.
No physical theory, no conversion equation.
Show me a published calibration experiment that establishes a permanent quantitative relationship between air temperature in Celsius and any one of those metrics.
Izaak,
An honest person must admit what they don’t know, as well as what they know. And even then, it is important to know how accurate/reliable the things you “know” are. For example, if I have a ruler that is only accurate to 1/8″, I can’t really know the length of something to any greater accuracy than that. I can estimate down to 1/16″ or even 1/32″ if I squint, but that’s still just a guess. That does not mean it is impossible to make more accurate length measurement than that; certainly devices exist that can, however just not with that ruler. If I needed accuracy beyond 1/8″, then that ruler is simply not fit for the task. Even if I don’t have anything better than that ruler, I can’t just say “that’s the best ruler I have, you will have to accept my estimate (guess)”. Being honest, I have to say “I can’t tell you what you want to know until I get a more accurate ruler.” There’s no shame in admitting that the quality of the data you have is not fit for the purpose it has been requested for, but lying and saying it is may be an unforgivable sin in the pursuit of knowledge.
Or both
Pat..,
.the study was written by the 99% of “”6scientist,””
therein lays the problem ntb. 🙂
What happened to the Roman and Medieval Warm Periods?
Presents of Roman and Medieval Warm Periods depends on the purpose of the study.
You do not receive $678,000 for including previous warm periods.
No. You have to “get rid of them” to receive grants.
They were weak, localised and occurred at different times in different regions, so on globally averaged graphs the more proxies you include, the more their effects are smoothed out. In other words they’ve been exaggerated.
They were weak, localised and occurred at different times in different regions
No, they weren’t.
Lloydo says: “”so on globally averaged graphs the more proxies you include, the more their effects are smoothed out. In other words they’ve been exaggerated.”
It’s projection what done it. Lloyd sees BEST take proxies (Mosherites calls it “adjusted data”) smoothed to exaggerate modern warming, and projects it onto those who say it was warmer back then. Javier debunked his nonsense above, but Lloyd has his story, he’s stickin’ with it, not shaken or stirred by facts.
Have you seen the graphs David Middleton posted below? Did you read his response to the Ed’s query about the “dark ages”? The warm periods (and LIA) show up clearly on regional measures but are barely discernible when global averages are plotted.
Wow, talk about climate denial! 6000 to 7000 years ago there were old growth forests at high altitudes, well above the current tree line. One does not have to use statistical approaches to synthesizing data to know this, one only has to look at the remnants of the trees (that have been carbon dated to that time) some still rooted in the soil, that are emerging from melting glaciers.
There are quite a few sites with standing dead trees, carbon dated to 1000 and 2000 years ago, up to 500 feet above the current tree line. Also tree and other plant remains further north than that species can grow today. Many studies on these have been published.
Just one question.
Has the reported temperature increase taken us closer to, or further away from the ideal temperature the climate alarmists have identified for life on Earth?
A supplementary question. What is their ideal Earth temperature?
Rod
I have yet to find an alarmist who will offer an ideal Earth temperature, and defend it. An unsupported assumption is that the Earth was at an ideal temp just prior to the Industrial Revolution.
This is absurd. Even Keith Briffa believed low resolution proxies didn’t rule out century scale temperature excursions of the same magnitude as today.
Here’s an interesting gem from the cited research paper’s Introduction:
“This cooling trend occurred while the atmospheric concentrations of greenhouse gases were increasing. Liu et al. (ref. 3) coined the term “Holocene temperature conundrum” to highlight the contradiction between the cooling indicated by proxy evidence versus the warming simulated by global climate models, a trend reinforced in the most recent generation of climate models.”
Nothing in the rest of the paper addresses WHY increasing greenhouse gases might cause cooling. Maybe someone might look into this?
Unless you’re using degrees F, we have not yet reached the 1.5 degree mark you cite. This study’s temporal resolution is poor, and it can easily miss earlier, short term phenomena, It almost certainly wouldn’t have captured current warming, unless the unwarranted assumption that the rest of the century will be universally warmer, with no interruptions due to ocean currents or solar.minima, but time will tell. For now, this is just a data point, from a “sustainability” organization, which just calls its objectivity into question. Another Mann is born…
“accelerating greenhouse gas emissions have contributed to global average temperatures that are now surpassing 1°C above the mid-19th century.”
…. and then people say….
“The science is clear: It is understood that we are facing an unprecedented global emergency. We are in a life or death situation of our own making. We must act now.” – Extinction Rebellion
I’m guessing that they have tacked thermometer readings onto the tail of the proxy data. That’s how Dr. Mann got his hockey stick.
Mann had to “hide the decline”. link That means there are some proxies that show modern cooling. I don’t see any evidence of that on the above graphic.
Anyone who creates a graphic that looks so much like Mann’s hockey stick has a lot of nerve or maybe is clueless. I wonder what M&M will make of this.
MSM will do what it always does:
The more “scientists” that co-sign the theory of gluing global AIR temperature trend to an amalgamation of local in-the-dirt proxies … the more legitimacy it has.
Certainly such a thing is not evidence of collusion … but corroboration. lol
M&M is Steve McIntyre and Ross McKitrick who debunked Mann’s hockey stick.
“Izaak Walton June 30, 2020 at 11:06 pm
Stephen,
The paper suggests the nature rate of cooling is/was 0.1 degrees per thousand years. In contrast
human activities are responsible for warming at a rate of about 1.5 degrees per hundred years. That
is a massive difference and an increase of over 100.”
================================================================================
So NONE of the warming can be attributed to the long thaw out of the LIA?
OK. If you say so. Normally, one would expect the planet to WARM on leaving an Ice Age, but hey – what do I know?
Good. A new ice will really make a mess of the planet!
And we cannot stop a new glaciation. A bit of warming seems a good idea and a lot of extra CO2 will feed the world.
This is from Kaufman, McKay, Routson and Erb combining a highly smoothed 12,000 year reconstruction (400 year resolution) with a much higher resolution reconstruction for the past 2,000 years (Pages2k) ending in 2000 AD:
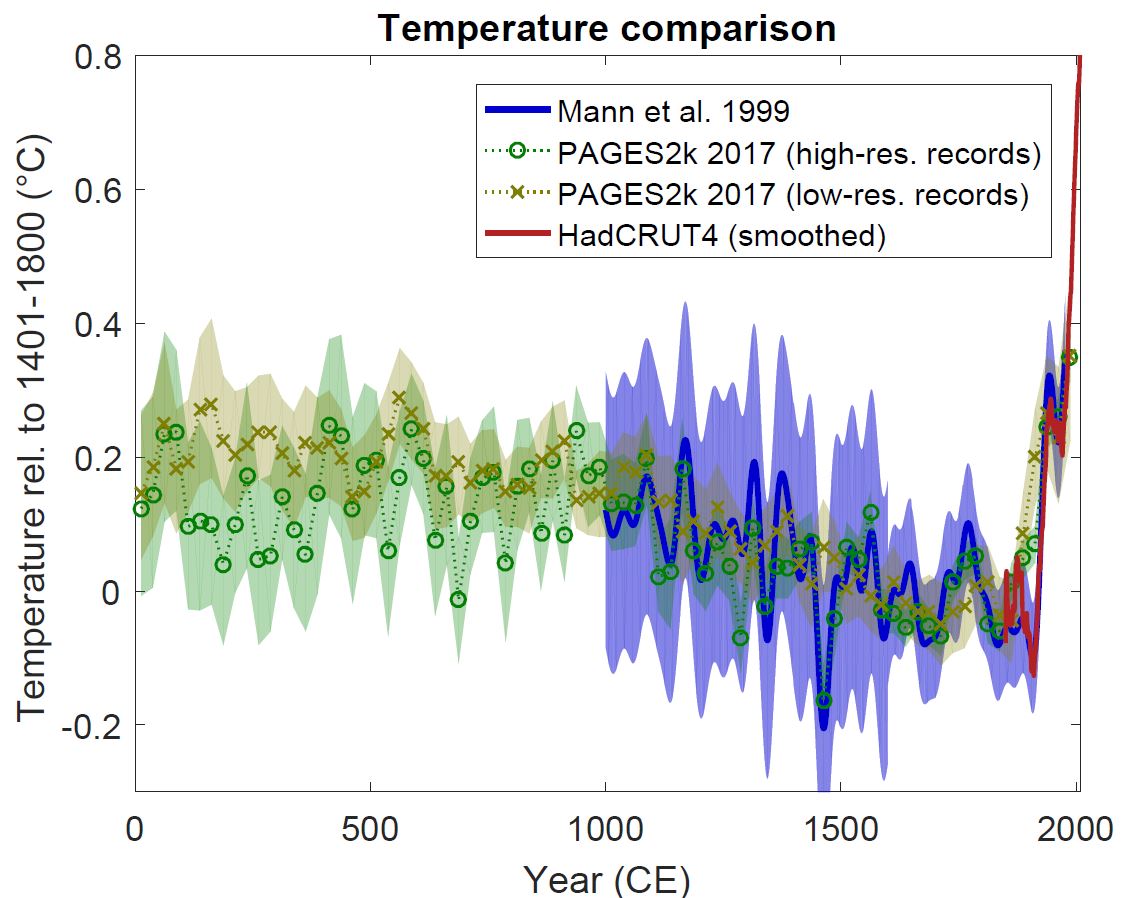
https://www.nature.com/articles/s41597-020-0445-3/figures/8
Human CO2 emissions were insignificant before 1945 therefore the lower part of the end spike cannot be due to human emissions.
And extending smoothed graphs beyond formal end points implies knowledge of future trends.
The records used were screened proxies: “only those proxy records that have a demonstrated relation with temperature were included” i.e. selected on the dependent variable so an end up-tick is almost assured.
The illustration above has a note: ‘Present Warming’, GISTEMP has the current GAT linear trend almost 0.5C above 2000; I would like to see future paleo-studies of this kind kept up-to-date, for instance with the end up-tick bursting out the top of the page.
I was going to make a comment on the change of resolution throughout the graph but you beat me to it. Let’s put some error bars on this graph and see where we stand today…
They certainly spend a lot of money on nice pictures… look at the cute mouse, not the graph… That should convince us. NOT!
This study actually contradicts Marcott et al., 2013…
Here are the last 3,000 years enlarged:
This study (Kaufman et al., 2020, dark green curve) clearly lacks the fraudulent “Anthropocene” hockey stick blade of Marcott et al, 2013 (light blue curve).
What happened to the dark ages when the temperature dropped so that the central asian steppe lost its grass forcing the Huns to migrate to the west? I don’t see that well-documented dip in the graph.
Well documented by what? This is a global reconstruction with a resolution of about 165 years. It’s not going to look like the GISP2 ice core (a single data point) or even a Northern Hemisphere reconstruction due to the hemispheric insolation differences in evolution of the Holocene. The Dark Ages cooling period preceded the Medieval Warm Period, the pronounced bump around 1200 years ago, Globally, most of the historical warm periods are reflected as pauses in cooling. The primary exceptions are the Medieval Warm Period and possibly the Modern Warm Period.
Marcott.
Snigger
“This study clearly lacks the fraudulent Anthropogene hockey stick blade of Marcott”
Looks like they smoothed out and lost the LIA.
They didn’t lose it… But they definitely reduced its depth. And, it’s still the coldest part of the Holocene.
The paper is available here: https://www.nature.com/articles/s41597-020-0530-7
The paper itself lacks any alarmist rhetoric… Or even the slightest justification for alarmist rhetoric in press releases, like You Reek Alert. If anything, it demonstrates the resolution issues with proxy data and the futility of trying to merge them with instrumental data over epoch-scale reconstructions.
It also demonstrates that the various methods of composing multi-proxy reconstructions yield wildly variable results.
It’s good science. It just doesn’t really support the narrative.
The temperature numbers on the ordinates are pseudo-science, David.
They’re statistical constructs with no known physical meaning.
They are statistical constructs. However, most of them have “known physical meaning,” within the limitations of non-uniqueness. Most are qualitative. Some are quantitative under the right conditions.
None of them mean Celsius, David.
None of them quantitatively mean temperature under any known circumstance or methodology.
Warmer/wetter, cooler/drier is all that can be extracted from them. And that, only with acknowledged ambiguity.
If you know different, I’d be happy to see the citation to method.
http://www.iceandclimate.nbi.ku.dk/research/past_atmos/past_temperature_moisture/fractionation_and_temperature/
https://www.seas.harvard.edu/climate/eli/research/equable/isotope.html
Basically, as long as salinity, ice volume and burial effects can be quantified and controlled for, δ18O can be directly converted to ΔT. For Quaternary ice cores, the conversion is trivial. For sediment cores, the conversion is less straight forward and more error prone.
I have an analytical post here on WUWT about proxy temperature projections, David, that focuses on dO-18.
Unfortunately, none of the embedded graphics have survived WUWT’s transitions. But you can download a pdf of the original here, if you like. The internal links may not work, but you’ll have the figures.
In any case, saying that conversion is possible if salinity, ice volume and burial effects can be quantified… is like saying that DO-18 in ice cores can be used to calculate temperature so long as ancient monsoon paths, their variable rain-out patterns, glacial water migration vectors, and firn closure times are all known.
Of course if one knows all the variables, dO-18 can be used to calculate temperature. But the point is that even granting dO-18 theory, all the variables cannot be known of ancient oceans, ancient glaciers, and ancient climates.
My post goes into detail about how difficult it is to get accurate temperatures from dO-18 data, even using calibration samples from modern waters.
When I debated the issue at WUWT, my opponents also chose to defend only dO-18 proxies. They mentioned not one word about tree rings or any of the other proxies.
Your graphics are multi-proxy results. They’re not dO-18 alone. Their reconstructions are dominated by chironomids [i.e., insects – P] and pollen (land), and diatoms and foraminifera (ocean). See for yourself: Excel file of proxies.
None of the ancient dO-18 proxies can be converted into temperature by way of the physical theory of heavy isotopes, and there is no physical theory at all to convert chironomids and pollen.
The authors themselves implicitly admit this: “Multiple statistical procedures have been developed to generate time series of paleoclimate variables over large regions and to quantify their uncertainties. Because each one is based on different assumptions and procedures, they can result in different reconstructions (e.g., refs. 1,6). Here, we apply five different statistical methods to the Temperature 12k database to reconstruct global and latitudinal temperatures over the past 12,000 years.” (my bold)
Not one word about physical theory. And statistics is no substitute for physics.
And even in the very recent Quaternary, when variables are known and temperatures can be estimated, error analysis shows temperatures no better than ±1 C or so.
Those multi-proxy constructions may be wonderful statistics, but they’re not good science.
Indeed Pat Frank,
Quite a few major events happened in the last million years or so, many that have affected the climate back then. Most probably there are many others not quite so dramatic (but climate affecting) yet to be discovered.
[From https://www.scientificpsychic.com/etc/timeline/timeline.html%5D
— 1.3 mya: Yellowstone supervolcanic eruption
–1.3 mya to 820,000 yrs ago: Sherwin Glaciation
–Presence of large land mammals and birds
–790,000 yrs ago: First use of fire by hominds[40]
–700,000 yrs ago: Human and Neanderthal lineages start to diverge genetically.
–680,000 to 620,000 yrs ago: Günz/Nebraskan glacial period
–640,000 yrs ago: Yellowstone supervolcanic eruption
–530,000 yrs ago: Development of speech in Homo Heidelbergensis[15]
–455,000 to 300,000 yrs ago: Mindel/Kansan glacial period
–400,000 yrs ago: Hominids hunt with wooden spears and use stone cutting tools.
–370,000 yrs ago: Human ancestors and Neanderthals are fully separate populations.
Fire was used by hominids for at least one hundred thousand years before modern humans appeared.
–300,000 yrs ago: Hominids routinely use controlled fires
–230,000 yrs ago: Neanderthal man spreads through Europe
–200,000 to 130,000 yrs ago: Riss/Illinoian glacial period
–160,000 yrs ago: Homo sapiens appeared.
Origin of human female lineage.[3]
–125,000 yrs ago: Eemian stage or Riss/Würm interglacial period.
Hardwood forests grew above the Arctic Circle.
Melting ice sheets increased sea level by 6 meters (20 feet)
–110,000 yrs ago: Start of Würm/Wisconsin glacial period
–105,000 yrs ago: Stone age humans forage for grass seeds such as sorghum.
–80,000 yrs ago: Non-African humans interbreed with Neanderthals[28]
–74,000 yrs ago: Toba volcanic eruption releases large volume of sulfur dioxide
–71,000 yrs ago: Invention of the bow and arrow.[41]
–70,000 yrs ago: Tahoe glacial maximum glaciers cover Canada and northern US.
–55,000 yrs ago: Humans colonize Australia
–46,000 yrs ago: Australia becomes arid, bush fires destroy habitat, and megafauna die off.
Cro-Magnon is one of the main types of Homo sapiens of the European Upper Paleolithic.
–40,000 yrs ago: Cro-Magnon man appeared in Europe.
–28,000 yrs ago: Neanderthals disappear from fossil record.[29]
–26,500 yrs ago: Taupo supervolcanic eruption in New Zealand.
–22,000 yrs ago: Tioga glacial maximum sea level was 130 meters lower than today.
–20,000 yrs ago: Invention of fired ceramic pottery.
–19,000 yrs ago: Antarctic sea ice starts melting.[22]
–15,000 yrs ago: Bering land bridge between Alaska and Siberia allows human migration to America.
Clovis point
–12,900 yrs ago: * Comet impact by Great Lakes [23, 24, 25]
*Extinction of American megafauna such as the mammoth and sabretooth cat (Smilodon), as well as the end of Clovis culture
–12,000 yrs ago: Construction of Göbekli Tepe in Turkey.
–11,400 yrs ago: End of Würm/Wisconsin glacial period.
Sea level rises by 91 meters (300 ft)
Holocene Epoch (11,400 years ago to today)
–Development of agriculture
–Domestication of animals.
–9,000 yrs ago: Metal smelting started
–5,500 yrs ago: Invention of the wheel
–5,300 yrs ago: The Bronze Age
–5,000 yrs ago: Development of writing
The Great Pyramid of Giza was built around 2560 B.C.
–4,500 yrs ago: Pyramids of Giza
–3,300 yrs ago: The Iron Age
–2,240 yrs ago: Archimedes develops formula for the volume of a sphere.
David,
I agree the authors compiled a lot of data and even excluded the controversial tree ring data. The publication is statistical analysis of the global database of Holocene records they published last month. Which by the way has Figures 5 & 6 captions and graphs flipped, a minor admin error that slipped by 50 authors. Statistical excercises are a convenient way of having computer generated solutions without contouring the data by hand to eliminate edge effects or remove bad data points aka bullseyes.
Where is the discussion of the processes responsible for the trends they observe? They identify 2 Holocene events, the Holocene warm peak at 6.5 kyrs and the subsequent cooling trend. Old news.
How about the Southern Hemisphere? Figure 2 shows significant differences between the Arctic and Antarctic temperature trends. The two polar hemispheres do not warm and cool together and underlying long term trends appear to be out of phase during the Holocene warm peak. The 60-90 deg S in Figure 2 shows a temperature minimum at 8000 years. No mention of that. Guess that’s not statistically significant.
It’s a good tech aid, oops technical reference paper.
What I found most interesting was the vast differences between the different methods of reconstruction.
I think it’s s useful contribution to the science (unlike Marcott et al., 2013). I’ve noticed that papers my Kaufman and McKay tend to lack anything to support alarmist rhetoric… Yet, they will often at least pay homage to alarm ism in their comments in press releases.
CLAIM: “Comprehensive compilation of pre-historic temperature records shows that global warming is reaching levels not seen for at least 6,000 years.” RESPONSE: So what? That the current warming is warmer than in the last 6,000 years of the Holocene does not prove human cause.
CLAIM: “The findings show that the millennial-scale global cooling began approximately 6,500 years ago when the long-term average global temperature topped out at around 0.7°C warmer than the mid-19th century. Since then, accelerating greenhouse gas emissions have contributed to global average temperatures that are now surpassing 1°C above the mid-19th century”: RESPONSE: The whole of the Holocene is punctuated with millennial scale warming and cooling cycles. If the authors know what causes these cycles they should explain all of them and not pick one of them to explain with a pre-determined greenhouse effect theory. That kind of research is subject to confirmation bias and circular reasoning.
Please see
https://tambonthongchai.com/2019/06/11/chaoticholocene/
About the need for the word “unprecedented” in climate science.
https://tambonthongchai.com/2020/06/05/about-the-word-unprecedented/
As the warmists like to say: We can’t think of anything else, so it must be CO2.
Argument through ignorance
On the upside …they are now openly admitting it’s not just humans …..
“However, future climate will also be influenced by natural factors, and it will be complicated by the natural variability within the climate system”
This useless study only shows that anything or its opposite can be asserted using fraudulent data.
Chris Hanley
“Human Co2 emissions were … Before 1945″”
In London in 1948 I could not see 10 feet in front of me because of the smoke from house heating fires winter (and war) before the 1950 ‘s ?
Image source: Carbon Dioxide Information Analysis Center (CDIAC) United States Department of Energy.
How is it that the warming does not show up in the MEASURED temperature record hosted by NOAA?
http://theearthintime.com
The dataset in the above link is the only objective baseline we have. Other various reconstructions, such as that cited in this article, are actually MODELS, comprising gridding, homogenization, proxies of dubious precision.
And, as many comments have pointed out, resolution problems and fallacious grafting.
“The reconstruction of past global temperature is the outgrowth of several NAU research projects aimed at understanding the causes and effects of natural climate variability, work that was funded through more than $1.2 million in grants from the National Science Foundation. The team was recently awarded another $678,000 in grants from the NSF for related work extending through 2023.”
I hope they produce lots more pretty graphics, because that’s a lot of money for just one.
I note not one of the climate alarmists have answered my very simple earlier question.
Does the increase they see take us closer to or away from their ideal Earth temp?
Also would they tell us what their ideal Earth temperature is?
It is not a difficult question is it? After the $billions spent thus far on climate research surely one of the scientists can tell us what temperature are they hoping to maintain?
Just asking.
The graph clearly shows Mann-made warming.
Assume that this is true.
Is this a good thing or a bad thing?
Warmer is better.
Well it’s Mann-made, so mostly bad and deliberately so, to exaggerate the warming.
“Before global warming, there was global cooling,”
and before global cooling, there was global warming.
Why is the warming from 12000 years to 6500 years before 1950 not explained?
What was the reason for this warming?
It must have been the “Troglodyte greenhouse effect”. /sarc
Why is 1950 the launch mark? Anybody know?
I think it has to do with WWII. See you can’t claim that humans were the scourge of the Earth during world war periods–that’s just “not done”. So it has to be after the wars, because the war years are sacred. For that matter, what about Victorian times to pre-1950? Lots of factories, lots of emissions–just not a whole lot of cars.
So why 1950? I mean what is it before then that stops them? Television? Big cars? Massive factories producing every “modern” convenience? Is that it? Is that why 1950 is the stopping point? On Dec. 31, 1949 did all these massive factories and cars just suddenly start at the stroke of Jan 1, 1950 at 12:01 am or something?
I’m sure there is a mountain of temperature data during WWII, but for some reason, we never hear about it…imagine that. Furthermore, I’d argue that there is massive temperature data from WWI and before that as well.
Notice the left side of the graph. Time frame 1800-1900. That is not just cherry picking, it is a full cherry pie.
Thanks to the post war economic booms, 1950 is when CO2 levels started growing dramatically.
1950 is the year zero in the Before Present time scale because it was initially based on radiocarbon dating, and radiocarbon dating stopped being precise in the early 1950s due to atomic bomb atmospheric testing that introduced a huge deviation.
Most climate proxies do not reach the present because they are based on sedimentary processes that require a compaction produced by more sediments on top. An example are ice cores where the snow has to be compacted into ice by a process of firning.
There wasn’t enough stuff dumped into the atmosphere by atmospheric atomic bombs to affect radio carbon dating.
What messed up radio carbon dating was millions of tons of ancient carbon being dumped into the atmosphere as CO2 from burning massive amounts of nat gas, oil and coal. Between 1650 and 1950, radio carbon data became problematic. As long as your sample was from a place well away from where coal was being burned, you were probably OK.
I guess you don’t know what you are talking about and are giving just your opinion.
“The Beta-counting method detects the rate at which purified carbon decays. As W.F. Libby determined, one gram of pure carbon should produce about 14 (13.56) radioactive decays per minute.
14C => 14N + β
A rate of 7 decays/gram/minute would indicate an age of one half-life, or 5730 years old. 3.5 decays/gram/minute of carbon would be produced by a sample 11,460 years old.
However, atmospheric testing of nuclear weapons in the late 1950’s and early 1960’s greatly increased the amount of radiocarbon in the atmosphere, so the decay rate of 14 decays per minute more than doubled. Therefore, radiocarbon dates are calculated to a “pre-bomb” age of 1950 A.D. Material which died after 1950 has such high amounts of radiocarbon its age is reported as “percent modern (1950)” (example 180% modern). This bomb radiocarbon has been gradually removed from the atmosphere by by natural processes, but the “bomb spike” can be shown through the dating by means such as comparing the bottle date and radiocarbon age of wines.”
https://www.geo.arizona.edu/Antevs/ecol438/radiocarbon.html
Given the half life of CO2 in the atmosphere is only 5 to 10 years, there isn’t much left from the atom bomb tests.
So the dumping of millions of tons of ancient CO2 into the atmosphere had less impact than a couple of a-bombs?
It had a different impact. You have to consider that 14C amount is very, very small compared to 12C. Atomic tests increased 14C (the numerator) and thus had a huge impact on that ratio.
Fossil CO2 is a small part of total atmospheric CO2 that also fluxes into oceans and the biosphere. To affect the 14C/12C ratio, fossil carbon is affecting the denominator that is very large, so its impact on the ratio is much smaller.
Atomic tests had an acute large effect and since they stopped, they produced a spike that is permanently registered on the remains of all living things at the time. If you produced your teeth in the late 50s to 70s, the spike is permanently registered in them.
Fossil fuel burning produced the Suess effect, a progressive reduction in the 14C/12C atmospheric ratio. It is small (1-2%) but it could be detected already in 1979 and requires a small correction in recent samples. But it is estimated than in a few decades it might reverse the Δ14C difference between the atmosphere and other reservoirs, leading to a reversal of the radiocarbon clock.
Has nobody read the most important sentences in the end of the paper?
“Our reconstruction, which is based on much more proxy data and multiple statistical methods, reinforces the mismatch between higher-than-pre-industrial GMST as represented by the proxy data versus the lower-than-pre-industrial GMST as simulated by climate models.”
This implies that climate models up to now aren’t able to reconstruct the GMST of the holocene as they were reconstructed. However, they are able to simulate the future 🙂 .
The Holocene Temperature Conundrum is alive and well.
It can only be resolved by ditching models or ditching climate proxies, whatever.
Paleoclimatology has never supported well the dogma. Many paleoclimatologists are skeptical and entertain all kind of heretical notions, like it could be the Sun. But the orthodoxy is already hard at work. Through the PAGES Consortium and their inquisition tactics they are rewriting the distant past, and everything that disagrees will be disavowed. Careers are at stake and only retired professors dare to speak up, but they can be safely ignored on account of senility.
Ditch the idea that a global average matters.
Welcome back Javier!
I agree about PAGES, it’s criminal vandalism of palaeo climate data. Palaeo climate data are NOT safe in the hands of the current generation of activist place-holder “scientists”. Steve MacIntyre has exposed the pure fraud at work in the PAGES palaeo-ironing-board.
According to that chart, we are only a few tenths of a degree cooler than the height of the holocene optimum.
Boy, have they cooked the books.
Did Mann have a part in this study?
This contributes little to nothing to what we already knew about our interglacial and ECS of increased CO2. Holocene optimum was 8K years ago and we have been cooling ever since heading to the next glacial period, we already knew that. ECS at a maximum of 1.4C makes their estimate of 1C warming a non-discovery. If we have managed to push off the onset of the next glacial period for a few hundred years, I am all for it. I mean I like my Canadian cousins but having to put up with them for 50K years while their country is covered in ice is a bit much
From the article: “Over the past 150 years, global warming has more than undone the global cooling that occurred over the past six millennia, according to a major study published June 30 in Nature Research’s Scientific Data”
Wrong! Global warming has not even undone the warming that occurred during the Early Twentieth Century much less the last 6500 years.
Here are (below) unmodified (actual temperature readings) Tmax surface temperature charts from all over the world that show it was just as warm in the Early Twentieth Century as it is today. And it was even warmer in the Midieval Warm Period and the Roman Warm period.
These “climate scientists” are ignoring the data right in front of their eyes.
Tmax charts
US chart:
China chart:
India chart:
Norway chart:
Australia chart:
Is anyone really surprised that the “School of Earth and Sustainability” has come up with anything less than a complete CAGW Orthodoxy result?
Joel–“Climate Dowser”
Good one.
Belief in dowsing goes away back. In the 1550s it was used to discover water and silver.
Georges Bauer under the name of Agricola wrote “De Re Metallica” . Published in 1556 it was THE book on mining and metallurgy for at least 200 years.
Bauer debunked dowsing.
Now to this article.
Clearly, “they” have extended the handle of the Hockey Stick from 1,000 years to 6,000 years.
Not just an ordinary scam, but one exaggerated by orders of magnitude.
The actual consensus is that the Holocene thermal Optimum was 2 C+ warmer than now for 4,000 years. Revisionist history appears to be the dominate paradigm now.
The Little Ice Age peaked in the late 1600s and that’s when our current warming cycle started. It’s easy to verify but it’s off message because CO2 couldn’t have been the cause so 1850 is used instead.
Most climate sceptics I know don’t realise this.
What’s the reason for the blue squiggly line going from year 0 to 1950?
The sea level was 1-2 meters higher 6500 years ago.
Since it’s natural, who cares?
Paper finds solar activity at end of 20th century was at highest levels of past 9,000 years
I just can’t take any study seriously that claims a confidence interval of what looks like one degree C using solely smoothed proxies. I can’t see any way the actual confidence interval could be less than 2 degrees, and quite possibly 4 degrees.
The study served up its purpose.
$1.2 mil of public money then 50% to keep going as there is not enough alarmism any more
This is the same palaeoclimate stir-fry approach as used by Shakun and Marcott.
An easy recipe – mix in as many proxies as possible with no selection as to quality. Stir thoroughly until any past changes in temperature are ironed flat.
Result – recent warming looks exceptional, hockey stick delivered. The job’s a good-un.
Steve McIntyre had the method diagnosed probably 10 years ago.
Assemble a bunch so-called proxy time series that are indistinguishable from random noise.
Stir in a few more proxies one might find that just happen to have a recent uptick.
And, mirabile dictu, they combine to produce a flat handle and a hockey stick blade.
All the supposed conformations of Mann’s hockey stick employed that sure-fire method. As Steve McIntyre exhaustively documented.