Guest News Brief by Kip Hansen — 18 May 2020
 There has been a lot of talk in the press and from talking heads claiming that the Covid lockdown has “reduced emissions” (power plants cutting back on power generations, factories closed, populations ordered to stay home, most airplanes grounded) and talk encouraging that government Covid recovery packages, should support only companies and projects “which decouple economic growth from GHG emissions”. The “Build Back Better” movement.
It is true that emissions from human sources – automobiles, factories, power plants, etc. – have been reduced by the multitude of nations that have sacrificed their economies in the [misguided] belief that doing so “saves lives”.
But the idea that the Worldwide Covid Lockdown has had any effect on atmospheric CO2 concentrations is simply not true.
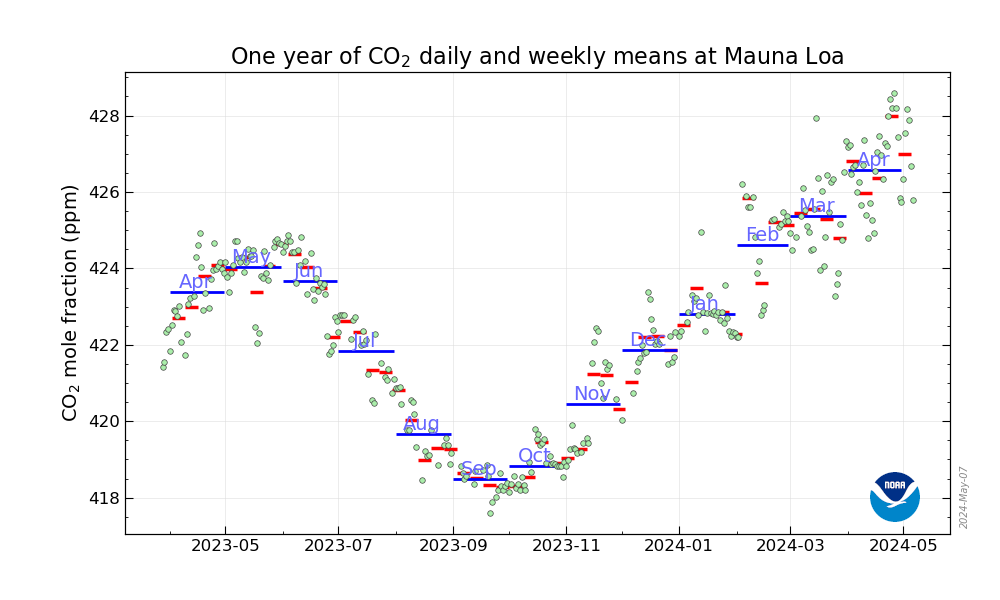
Here is the data, from the world’s most trusted monitor of atmospheric CO2:

Despite the dreams of the anti-human element of the Climate Cabal, which seems to have been hoping that the Covid Lockdown would destroy enough of to human society to allow the Radical Greens to dictate the “post-apocalypse recovery plan” — there has been no apocalypse (there has been an economic downturn…by definition, they turned down the economy), the lockdown hasn’t even made a dent, not even a tiny slowdown, in the growth atmospheric CO2 concentrations.
That is, this year, through May, looks precisely like each of the previous four years. You might be asking: “How can that be?” — factories closed, cars off the road, power plants just ticking over…..
[ If you don’t like this chart, try the Daily and Weekly Chart — it shows the same thing. ]

[ Above image added 0945 ET May 15 2020 — too many people complaining about resolution of the first graph — apparently too lazy to click the link provided. ]
Maybe, just maybe, anthropogenic emissions just don’t make that big of a contribution to the increase….Maybe abandoning fossil fuels and all the advantages of modern society isn’t a solution to rising CO2.
# # # # #
Author’s Comment:
And that’s the news for the day….
Don’t ask me to explain it, I don’t know. But it sure is interesting – even I thought the lockdowns would show up at Mauna Loa.
# # # # #
Looks like those thousands (maybe millions) of sub sea volcanoes and hydrothermal vents play a larger role than everyone thought.
After COVID-20 and 21, we’ll know for sure.
It looks you may be right.
According to http://www.telegrasph.co.uk ‘the trials investigating the immune response to the Oxford vaccine in rhesus macaque monkeys were carried out at the National Institute of Health’s Rocky Mountain Laboratory in the US …. did not stop the animals from catching the virus and has raised questions about the vaccine’s likely human efficacy and ongoing development.
The following graphic link shows how scientists are trying to produce a vaccine.
Our countries will be broke if we isolate from now to covid-20.
The Oxford vaccine tests on rhesus monkeys was disappointing. Too bad.
There is good news, however, concerning the company, Moderna, that Trump provided $500 million to speed up their effort to produce a new technology vaccine.
A vaccine specialist who is not involved in Moderna’s work said the company’s results are “great.”
“It shows that not only did the antibody bind to the virus, but it prevented the virus from infecting the cells,” said Dr. Paul Offit, a member of the NIH panel that’s setting a framework for vaccine studies in the US.
https://www.cnn.com/2020/05/18/health/coronavirus-vaccine-moderna-early-results/index.html
Problems for the Oxford vaccine. Too bad.
https://www.telegraph.co.uk/global-health/science-and-disease/doubts-oxford-vaccine-fails-stop-coronavirus-animal-trials/
These made me laugh
https://wattsupwiththat.com/2020/01/24/china-corona-virus-horror-video-hospital-corridor-of-dead-and-dying/#comment-2901835
https://wattsupwiththat.com/2020/01/24/china-corona-virus-horror-video-hospital-corridor-of-dead-and-dying/#comment-2901841
It is interesting to go back in time to see what experts at WUWT thought
https://wattsupwiththat.com/2020/01/24/china-corona-virus-horror-video-hospital-corridor-of-dead-and-dying/
Steven ==> Hogwash — WUWT is not responsible for the random comments of anonymous commenters — anymore than it is responsible for your often enigmatic sniping.
sure it is.
decisions are made all the time what comments to leave up and remove.
Mosher ==> WUWT does not remove comments unless they seriously violate the civility rules. There is no “nonsense filter” — for example, your comments are always posted and left up — to the best of my knowledge (you seldom do worse than silly ad hom and mysterious snipes.)
I personally have had to specifically ask (albeit, very rarely ) that a comment be removed as threatening violence or being blatantly racist that had somehow slipped through.
But being idiotic or ignorant or crazily obviously factually wrong is not grounds for comment deletion here.
Your assertion is false — and, personally, I believe you are well aware of that fact.
Kamis and other geologists have know about this for years:
https://plateclimatology.com
Too much Atmospheric Bias won’t allow the truth to be told–too many careers are in jeopardy.
ggm, ….. at least those sub sea volcanoes and hydrothermal vents play a larger role than humans do.
Buy anyway, ………………….
@ Kip Hansen — 18 May 2020
The coronavirus “lockdowns” which directly caused a horrendous decrease in anthropogenic CO2 emissions, ….. has amounted to little more than an insignificant negative “blip” on the Mauna Loa “radar”.
But now, iffen you “lockdown” the world’s termite population for the same amount of time, ….. said Mauna Loa “radar” would record a significant negative “blip”. (estimates are that termites emit 10x CO2 than humans emit)
And “NO’, …. Forget about it. ….. Don’t even think that. …… The biomass in the Northern Hemisphere has no noticeable effect on the Mauna Loa CO2 “radar” Recording.
And that is a scientific fact. ……… And “YUP”, ……. it sure is.
And that is because the NH’s green growing “live” biomass is ingassing CO2 during the Spring and Summer months when it is “warm n’ wet”, …… while at the same time, …. the NH’s decomposing “dead” biomass is outgassing CO2 during the Spring and Summer months when it is “warm n’ wet”,
And PS, if anyone reading this has a problem with their dead biomass “rotting” in their refrigerator, …… ya better call a Serviceman and get it repaired. 😊
I think I’m sitting on my dead biomass…
Volcanic CO2 is underestimated by just under two orders of magnitude.
The oceans contain 93% of all available CO2 on earth.
The Atmosphere 1.5% and the rest in biomass.
With the amount of ocean/atmosphere exchange of CO2, the ocean is the undeniable driver of the CO2 that ends up in the Atmosphere.
A warming ocean will outgas CO2 and a cooling ocean will absorb it.
From a few thousand years after the end of the last Ice Age, once the bulk of the cold water from melting glaciers entered the oceans, the oceans have been mostly warming and mostly increasing CO2. Perhaps during the little ice age there was a short plateau, but pretty much ever since, oceans have been outgassing, and that is where the steady, regardless of the amount of CO2 we produce, rise comes from.
Ah, just looked up total Human Carbon burned so far…
The entire biosphere, basically everything above the continental plates, there is 41,000 gigatons of carbon. Of that, Humans have converted 403 gigatons from trees, coal and oil into Carbon Dioxide. A bit less than 1% grand total change…
astonerii – May 17, 2020 at 6:17 pm
Astonerii, …….. where in ell have you been hiding for the past 5 or 15 years, …… while I’ve been desperately needing your help in teaching a big, big majority of subscribers of this forum ….. the actual, factual biological and physical science of the natural world we all live in/on.
Cheers, …… SamC
But CO2 is also absorbed by the oceans – right? Or is it heat that’s absorbed by the oceans?
I’m confused
Spalding Craft, …… both heat and CO2 can be absorbed by the ocean waters …. and both can be emitted by said water. A Google search will explain it.
Thanks, links to the data please?
Exactly.
The Henry’s law, applied to the oceans – atmosphere CO2 equilibrium, may explain almost entirely why such human CO2 emissions variations (some 10% of 3% of the total estimated CO2 emissions per unit time) are naturally compensated “in a snap” and thus they will likely never be measurable.
Plus the greening of the planet, and expansion of plankton, bodies and their carbonate shells (think White Cliffs of Dover, which are made of the skeletons of dead plankton, for scale). Perhaps only a third of the 403Gt of emissions stay in the atmosphere.
You mean, astonerii, us humans don’t have our fingers on the climate control knob? Yesterday I drove around the block in my SUV, with my dogs, to warm the climate up and it was for nothing? I kind of liked the idea we could stall the next glacial cycle of our current Ice Age, but guess not. Now I’m really desperate to get some golf in. Stay sane and safe.
To astonerii:
Your comment has put figures onto my tentative conclusions. Thank you so much,
This is what I don’t get. If warming oceans out-gas CO2, How can the ocean become more acidic? Algae blooms?
“In conclusion, we have shown here how increasing carbon dioxide in
the atmosphere can indeed decrease the pH of the ocean – in principle even
turn it acid – but in most cases adds the principal building ingredient of sea
shells and coral reefs, carbonate ions. The effects range from completely zero
(in the case of a pure ocean) to a linear increase in carbonate-ion density (in
case of a buffered, constant pH, environment). In intermediate-buffer cases
some carbonate ions can be removed from the ocean by adding carbon dioxide.
It shows how we should take care not to take rapid conclusions in thinking that
any pH decrease will always destroy food for sea life. Things are a little more
complicated than that.”
http://eujournal.org/index.php/esj/article/view/10985/10528
European Scientific Journal June 2018 edition Vol.14, No.18 ISSN: 1857 – 7881 (Print) e – ISSN 1857- 7431
Carbon Dioxide and Ocean Acidification
Peter Stallinga, PhD
University of the Algarve, FCT-DEEI and CEOT, Portugal
Doi: 10.19044/esj.2018.v14n18p476 URL:http://dx.doi.org/10.19044/esj.2018.v14n18p476
From different sources I’ve read evidence that human activity is only responsible for about 5% of the total CO2 emissions into the atmosphere each year, and that with the COVID lockdown there is an approximately 17% reduction in those human emissions. 5% of 17% gives us a 0.85% reduction in overall annual emissions if the lockdown stays in place for a year – not at all surprising if it doesn’t show up in the ongoing atmospheric CO2 measurements. Devastatingly disappointing however for the adherents of the CAGW religion. I imagine this is how Dorothy felt when she looked behind the curtain.
Not unexpected that humans were not driving source of CO2 but the rhetoric of AGW has been very well promoted. So much money, so much political power on the line. I am not sure that facts can overcome the fiction of AGW.
Facts must overcome the fiction of AGW. This fraud must be ended.
Thank you, Kip Hansen.
This information must ‘flood the zone’.
Take a look at what is being reported by CBC.
https://www.cbc.ca/news/technology/co2-emissions-pandemic-1.5575391
Take a look at what CBC is reporting.
https://www.cbc.ca/news/technology/co2-emissions-pandemic-1.5575391
This doesn’t surprise me at all. If anything, in the USA, people may be using more electricity at home because they are at home and have to work from home, whereas businesses that had to shut down aren’t using electricity and/or gas as much as they did before the lockdowns, if at all.
However, it’s mid-May, and I”m still running the furnace because the outdoor temps are below a comfortable lever. That does concern me, as it should not be happening, should it?
😮
Oh. Yes.
After all….
Evidence for [U.S.] warming is also observed in seasonal changes across many areas, including earlier springs, … .
Thus saith: https://www.ametsoc.org/index.cfm/ams/about-ams/ams-statements/archive-statements-of-the-ams/climate-change1/
(Hi, Sara 🙂 )
(sigh) Edit: “Oh. Yes, indeed, it should not be!
For the last twenty five years I have taken pictures of the wild white Corydalis and blue Phlox that cover the ground of the wooded property next to my home. When I first moved here they were out by the first and second week of April respectively. this year the Corydalis were not out till the third and fourth week of April. The “Norm” is “Expect a frost until Mothers Day.” However this year we even had a “Hard Freeze,” not just a frost, on May 10th and 14th! Can not recall a “Hard Freeze” in May in my 77 years.
After all the speculation about ‘rising temps’ across the continental USA in the days after 9/11 – because of the planes being grounded – how much higher should world temps be with almost the entire world’s fleets of planes grounded and factories shut downs?
Yes this is what interests me. Especially with many ground thermometers near airports, I’d be really interested to see if there is a CV19 signature in the temperature data
Another climate learning moment that will go to waste, I’m sure. Michael Mann will have to dust off his patented statistical methodology to crank another hockeystick out of red noise.
Fiction is always seen as a much better read than facts, especially amongst the Climateers.
–Maybe abandoning fossil fuels and all the advantages of modern society isn’t a solution to rising CO2.–
Why does rising levels of plant food, need a solution?
If wanted to reduce CO2 emission, you would promote more Nuclear power.
And advantage of nuclear power is one make a lot of nuclear fuel.
Of course another idea is to move industry off planet Earth.
The barrier to moving industry {and/or server farms} off Earth is the high costs of electrical power in space.
And we could lower the price of electrical power in space, if the moon has water, which can made into rocket fuel.
What is needed is exploration of the Moon to determine whether there is mineable water at the lunar poles.
Of course a possibility is there is not mineable water on the Moon.
But it could be that exploration will indicate there is not mineable water, now, but some point in future , it could be mineable.
Water at lunar polar region, could become mineable if launch cost from Earth became low enough and over the decades launch price has been lower. It addition the trend of lower launch cost, if knew Earth launch had to be X order to mine lunar water, efforts could be focus to lower launch costs to X.
Anyways, we known the lunar poles may have mineable water for decades, but so far the world’s space agencies have failed to explore to Moon to determine if and where they could be mineable water.
But perhaps that will happening soon.
You’re right. James Hansen is one of the few who promotes nuclear energy on the alarmist side. For many, it’s only a matter of extracting a piece of the pie by harvesting renewable tax credits and taxes on fossil fuels.
Perhaps somebody can look for impacts in the much ignored OCO-2 satellite data?
Boy !, nasa sure has been quiet about the output of that data and what it may show !
After the OCO-2 team published a series of papers in Science Mag in October 2017 that totally invalidated the Bern Model, the OCO-2 science papers on CO2 from the OCO-2 team came to a halt.
You have to understand that the Bern Model plays a central role in IPCC Climate Scam of modeling emissions to observed atmospheric CO2 increases. A simplified form of the Bern Model was submitted for peer review just before those OCO-2 papers came out of Science Mag publication embargo.
https://www.geosci-model-dev.net/11/1887/2018/gmd-11-1887-2018.pdf
No doubt the implications of those OCO-2 findings, things like the tropics were net sources of CO2 and at odds with Bern Model assumptions, set off some level of panic in the IPCC CO2 scammer community.
Everyone in IPCC CO2 scammer community were expecting the OCO-2 results to confirm the models outputs of CO2 sources and sinks that NASA and the IPCC had relied on for years.
And what do climate pseudoscientists do when observation conflicts with models?
In this case they just downplayed and ignored the OCO-2 data, stopped further manuscript outputs from the team on CO2 and apparently they have gone on about their climate dowsing divinations.
I deliberately didn’t explicitly itemise the ways that OCO-2 has been sidelined – even though I’m well aware of much that hasn’t happened – having followed the project since before the start.
It amuses me on occasion to point geophysicists and engineers (my peer group) at Eric Swenson’s effort published at WUWT and Euan Mearns’ piece with Eric and watch the now customary shows of indignation 🙂
While NASA puts citizen science at Jupiter front and centre – here we have a resource that is observing CO2 globally, has terrabytes of archived data which poses some rather serious questions about the understanding of CO2 on Earth – and it is being roundly ignored….
Since Eric has done some spadework and enough crumbs of of the recipe are there to enable a computationally savvy person to pick up the baton – maybe it’s time for a WUWT sponsored effort to do some more “citizen science” and generate some animations of the data with relevant commentary to highlight some of the questions posed by the observations?
I for one would contribute what I could ….
Joel, tomo- thanks!
I needed this reminder and to check out those old posts.
What can I suggest? First, the human element is completely swamped by nature. Second, parsing out changing human contributions like the econ shutdown during the current crisis may be a measurable variable that can eventually be mapped and could begin to parse human emissions from natural sources in this vast OCO data sea space. Third, how about AI? Toss out the Bern Model, use emerging AI tools to examine the data and probe the data for closer inspection.
I would bet Vegas money that the last option is already being done or planned. I hardly can sea(!) how tossing it all out leads to mproved results or progress, although that may well be the fate of Bern through drastic revisions in modelled theory.
It is such a head tosser: theory versus data debates have seen excesses and retreats in astronomy with recurrently. Such is the fate of every naive young science, and climate has forever been baby steps beyond warnings and weekly or semi-weekly forecasting.
Good idea to have a citizens science effort here, since it seems NASA isn’t going to reveal inconvenient data.
It also is likely there have been some quiet deliberations going on for the past couple years deciding how to “Fix” the data, stop monitoring those inconvenient factors, amp up the alarm by monitoring cities rather than forests, etc.
A broad FOIA request should be a part of the effort to find the reality of the CO2 satellite data.
true that,
they focused on nitrogen instead didnt they?
mostly over china and other areas with crematoria running 24/7
No, the NO2 story is followed by sensors on other satellites. OCO-2 is pretty straightforward experiment-data collector and has just 3 spectrophotometers looking NADIR as it moves in its polar orbit with the A-train. The problem with that A-train is that is moves over the same ground point at the same time every day.
This has been used as criticism of the OCO-2 data, and thus used to discount its “inconvenient data on CO-2 sources and sinks that destroy the Bern Model used by the IPCC.
An OCO-3 set of spectrophotometers instrument package has now been installed on the ISS, and is collecting data.
https://ocov3.jpl.nasa.gov
OCO-3 has a steerable mirror system to allow off-Nadir pointing of the aimpoint of the OCO-3 data collection . This allows off-Nadir snapshot area mapping (SAM mode) to look at particular (political) targets of interest.
The intent here is obviously to point out the “dire” point source emissions of things like cities, to increase the alarm factor about urban emissions.
https://ocov3.jpl.nasa.gov/newsoco/index.cfm?fuseaction=ShowNews&newsID=185
NASA published this in January 2020, “OCO-3 is on track to produce its much-anticipated CO2 maps, including hotspot maps over various cities, this April.”
Crickets of course for now (May 2020) with the COVID-19 economic shutdowns-driven fall-off of CO2 from those “hotspots” emissions. The Level 1b data that can be publicly downloaded requires some serious level of data curation and data processing and expertise to make it into usable Level 2 and then publicly understandable Level 3 products.
Not sure if we’ll ever see any published results from OCO-3 if they conflict with the Bern Model as well. But OCO-3 was designed not to be the global wide area monitor that OCO-2 is, but rather to concentrate its data efforts on particular target like industrial cities, etc, and not show the problems with things like the tropics being sources not sinks.
The problem with the ISS OCO-3 data collection is the orbit’s ground track limits its coverage to the platform inclination of +/- 51.6 degrees, and then some small amount of steerable pointing with the mirror off nadir. The higher latitude data that the polar orbiting OCO-2 collected during the sun-lit summer months of the higher latitudes will not be in the OCO-3 data set, and thus OCO-2 won’t monitor that large sinks of the higher northern latitude boreal forests and arctic tundra pulling down CO2 in the summer.
Kip,
Maybe you should read the recent post by Dr. Spencer entitled “Why the Current Economic Slowdown Won’t
Show Up in the Atmospheric CO2 Record”. The basic summary being “The point is that given the large
month-to-month variations in natural CO2 sources and sinks seen in Fig. 2, it would be difficult to see
a downturn in the anthropogenic source of CO2 unless it was very large (say, over 50%) and prolonged
(say over a year or longer).”
True, the monthly shows no ding whatsoever. However, the daily/weekly has the disadvantage of cutting off one year back, thus not showing the Feb/Mar/Apr patterns from last year.
It would be far more instructive to see the D/W graph back to January 2019 in order to scrutinize the pattern in the fine grain. Or — five years of Jan-May daily/weekly side by side. What is necessary to claim there is or is not any evidence of even a slight change to the noise is a baseline of behavior, such as that would give.
It is too easy for some to claim “well, looking at the monthly, there does not seem to be any change, but that does not mean there has been no change … the scale is too crude to see the ding.”
You realize what you are saying about the human contribution that we are to pay $93 Trillon for?
Excerpted from Kip Hansen’s commentary in reference to his posted NOAA’s monthly mean CO2 ppm graph of 2016 thru 2020.
Kip, not only that, …… but this year, through May, looks precisely like each of the previous sixtytwo (62) years depicted on the Keeling Curve Graph. And, of course. there are noninfrequent “seasonal variations” in/of the Southern ocean waters resulting from volcanic eruptions, El Ninos, La Ninas and/or extensive cloud cover if it occurs over ocean surface.
Ah, yes. The mystical extended future prediction. Coupled with the magical caveats; “difficult to see a downturn in the anthropogenic source of CO2 unless it was very large”.
Amazing, no influence on today’s or even this year’s atmospheric influence; but just wait till next year…
Yeah, sure…
Just more climate devout delusional gesticulations and postulations, by those who have been trying to shut down global economy for over three decades…
Now global economies are locked down far in excess of what CO₂ religious believers claim are needed…
No impact to CO₂ atmospheric concentrations.
Human CO₂ emissions are insignificant regarding contributions to atmospheric CO₂.
The magical mystical climate control knob claimed to be fully under human control, the insignificant influence on a trace atmospheric gas.
Pure hubris… ‘Next year’ they cry!
Yeah, right…
Stefan Rahmstorf tells us what to do:
https://twitter.com/rahmstorf/status/1258342575217483776
Bassed on the analysis from CarbonBrief
https://www.carbonbrief.org/analysis-what-impact-will-the-coronavirus-pandemic-have-on-atmospheric-co2?utm_content=buffer34b85&utm_medium=social&utm_source=twitter.com&utm_campaign=buffer
😀
The seasonal cycle is far too large for any change in the long-term trend owing to a temporary shutdown to show up.
Sceptics are wasting their time getting excited about this.
It is not “sceptics” (sic) who are “getting excited”. It is the climate scammers who had hoped to show that slow downs in human CO2 emissions can have measurable changes in the observed atmospheric CO2 build-up. That is afterall what “carbon neutral” is supposed to achieve, measurable reductions in the rate of CO2 growth.
If that assumed mechanistic coupling of human CO2 emissions to the touted “100% of the annual atmospheric CO2 growth” breaks, then the whole climate scam gets exposed as the naked emperor with no clothes to the public.
Incorrect. Plenty of sceptics have seized on this as evidence that human emissions do not affect atmospheric CO2. There are plenty of examples in this comment thread.
Evidence please- links
Jit, ….. actually it is both the climate “skeptics” and the “scammers” who are excited about the results of the virus “slowdown”.
If no reduction in atmospheric CO2 ….. the “skeptics” will be proven correct and the “scammers” will be outed for what they are.
Izaak ==> Spencer, whom I think is a really smart guy, says:
“The reduction in economic activity would have to be 4 times larger than 11% to halt the rise in atmospheric CO2.”
And, he is probably right — but even an 11% Reduction should show up in the record — (it certainly has in the Dow Jones Average …).
No one thought that the lockdown would stop CO2 from rising altogether — that Atnmospheric CO2 would start trending down. But look at the Daily/Weekly graph from NOAA. If Spencer’s 11% is correct — it should show up there, at least as a blip.
Mankind adds ≈5 ppmv CO2/yr to atmosphere (& nature removes ≈2.5 ppmv CO2/yr, though negative feedbacks like greening). A global 25% reduction in CO2 emissions for 2 months would reduce that 5 ppmv sum by 5×(2/12)×0.25which is only ≈0.21 ppmv. That’s “down in the noise,” compared to normal seasonal variations in atmospheric CO2 level, which is why it isn’t noticeable.
([times] are from this video of Dr. Murry Salby’s lecture, Hamburg, Germany, 2013 https://www.youtube.com/watch?v=2ROw_cDKwc0 )
My notes:
[36:34] — Native Source of CO2 – 150 (96%) gigatons/yr
— Human CO2 – 5 (4%) gtons/yr
That is: native CO2 is 2 orders of magnitude greater than human.
[37:01] — Native sinks approximately* balance native sources (difference = net CO2).
*Approximately, thus, even a small imbalance can overwhelm any human CO2.
Salby is very confused.
Re: [37:01] “Native sinks approximately* balance native sources…”
That is wrong. It is not true that “native sinks approximately balance native sources.” Natural CO2 sinks exceed natural CO2 sources, currently by about 2.5 ppmv per year. (That’s because of natural negative (stabilizing) CO2 feedbacks, like greening, and dissolution into the oceans.)
In fact, we have sufficiently accurate data for both atmospheric CO2 levels and anthropogenic CO2 emissions to be able to say with certainty that total natural CO2 sinks have exceeded total natural CO2 emissions each year, for the last 61 years.
In other words, nature is not adding net CO2 to the atmosphere. Nature is removing CO2 from the atmosphere.
The fact that Salby nevertheless claims that nature, rather than mankind, is responsible for the increase in atmospheric CO2 levels is bizarre and contrafactual.
It makes no sense at all to credit nature’s removals of CO2 for the annual increases in atmospheric CO2 level.
re: [36:34] “…native CO2 is 2 orders of magnitude greater than human.”
Salby is comparing apples to oranges:
On the “natural” side he counts emissions of CO2, and ignores removals of CO2.
On the “human” side he counts net emissions of CO2.
If you compare apples-to-apples (i.e., net CO2 flux, from both sources), it is obvious that mankind is responsible for the increase in CO2 level. Mankind is adding about 5 ppmv of CO2 per year, and nature is removing about 2.5 ppmv of CO2 per year, so the CO2 level increases by the difference: about 5 – 2.5 = 2.5 ppmv per year.
Salby did another lecture 15 months later, and I posted a very detailed two-part review of it, on youtube, here:
Part 1. https://www.youtube.com/watch?v=HeCqcKYj9Oc&lc=Ugz4PYyTduSerqsIuhV4AaABAg
Part 2. https://www.youtube.com/watch?v=HeCqcKYj9Oc&lc=Ugz4PYyTduSerqsIuhV4AaABAg.8veOKDvzS6Z8veORR5Oap8
I am not going to go off-topic and cite all the arguments of Bart/Bartemis and Allan MacRae and F. H. Haynie and others that resoundingly affirm Salby.
I could write for pages.
One quick correction:
You misread my notes — and I grant that I may have written a bit sloppily there — (and you also misunderstood Salby’s lecture). “Net CO2” was referring to natural CO2 emissions, not “on the human side.”
Finally, I must tell you that the only reason I would bother to write all those pages of arguments to correct your misunderstandings would be for other readers who might be misled by you. It is clear to me from your comments that you are so confused about what you believe Salby to have been saying that to try to inform you would almost certainly be a waste of time.
You are absolutely correct. Nature removes CO2 from the atmosphere at this level of CO2. Humans adds more than nature removes, that is why atmospheric level is increasing. Anybody who can do an elementary mass balance – which Janice Moore obviously can not – cam verify this.
Is like your bank account. The cash flow is much higher that the net savings, which anyway are net positive if you use a tiny bit less than you deposit.
Karl
Strictly “Humans add more than Nature removes” is not the correct statement. Nature adds as well as removes and Nature adds more than 20 times the amount humans add. And some human activities remove.
JaneHM, Karl was talking about net additions and removals.
The net sum of human CO2 additions (as positive numbers) and removals (as negative numbers) is positive. It is in the neighborhood of 5 ppmv CO2 added to the atmosphere per year.
The net sum of nature’s CO2 additions (as positive numbers) and removals (as negative numbers) is negative. It is in the neighborhood of -2.5 ppmv, meaning that about 2.5 ppmv CO2 removed from the atmosphere by nature per year.
“Salby is very confused.”
You are being very generous Dave, your excellent reviews clearly expose Salby idea as patent nonsense. Unfortunately it keeps getting regurgitated by MacRae et al.
The latest stream of nonsense from the well funded cabal of trolls. As Janice Moore recognizes, most of this propaganda isn’t worth correcting. But to claim that “natural CO2 sinks have exceeded total natural CO2 emissions each year” is unabashed nonsense. Natural sinks and emissions of CO2 are by and large guesswork. They have never even been measured globally. It’s doubtful they ever will be. Salby has shown that the often resorted to argument that nature is a net sink of CO2 is likewise superficial nonsense:
https://youtu.be/b1cGqL9y548 [27:40]
Money can buy optics, but not brains.
Study http://retiredresearcher.wordpress.com
So now I’m “the well funded cabal of trolls”? Wow.
I’m going to try again to explain this to you, Jeremy, Janice, and “F”.
You say that “natural sinks and emissions of CO2 are by and large guesswork,” and that is true. But it is also irrelevant. You think it means we don’t know that total natural CO2 sinks exceed total natural CO2 emissions each year, but that is incorrect. We need not know the natural sinks and emissions of CO2 to be able to deduce their approximate sum.
The sum of the natural emissions & sinks is simply the difference between:
● the increase in atmospheric CO2 content, which is deducible from the measurements of atmospheric CO2 level at Mauna Loa (MLO), Cape Grim (CGO), etc.); and
● the net anthropogenic CO2 emissions, which are deducible from economic data about fossil fuel production/use and concrete manufacturing.
I think you must surely know that measured atmospheric CO2 levels are increasing at about 2.5 ppmv per year; here’s a graph:
https://sealevel.info/co2.html
The current rate of anthropogenic carbon emissions is about 11 PgC per year, which is about 5 ppmv CO2. Here are the data through 2014; the emission rate is a bit higher, now:
https://cdiac.ess-dive.lbl.gov/ftp/ndp030/global.1751_2014.ems
The difference between those two values, 5 ppmv annual anthropogenic emissions, minus 2.5 ppmv annual increase in CO2 level, is the net rate at which nature is removing CO2 from the atmosphere: about 2.5 ppmv per year.
Do you understand, now?
—Dr. Roy Spencer website, “Global Warming and Nature’s Thermostat,” January 28, 2008
(Copied from: http://www.stevegoreham.com/quotes-on-climate-change-environment-and-energy/ )
NASA knows this quite well:
https://earthobservatory.nasa.gov/global-maps/MYDAL2_M_SKY_WV
“Water is constantly cycling through the atmosphere. Water evaporates from the Earth’s surface and rises on warm updrafts into the atmosphere. It condenses into clouds, is blown by the wind, and then falls back to the Earth as rain or snow. This cycle is one important way that heat and energy are transferred from the surface of the Earth to the atmosphere, and transported from one place to another on our planet.
Water vapor is also the most important greenhouse gas in the atmosphere. Heat radiated from Earth’s surface is absorbed by water vapor molecules in the lower atmosphere. The water vapor molecules, in turn, radiate heat in all directions. Some of the heat returns to the Earth’s surface.
Thus, water vapor is a second source of warmth (in addition to sunlight) at the Earth’s surface.”
But … but … but … Hawaii is in the middle of the VAST Pacific Ocean! The reduction in Co2 just hasn’t gotten there yet … Right?
It is 6000 miles from Guangdong to Hawaii. If the wind blows from west to east at a steady 5 m.p. h. The trip takes 50 days. The CO2 chart says the last reading was May 15. Since the lockdown began in China more than 50 days ago, air from China has had plenty of time to get to Hawaii.
Walter… The ‘if’ in your calculation about wind speed over the Pacific is not true.
Now, if you want to see where the thermohaline circulation dumps into the surface waters, this little vid at UCAR will be instructive.
https://scied.ucar.edu/ocean-move-thermohaline-circulation
Look at what is going on in the North Pacific.
Just take a look at the satellite data. CO2 is not evenly spread throughout the atmosphere and there are clear weather driven currents of different concentrations, look at the swirls north of Hawaii!
It’s fascinating that one number from one location on an active volcano is defining input to the global climate crisis!
https://earth.nullschool.net/#current/chem/surface/level/overlay=co2sc/orthographic=-172.37,18.55,249/loc=-155.911,19.404
Huh, progress. Perhaps if it remains monotonic for a 30 year period, then the effect can be characterized as climate change.
Maybe abandoning fossil fuels and all the advantages of modern society isn’t a solution to rising CO2.
Kip, What you wrote implies that you think rising CO2 is a problem requiring a solution. CO2 is NOT problem, no solution no matter what, is required. Please stop allowing the other side to frame the argument. Stop buying into the bullshit!
+1
Steve ==> One has to face reality — Nations, whole regions (think EU) and even individual cities in the US are passing rules, laws, regulations attempting to forbid and/or reduce the use of fossil fuels for the stated purpose of stopping the rise in Atmospheric CO2 concentrations.
The UK has floated plans to ban the use of natural gas for heating and cooking for the same stated reason.
Yet, even with an 11 percent reduction in human sourced CO2 emission (ref: Spencer), there is no apparent change in the rate or quantity of atmospheric CO2.
That is all this post is meant to point out.
I was already going to be opting out of the net zero option, even before this data, but then so were the climate liars too. Hey we’re all in this – not tackling climate – together folks.
Does anyone know … is there a way to download the raw Keeling daily data?
Raw, not some anomaly chart.
If you can figure out how to use it.
https://www.esrl.noaa.gov/gmd/dv/data/index.php?site=MLF
GOT IT!
Downloaded MLO daily average.
17166 records.
Happily there is a clear parsing guide included.
Now to chew on this.
Thank you Scissor
Whoops. That dataset ends 12/31/2019. That will be good for establishing a baseline, but I’ll have to fish around for the 2020 release.
Meanwhile, just as a point of information, the following advisory is on the file:
——————————————->>>>
# WARNING
#
# dataset_warning: Every effort is made to produce the most accurate and precise measurements possible. However, we reserve the right to make corrections to the data based on recalibration of standard gases or for other reasons deemed scientifically justified. We are not responsible for results and conclusions based on use of these data without regard to this warning.
Translation of the dataset warning:
If the data doesn’t tell the story we want, we reserve the right to manipulate it until it does. And you can’t. It’s our data, so there. :p
Dear Windlord-sun,
There are many here FAR more qualified to answer your question. They may not happen to see it, though, so, here is what I came up with:
https://scrippsco2.ucsd.edu/data/atmospheric_co2/mlo.html
Hope that proves helpful to you.
Janice
Janice, I’ll follow that link after I parse what I just downloaded per the link from Scissor. If nothing else, to see if the dataset is the same! Thanks
Ok, downloading from the link Janice posted, the dataset
daily_in_situ_co2_mlo.csv
… is complete starting in 1958.
22,767 recordings
The last record:
5/2/2020 417.38
I’ll try to produce some comparison charts by tomorrow. I don’t even have to parse the elements into fields, as it is already in Excel columns. Thank you MLO.
A’ole pilikia 🙂
see new post below with link to graph …
So the indistinguishable, tiny % of the increase in CO2 attributable to man is going to cause catostrophic irreversible warming…but the natural portion won’t. How did so many smart people, and many more dumb people, ever fall for this nonsense?
WR2,
Approximately 200% of the annual increase in CO2 levels is attributed to humans. i.e. human activities
release twice as much CO2 per year compared to the annual increase. Of that 50% is absorbed by natural carbon sinks and the rest remains in the atmosphere. Once you take out the annual periodic change in CO2 levels caused by the seasons the natural change in CO2 levels is approximately zero.
Show us your math Izaak, with error bars. Your own words please, not deflecting links.
Photos of the pencil scratchings on the back of your envelope will be accepted.
Phil,
The calculations have been done by made researchers. For example have a look at:
https://www.earth-syst-sci-data.net/7/349/2015/essd-7-349-2015.html
Izaak
The problem is (and has always been) that those estimates are from modelling, not direct measurement of anthropogenic fluxes. Mathematically it’s fitting n variables when you have far fewer than n independent equations: you can get any value you want by fiddling with the other variables.
“The approach used to determine the global carbon budget
considers only anthropogenic CO2 emissions and their partitioning among the atmosphere, ocean, and land.”
A quote from the paper you submitted, page 369, paragraph 2.7.2, first sentence. They don’t even take volcanoes into account, except for Pinatubo in 1991. The only natural thing considered in this paper is “dynamic global vegetation models”.
Jane,
of course it is a model. How exactly would you suggest one measures human CO2
emissions? You can directly measure the amount of fossil fuels dug out of the ground
but where do you go from there? Do you want to put everybody in a controlled chamber
and measure the emissions? What about land use changes? How would you measure that?
The authors of the paper try and model the processes involved and make an estimate. It is imprecise which is why they give the errors on their estimates. But the results are quite robust in that human emissions are significantly greater than the observed rise in CO2 levels. Can you do any better or point to any different estimate?
Izaak
Yes we agree on how the estimates are generated. But that doesn’t mean those values are reality. At launch it was hoped that OCO-2 would provide measurements that were more direct, but those more direct measurements were quickly dirtied up with modelling of circulation and sources and sinks.
Human upon human parasitism. It’s not new.
For the same reason some people still think the earth is riding along on the back of a giant turtle: an authority figure told me so.
“Oh, but, W.R.,” one of the “smart people” would earnestly say, peering at you over his or her “sustainable” bamboo fence, “surely you know that the climate is like a camel with a big load of straw on its back. Just one straw too many and — down it goes!
And, and, the butterfly effect! You, you, you, you, can’t not have heard of that, can you? …………
I see from your face that you are still skeptical. Well, just keep THIS in mind, neighbor: the Precautionary Principle dictates that we must do a cure just-in-case.
You still look skeptical… . Huh. Uh, well…. [phone pings that a text just came in — reads it — brightens] Well! Gotta go. My pizza just got delivered to the front door.” Lopes away, calling back over her or his shoulder, “MY ORGANIC VEGGIE, SUSTAINABLE PEPPERONI, PIZZA — DELIVERED ON A BICYCLE……. WITH BAMBOO WHEELS!”
WR2 – 7:28 pmHow did so many smart people, and many more dumb people, ever fall for this nonsense?
Here are a few from my file of quotes factoids and smart remarks expressing that sentiment:
How can so many people be so easily convinced that events which have always occurred and extensively documented, be wholly new and unprecedented?
Well-intended but ill-informed people being led by ill-intended but well-informed activists…
Never underestimate the power of carefully worded nonsense.
Climate change is the religion of people who think they’re too smart for religion
Those who can make you believe absurdities can make you commit atrocities. – Voltaire
There are some ideas so wrong that only a very intelligent person could believe in them. George Orwell
“But the idea that the Worldwide Covid Lockdown has had any effect on atmospheric CO2 concentrations is simply not true. And that’s the news for the day…. Don’t ask me to explain it, I don’t know. But it sure is interesting – even I thought the lockdowns would show up at Mauna Loa.”
Thank you for this post. There are a few things to consider when relating observed changes in atmospheric composition to fossil fuel emissions (if fossils they are).
A whole bunch of links below with apologies to the moderator who is probably sick of these links by now as I have used them a few times in the recent past.
LINK#1: When the stated uncertainties in carbon cycle flows are not considered we can detect fossil fuel emissions in the mix and measure its effect on atmospheric CO2, but when the stated uncertainties in carbon cycle flows ARE considered the relatively small flow of fossil fuel emissions cannot be detected. Bottom line: from a purely empirical point of view we can’t even tell that fossil fuel emissions exist let alone measure their effect on the atmosphere.
https://tambonthongchai.com/2018/05/31/the-carbon-cycle-measurement-problem/
LINK#2: “Since the industrial revolution we have been burning fossil fuels and at the same time atmospheric CO2 has been going up.” This kind of logic has no causation interpretation as Tyler Vigen has shown over and over and over again.
https://www.tylervigen.com/spurious-correlations
LINK#3: To keep Tyler happy, what we need to do is to compute the detrended correlation between fossil fuel emissions and atmospheric composition at an annual time scale. Why annual time scale? Because the IPCC and the Carbon Project and climate science in general carry out this mass balance at an annual time scale. I looked for that detrended correlation. It’s not there. Here is my work.
https://tambonthongchai.com/2018/12/19/co2responsiveness/
LINK#4: Climate science has an answer to that and it is the Damon Matthews 2009 paper. Damon says screw the atmospheric composition thing because there is a near perfect correlation between cumulative warming and cumulative fossil fuel emissions. The regression coefficient of that relationship shows that temperature goes up by about 1.5C per terratonne of cumulative emissions give or take 0.5C. Climate science now says that this coefficient, that Damon calls the Transient Climate Response to Cumulative Emissions (TCRE), is the proof of human cause and the measure of the impact of emissions on temperature and also the tool we need to construct climate action plans with carbon budgets.
https://www.nature.com/articles/nature08047
LINK#5: Sadly for Damon and for climate science, Damon made a horrible statistics error in his TCRE proposal. It is described in detail in this post
https://tambonthongchai.com/2018/05/06/tcre/
LINK#6: For those not easily convinced by boring statistics argument, here is a demonstration of the spuriousness of correlations between cumulative values.
https://tambonthongchai.com/2018/12/03/tcruparody/
Always to the point and helpful. Keep it up.
Thanks again
Here are the hourly and daily figures from Mauna Loa. They differ a lot from other charts. Why is that?
The daily figures are obviously NOT the average of the hourly figures.
https://imgur.com/DttDZ3f
It seems to be impossible to get actual raw data from Moana Loa. I believe they throw away data that isn’t what they want to show us. Can someone digitize the hourly data and plot a trend line?
extracting numbers from that graph won’t help. The raw daily for the last five years is needed.
Mauna Loa is not the only station.
http://phzoe.com/2020/05/03/co2-versus-global-covid19-response/
Hansen, your graphics do not have the resolution needed to see a two-month change in CO2 levels.
Enough resolution ?
Last date 5/10/20
Henry ==> “[ If you don’t like this chart, try the Daily and Weekly Chart — it shows the same thing. ]”
Loa and behold! — who would ‘ve thunk it? — that human impact on an already tiny CO2 atmospheric percentage could be so insignificant?
Anthropo-ego is a limiting factor in the intellectual development of current-day humans.
Here in Edmonton, there has been a step drop-off in driving, with a consequent reduction in air pollution from cars, but you can’t tell from going out and breathing the air, because the change in air quality is so slight as to be imperceptible. Of course, Edmonton sits on a prairie, and the wind blows, so we’ve never really had a severe problem with air quality here. We’ve never had a severe problem with poverty either, but I fear we’re about to, because our oil and gas industries may not survive the collapse in global prices.
One word…..
Tillage
“That is, this year, through May, looks precisely like each of the previous four years. “
It doesn’t. It increases by a steady 2.5 ppm/year. That is the anthropogenic component. As Izaak W says, you should read ” “Why the Current Economic Slowdown Won’t Show Up in the Atmospheric CO2 Record”, a WUWT post by Roy Spencer, just two days ago.
Actually, the reason is really elementary. That 2.5 ppm/year is about 0.2 ppm/month. The estimates I have seen say that emissions are down about 10%. So you are looking at a reduction of 0.02 ppm for each month. The scale is about 25 pixels/ppm, so that increment is half a pixel.
Prove it.
Well, the graphics and numbers prove it. Nick is correct.
Why is this month’s ppm about 2 higher than last year?
The real question is how much this difference translates into atmospheric warming.
“Why is this month’s ppm about 2 higher than last year?’
Because CO2 concentration has been on an upward slope since 1960. That is a factual fact. It is not ipso facto proof of AGW.
Many say CO2 was dead flat for billions of years (/s) and that when capitalism unleashed the miracle of running civilization on combustion of fossil carbon, the flat, stable, never fluctuating concentration shot up so dramatically that AlGore needed a forklift to show the graph.
Needless to say, many disagree.
But that’s not the point of this thread. The point of this thread is that a massive shutdown of human-release of CO2 has not put the slightest ding or wobble in the slope. It is business as usual.
http://theearthintime.com/mlo-02.jpg
That makes us skeptical that the slope’s uptrend is due to human-release. And it makes us WaySkeptical that any government-driven effort to shut down the miracle life-affirming use of fossil fuels will accomplish anything.
windlord-sun ==> Actually, “CO2 concentration has been on an upward slope since”…..1750. Etheridge et al.
Kip, that is not a measurement. It is the slush of LawDome.
I only care about measurement. Which, for CO2, is since 1960
windlord-sun ==> For historical periods, we have only what measurements we have — of whatever we are measuring. There are other CO2 “reconstructions” take your pick — they all show CO2 rising since the late 1700s or so.
In other words, the more deluded reconstructions you pile up, having been constructed with confirmation bias, the greater the accuracy?
Not when the most ‘popular’ one is shown to be purely absurd:
2200 years of CO2 measurement, including across the last melt and the Younger Dryas, with a flux of 22 ppm? Twenty-two parts per millions?
Here’s the full exposition of the absurdity of ice as a proxy for CO2:
https://theearthintime.com/stomata-vs-ice.pdf
I don’t care what Law Dome says, or any other reconstruction (model). You do not know that CO2 has been rising steadily since 1750.
Hi, Windlord — Sun 🙂 Thank you for sharing those “picture worth a thousand words” graphs. Powerful evidence. I am going to get them marked by the court clerk and entered as Exhibit A (actually, Exhibit A–11) — over the past 32 years or so, many AGW-refuting exhibits have been entered into evidence — AGW is so dead 😆).
Thanks, Janice. Please link to them any time you wish. CO2ists require repetition in order for any alien fact to alight on brain.
Here’s another, showing the absurdity of ice core reconstruction of CO2
https://theearthintime.com/stomata-vs-ice.pdf
::::: wind :::::
PERSONAL to Kip (i.e., I am not interested in launching into a back and forth on the proxy issue):
The Law Dome ice core proxies analyzed using a damping equation are considered useful data by highly qualified scientists. Pehr Björnbom and Murry Salby, just to name two.
(http://hockeyschtick.blogspot.com/2013/07/swedish-scientist-replicates-dr-murry.html )
WLS waves them away as mere “slush.” His disdainful, empty, gesture is unhelpful. And, I daresay, it was beneath WLS’s dignity. While they do not absolutely disprove AGW, the ice core proxies provide strong evidence that atmospheric CO2 lags temperature by a quarter cycle.
WLS is obviously bright and writes well, however, WLS is not always right… .
You are doing a great job, Kip. Thank you for your perseverance for science truth.
Janice
P.S. (this is not about WLS) Re: those clinging with all their might to the “mass balance” CO2 conjecture — The marked pride and strong emotional reaction of most (not all) of those who vehemently try to show that Dr. Salby is mistaken is telling. They, (unlike F. Engelbeen) reveal by their emotive content that they have more riding on their assertions than simply arguing the science and the data. Without provocation, they snarl and make sweeping, grandiose, declarations with the tone of royalty insulted. When their analysis is countered with damaging evidence, they only get angrier and mostly just repeat *louder* what they have already said, adding nothing to their case. I wonder what it is that drives them. They sound as different from a calm, orderly, Pat Frank or Richard Lindzen as a kettle drum from a cello.
What do you think, Kip?
Is it as simple as Pride? Or is it something they cannot help, a broken psyche or soul injury… . Some people (I have observed some up close and at length in real life), probably due to some trauma in childhood, simply can-NOT admit they are mistaken. Ever. It threatens them to the very core of their being. Threatens them to the point that they cannot give measured, thoughtful, consideration to what might, just might, prove that they were wrong.
One particular unreasoning Salby (and all of those who find his analysis highly persuasive) attacker (that is only word to use, given his his style of writing vis a vis Salby) here at WUWT has a mercenary motive for keeping the AGW game at least partially going. He carefully promotes a soft-AGW, just enough to make people buy what he is selling (he revealed this himself in a comment or two a few years ago). HIS vitriolic, unsupported, snarls are rational.
The ones I’m wondering about are irrational (unless…. they, too, have a financial or other cui bono type interest to protect).
Okay. Thanks for listening. Would be interested in your thoughts.
Sincerely,
Janice
Janice,
I am glad you stated out front that characterization was not about me. If you had left that off, this reply would be different.
I do not “wave off” the claims of ice core study in general. Instead, I smash with justified anger when anyone attempts to weld precise measurement like Keeling to a proxy that has a resolution of centuries, and then totalize to catastrophe with it. Such as the investigation of Ms. Steinthorsdottir that I linked.
Janice ==> I do not have a dog in the Salby fight — but I’d be happy to discuss it (and anything else) with you — but not in public. You can email me at my first name at the domain i4.net.
I do agree that there are some irrational attack dogs here.
Kip,
I agree with Janice that I can be wrong. I’m not retracting my fury over anyone duct-taping ice with measurement, nor my conclusions regarding the Steinthorsdottir paper, but I will retract my outburst about LawDome if I am wrong. And apologize.
Can you or Janice or anyone help, in this way?
A link to the raw data, hopefully with an abstract of the methodology, for LawDome. I will look deeper than my first attempt a few minutes ago, but you might have your finger right on it.
Frankly, ice core reconstruction from recent years? That seems fraught on its face. For instance, what is the depth of the ice at LawDome for the year 1750? 1950?
windlord-sun ==> I have my doubts about a lot of the “historical reconstructions” — of temperatures, CO2, rainfall, etc etc.
They are, AT BEST, sorta-kinds-educated- guesses.
If one has enough different reconstructions of the same thing (CO2) — assuming that they are not co-dependent — then one can get “an idea” about the past. ut nothing better than that.
Wait, I found the NOAA download site.
Uh-oh. Kip, the graph you linked, which is repeated at the next link ….
… is a hockey stick!
It apparently consists of the three Law Dome cores from 1006 to 1978, with various Firn air and other measurements (see the NOAA abstract below) grafted on the Law Dome analysis.
The only thing that is still of interest after discovering that, is the claim that “three ice cores have unparralleled [sic] age resolution.”
Since I am dubious of that claim, based on the Steinthorsdottir paper and David Middleton’s sharp analysis, I would have to dig into that claim. What makes the Law Dome cores and better than Epica (for instance) in resolving spikes and dips?
https://www.co2.earth/co2-ice-core-data
Three ice cores drilled at Law Dome, East Antarctica from 1987 to 1993 resulted in atmospheric CO2 records from 1006 A.D. to 1978 A.D.
The records extend into recent decades for which instrument measurements of atmospheric CO2 levels occured. This was enabled because of the high rate of snow accumulation at the Law Dome drill sites. Scientists reported that the air enclosed in the three ice cores have unparralleled age resolution.
Uncertainty in the data is 1.2 parts per million (ppm). Pre-industrial CO2 levels range from 275 to 284 ppm. Lower levels occured between 1550 and 1800 A.D. These ice cores show major growth in atmospheric CO2 levels in the industrial period except 1935-1945 A.D. when levels stabilized or decreased slightly.
https://www.ncdc.noaa.gov/paleo-search/study/9959
New measurements of atmospheric greenhouse gas concentrations in ice from Law Dome, Antarctica reproduce published Law Dome CO2 and CH4 records, extend them back to 2000 years BP, and include N2O. They have very high air age resolution, data density and measurement precision. Firn air measurements span the past 65 years and overlap with the ice core and direct atmospheric observations. Major increases in CO2, CH4 and N2O concentrations during the past 200 years followed a period of relative stability beforehand. Decadal variations during the industrial period include the stabilization of CO2 and slowing of CH4 and N2O growth in the 1940s and 1950s. Variations of up to 10 ppm CO2, 40 ppb CH4 and 10 ppb N2O occurred throughout the preindustrial period. Methane concentrations grew by 100 ppb from AD 0 to 1800, possibly due to early anthropogenic emissions.
windlord ==> I only link the Law Dome to establish a generalized DATE for when CO2 began to rise — not for any numerical/quantitative purpose.
The date, naturally, coincides with the general date foe “the end of the Little Ice Age”.
See my two-part series “Why I Don’t Deny: Confessions of a Climate Skeptic” https://wattsupwiththat.com/?s=Why%20I%20Don%27t%20Deny
Dear Windlord-Sun,
I hope your day is going well.
Today is not a good day for me to do much research (to find the raw data you requested). So, I hope that what I did manage to find:
https://agupubs.onlinelibrary.wiley.com/doi/full/10.1002/jgrd.50668
will prove helpful to you.
You have my respect. Now, not only for your intelligence, but for your fine strength of character. And, yes, indeed, there should be no “duct taping on” or splicing of two data sets together as you described. Good point. 🙂
Also, just a note re: Mr. Middleton. While amateur (meaning, simply, not for money, but for the love of the subject) scientists can do excellent work, bear in mind that Middleton’s qualification in atmospheric chemistry, physics, and like areas of study is much less than that of Dr. Salby (for instance, he wrote this book: https://w ww.amazon.com/Physics-Atmosphere-Climate-Murry-Salby/dp/0521767180 ) and others such as Allan MacRae and F. H. Haynie and D. M. Etheridge whose work he criticizes. Not an appeal to authority, simply a heads up about the qualifications of a person whose analysis you are relying on.
You sound like a fine individual. Your family and friends are blessed to know you.
Take care,
Janice
Hi Janice, thank you for your kind words and support. I realize I am something of a bad boy in the Climate Realism cohort, and I am sure I irritate both sides sometimes. In normal times I would be more sober, like Richard Lindzen and Ross McKitrick et al, but the alarm cohort is causing actual damage to the human community, and it makes me angry. I am tempted to join in with the speculative profile you posted, but must refrain for now. I am wary of psychologizing. I don’t like it when people do it to me, and I consider it [/s] beneath my dignity to do it to others. It is tempting, however. You made some intriguing points.
I will check the links you gave just now, but in the interim after requesting a link to Law Dome, I located two solid links for the Law Dome project, including the official NOAA depository. I made a post here about that.
On discovering that the “payoff” chart,
… is a graft of ice core process onto various other proxy and alt measurement, I am backing down for now, I lost interest.
I concede that those performing the attaching of Law Dome data with alt measuring since the termination date of the ice cores may have done a “better job” of grafting apples to apples, but I won’t stipulate it. The meme of using that method for propaganda is too tempting, and has been too successful, for me to waive doubt.
One last thing … “Not an appeal to authority, simply a heads up about the qualifications of a person whose analysis you are relying on.”
I read Middleton’s work very closely. I did not know, nor care, about his qualifications. I was convinced by his arguments, period. So I’m not really “relying on” his analysis; I concur with it. It helped that I discovered after the fact that he had cited the Steinthorsdottir study in his exhaustive analysis, the same one I previously discovered by chance elsewhere and examined to arrive at a challenge to ice core analysis as valid sufficiently to weld to measurement.
P.S. For WLS — Just found this:
https://cdiac.ess-dive.lbl.gov/trends/co2/lawdome-data.html
Hope it is helpful!
Dear Kip,
Thank you for your kind offer to correspond via e mail. For now, I am going to decline, but, I am grateful that you were willing.
My main purpose in our discussing SDS (Salby Derangement Syndrome — heh), was to ellicit something from you along the lines of:
I do agree that there are some irrational attack dogs here.
That’s all I hoped for. Just some affirmation. And, so, thank you for that.
Thank you, again, for all you do on WUWT to promote science truth and expose the legerdemain behind the waving red scarves and conjurer’s sleight of hand performances such as “Mike’s Nature trick.”
Janice
Janice ==> How nice of you to remember one of my favorite posts — “Cowtan and Way – The Magician’s ‘Red Scarf Trick’ with Linear Trend Lines”
Maybe it takes more than a couple of months for the mauna loa detector to pick up the drop? There must be a drop as humans have been producing less CO2 for at least two months now. So perhaps if the lock down goes on for another 2 or 3 months we may see a drop in the readings. Also need to think about looking at other CO2 measuring stations, see what they are showing.
ARThur ==> See the data at Scripps: I gave a link in a comment just a minute or two ago.
Hi ARThur,
several things:
1) Yes, it is possible that it would take longer for the drop in emissions to make a “ding” in the Mauna Loa concentration recordings. I don’t know that anyone can say yes/no to that. This is unprecendented.
2) “There must be a drop as humans have been producing less CO2 for at least two months now.” I say that is an unwarranted assumption. Leaving aside #1 above, it is possible that claims of human emissions being responsible for all or most of the upslope over the last 60 years, and especially the last 20 years, have been exaggerated.
3) “Drop” I would not use the word ‘drop’ when looking for changes due to the 17% emissions reduction. Whatever is forcing the Keeling Slope up, this reduction is not likely to make the concentration reading “drop.” However, there should be at least a wobble or ding in the normal behavior of the daily sine wave.
Thank you (?) for the “honorable mentions” here. For clarity, I am AGNOSTIC on this issue, which is a contest between the “mass balance argument” of Ferdinand Engelbeen et al and the conclusion of scientists Murry Salby, Hermann Harde and Ed Berry that the observed ~2ppm/year increase in atmospheric CO2 is mostly natural..
While this is an interesting scientific question, I have not invested much time in it, because I don’t need it to falsify the ridiculous man-made runaway global warming / climate change scare, the greatest scientific fraud in history. I published in January 2008 that atmospheric CO2 changes lag atmospheric temperature changes by ~9 months in the modern data record, and that is incontrovertible – more on that below. It is therefore true that the sensitivity of global temperature to increasing atmospheric CO2 is very small, and perhaps does not even exist in measurable reality – thus there is no real global warming crisis – it is a scary fiction – “zombie science” – be very frightened!
In January 2008 I published another paper with ~25 falsifications of the global warming fiction – but as Einstein famously stated – “One would be enough”.
For the record, I know Murry Salby and Ed Berry and they are extremely intelligent men – much more so than those who throw stones at them. See Ed Berry’s latest paper, cited below.
Following is one of several posts I have made to clarify my position on this subject.
Regards, Allan
https://wattsupwiththat.com/2020/05/01/noaa-satellite-records-second-largest-2-month-temperature-drop-in-history/#comment-2983588
See this post for other links, deleted per Anthony’s request.
J Lang wrote:
“Does this mean that a higher temperature leads to an increased CO2 enrichment of the atmosphere?”
YES – Higher Nino34 temperatures drive higher atmospheric CO2. This is a shallow ocean Sea Surface Temperature driven (SST-driven) phenomenon.
“Is this proof of what can be seen in the ice cores: the lag in CO2 after temperature?”
PROBABLY SIMILAR, but on a much longer time scale (~~ 800 year lag of atm. CO2 after atm. temperature observed in ice cores), due to deep ocean impacts on atm. CO2.
I proved that “atmospheric CO2 changes lag atmospheric Temperature changes by ~ 9 months” in Jan2008. My observation has largely been ignored since then, because it spoils the “CO2-drives-climate” circle-jerk of politicized academics and their devoted minions.
CARBON DIOXIDE IS NOT THE PRIMARY CAUSE OF GLOBAL WARMING, THE FUTURE CAN NOT CAUSE THE PAST
By Allan M.R. MacRae, January 2008
Plot: http://www.woodfortrees.org/plot/esrl-co2/from:1979/mean:12/derivative/plot/uah6/from:1979/scale:0.22/offset:0.14
In Jun2019 I demonstrated WHY atm. CO2 changes lag atm. Temperature changes by ~ 9 months here:
CO2, GLOBAL WARMING, CLIMATE AND ENERGY
by Allan M.R. MacRae, B.A.Sc., M.Eng., June 15, 2019
Salby, Berry and Harde have all hypothesized about the longer-term, deep ocean phenomenon, and have been vilified for their efforts. While I remain officially agnostic on this point, some of the smartest people I know think that they are correct. I recently wrote:
If Ed Berry is correct in his paper, the observed increase in atmospheric CO2 is largely natural and human CO2 emissions play only a minor part in the increase of CO2. Therefore, any human-caused downturn due to the Covid-19-driven economic lockdown will be too small to detect. Check Reference #47. 🙂
From the Abstract:
“Human emissions through 2019 have added only 31 ppm to atmospheric CO2 while nature has added 100 ppm.”
PREPRINT: “THE PHYSICS MODEL CARBON CYCLE FOR HUMAN CO2”
by Edwin X Berry, Ph.D., Physics
ABSTRACT
The scientific basis for the effect of human carbon dioxide on atmospheric carbon dioxide rests upon correctly calculating the human carbon cycle. This paper uses the United Nations Intergovernmental Panel on Climate Change (IPCC) carbon-cycle data and allows IPCC’s assumption that the CO2 level in 1750 was 280 ppm. It derives a framework to calculate carbon cycles. It makes minor corrections to IPCC’s time constants for the natural carbon cycle to make IPCC’s flows consistent with its levels. It shows IPCC’s human carbon cycle contains significant, obvious errors. It uses IPCC’s time constants for natural carbon to recalculate the human carbon cycle. The human and natural time constants must be the same because nature must treat human and natural carbon the same. The results show human emissions have added a negligible one percent to the carbon in the carbon cycle while nature has added 3 percent, likely due to natural warming since the Little Ice Age. Human emissions through 2019 have added only 31 ppm to atmospheric CO2 while nature has added 100 ppm. If human emissions were stopped in 2020, then by 2100 only 8 ppm of human CO2 would remain in the atmosphere.
Correction to above post:
In January 2020 I published another paper with ~25 falsifications of the global warming fiction – but as Einstein famously stated – “One would be enough”.
THE CATASTROPHIC ANTHROPOGENIC GLOBAL WARMING (CAGW) AND THE HUMANMADE CLIMATE CHANGE CRISES ARE PROVED FALSE
By Allan M.R. MacRae, B.A.Sc.(Eng.), M.Eng., January 10, 2020
https://thsresearch.files.wordpress.com/2020/01/the-catastrophic-anthropogenic-global-warming-cagw-and-the-humanmade-climate-change-crises-are-proved-false.pdf
Thank you for the clarification, Allen.
As for whether, “CO2 changes lag atm. Temperature changes by ~ 9 months,” I think that might depend on the finer details of what you’re contending.
Your WoodForTrees graph does not compare “CO2 changes” to “temperature changes.” Rather, you graphed the derivative of 12-month-averaged Mauna Loa CO2 level (let’s call it CO2′, using Lagrange’s notation) against global temperature level. In other words, you graphed CO2 change rate vs. temperature level.
There’s certainly a correlation, though I don’t see the 9 month lag that you see. Sometimes peaks in CO2′ rate lag temperature level peaks, but at least as often, peaks in CO2′ lead peaks in temperature. In this copy of your WoodForTrees graph I circled the two cases, in orange and turquoise, respectively:
Here’s a variant in which the 12-month average filter is also applied to temperatures, to avoid a possible temporal shift due to applying the 12-month average filter to only CO2. However, it still appears that peaks in CO2′ lead peaks in temperature at least as often as vice-versa:
https://woodfortrees.org/plot/esrl-co2/from:1979/mean:12/derivative/plot/uah6/from:1979/scale:0.5/offset:0.14/mean:12
I think the general correlation just illustrates the fact that sea surface temperatures, or at least ENSO variations, cause slight variations in atmospheric CO2 level, probably due to changing rates of oceanic CO2 uptake.
There’s also a strong correlation in the seasonal signals, but it depends on location. Of course, everyone knows that the seasonal cycle in temperatures depends on where they are measured, but some people don’t know that the “seasonal cycle” in CO2 levels also depends on where it is measured. Here’s a graph showing CO2 level at Mauna Loa and Cape Grim:

Note that the seasonal cycles at the two locations are 180 degrees out of phase, and very different in magnitude. Here’s a map, showing the locations of those two measurement sites:
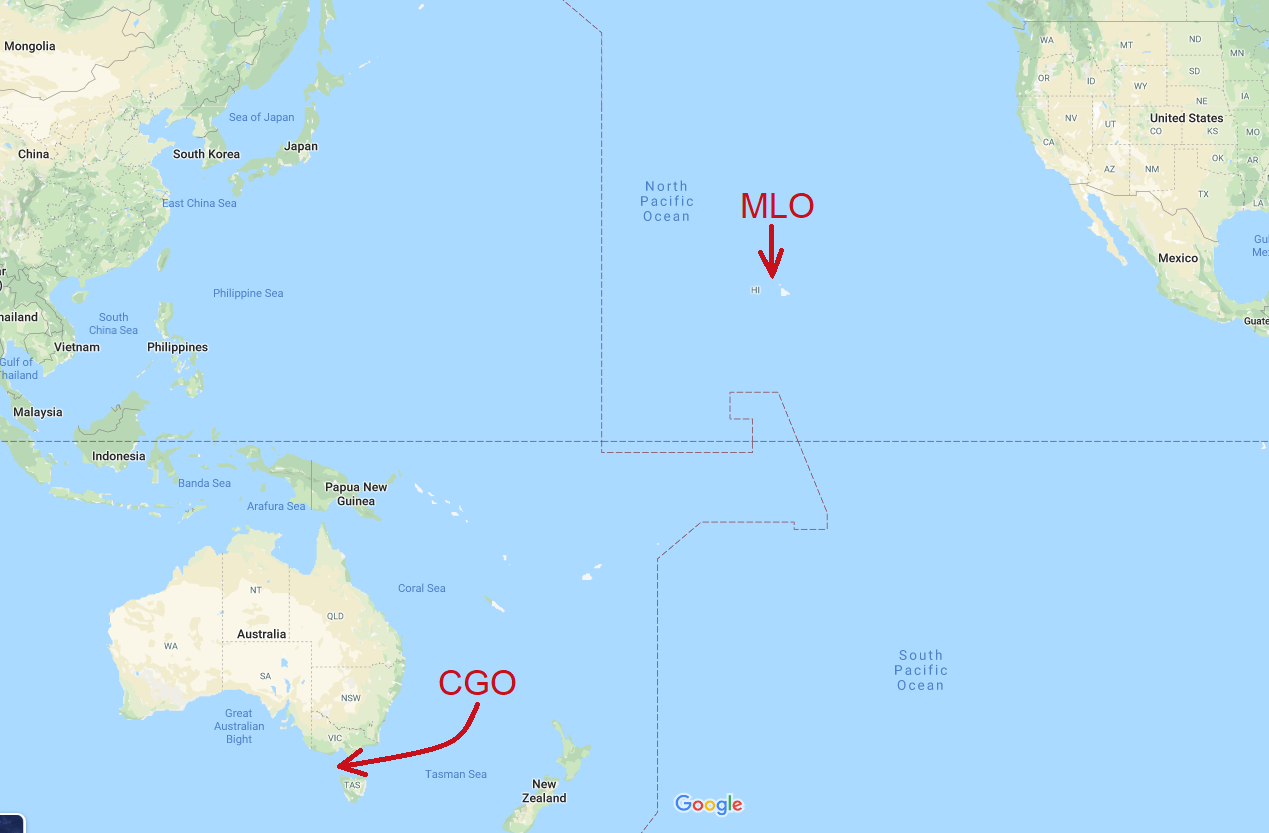
But that tells us nothing about causality. It simply means that the seasonal sunlight changes in each hemisphere drive the seasonal cycles in both CO2 level and temperature.
Furthermore, the seasonal correlation and the ENSO correlation are both unrelated to the long-term trend in CO2 level. Year-to-year, mankind adds about 5 ppmv of CO2 to the atmosphere, and nature removes about 2.5 ppmv of CO2 from the atmosphere. The cause of the annual increase in CO2 level (by about 2.5 ppmv) is simply the fact that the rate at which mankind adds CO2 exceeds the rate at which nature removes it.
Folks like Berry, Harde and Salby, who think nature is causing the ongoing increase in atmospheric CO2 level, are simply wrong. The sum of nature’s CO2 emissions and removals is a net removal of about 2.5 ppmv of CO2 from the atmosphere, per year. It goes without saying that removals of CO2 from the atmosphere do not increase the atmospheric CO2 level.
Dave:
I am rushed for time. As I stated:
In Jun2019 I demonstrated WHY atm. CO2 changes lag atm. Temperature changes by ~ 9 months here:
CO2, GLOBAL WARMING, CLIMATE AND ENERGY
by Allan M.R. MacRae, B.A.Sc., M.Eng., June 15, 2019
https://wattsupwiththat.com/2019/06/15/co2-global-warming-climate-and-energy-2/
Read the paper please – the ~9-month lag is explained there.
The woodfortrees plot I provided is the velocity dCO2/dt vs temperature – the integral “CO2 changes” lags its derivative by ~9 months.
It’s a bit more complicated but you can figure it out.
The article’s author Kip Hansen wrote:
“Don’t ask me to explain it, I don’t know. But it sure is interesting – even I thought the lockdowns would show up at Mauna Loa.
Dave you wrote:
“Folks like Berry, Harde and Salby, who think nature is causing the ongoing increase in atmospheric CO2 level, are simply wrong. The sum of nature’s CO2 emissions and removals is a net removal of about 2.5 ppmv of CO2 from the atmosphere, per year. It goes without saying that removals of CO2 from the atmosphere do not increase the atmospheric CO2 level.”
Dave, you are describing the “Mass Balance Argument”, which has been ably argued by Ferdinand Engelbeen (Mass Balance) and Richard S Courtney (Agnostic, mostly) on these pages and elsewhere for more than a decade. It is one of the longest games of ping pong in science. I am well familiar with it, and after more than a decade I still choose to be Agnostic.
Let’s assume that further detailed analysis concludes that the Covid-19 Lockdown-caused huge decline in fossil fuel combustion in the last few months resulted in NO decrease in atmospheric CO2 from its historic upward trend, as appears to be the case (see Kip H above). Does this suggest that the Mass Balance Argument is wrong, and Salby, Harde and Berry are correct? Is it time for them to declare victory and spike the ball in the end zone? It’s possible – we’ll see.
Last observations – the world is a big place, bigger than a test tube. We should not assume that it is all acting in equilibrium – it is not – it is dynamic. Physical and chemical reactions are occurring in different seasons, in the atmosphere, on land and in the sea, chasing equilibrium but never catching it. Atmospheric CO2 is not too high – it is in fact far too low – plants are typically CO2-starved. Think about what that could mean.
Allan ==> Not to butt in …but….”it is dynamic. ” Some might even say it is a “chaotic nonlinear dynamical system”. (Chaotic in the Chaos Theory sense – like the climate).
Allen wrote, “Dave, you are describing the “Mass Balance Argument”,
There is no “mass balance argument.” It is the mass balance proof.
● Nature’s net CO2 fluxes remove CO2 from the atmosphere, each year. That is a proven fact.
● Removing CO2 from the atmosphere does not raise the atmospheric CO2 level.
● QED.
Allen wrote, “It is one of the longest games of ping pong in science.”
It is not “in science” to contend that removing CO2 from the atmosphere can raise the level of CO2 in the atmosphere. It is merely confusion.
That it is, in some cases, remarkably obstinate confusion, does not make it less wrong.
Dave B
You are merely making an assertion, not stating a proof (or disproof).
Maybe if you SHOUT LOUDER and stamp your feet?
Remember, I am AGNOSTIC on this point, and have been for ~12 years or more.
I don’t have a horse in this race.
Spalding ==> The results of this unintended experiment will be whether or not the total CO2 concentration continues exactly (well, as exactly as in the recent past) as it has been doing or if it changes (gets less or more) due to the Covid slowdown.
Nothing is “proved” by assertion.
Hi Kip – always happy to hear from you – I enjoy your posts.
Re climate is a “chaotic nonlinear dynamical system” – so many big words. :-).
Yet within this “chaos” there are all these beautiful relationships.
Best, Allan
“CARBON DIOXIDE IS NOT THE PRIMARY CAUSE OF GLOBAL WARMING”,
By Allan MacRae, January 2008
icecap.us/images/uploads/CO2vsTMacRae.pdf
CO2, GLOBAL WARMING, CLIMATE AND ENERGY
by Allan M.R. MacRae, June 15, 2019
wattsupwiththat.com/2019/06/15/co2-global-warming-climate-and-energy-2/
Excel: wattsupwiththat.com/wp-content/uploads/2019/07/Rev_CO2-Global-Warming-Climate-and-Energy-June2019-FINAL.xlsx
1a. In 2008 I made the following major observations:
a. The velocity of changes of atmospheric CO2 [dCO2/dt] varies ~contemporaneously with changes in global temperature (Fig.1a).
b. Therefore the integral of dCO2/dt, changes in atmospheric CO2, lag changes in global atmospheric temperature by ~9 months (Fig.1b).
Later I was advised that Kuo et al (1990) made a similar observation to ‘b’, as did Keeling (1995), in papers published in Nature. Neither noted point ‘a’ above.
Kuo’s and Keeling’s findings have been carefully ignored for decades by the warmist camp – another “inconvenient truth”.
Fig.1a – The very close relationship of dCO2/dt vs global temperature is clearly apparent. Major volcanoes disrupt the relationship.
http://www.woodfortrees.org/plot/esrl-co2/from:1979/mean:12/derivative/plot/uah6/from:1979/scale:0.22/offset:0.14
5. UAH LT Global Temperatures can be predicted ~4 months in the future with just two parameters:
UAHLT (+4 months) = 0.2*Nino34Anomaly + 0.15 – 5*SatoGlobalAerosolOpticalDepth (Figs. 5a and 5b)
Note the suppression of air temperatures during and after the 1982-83 El Nino, due to two century-scale volcanoes El Chichon (1982) and Mount Pinatubo (1991+).
Much of the atmospheric warming from ~1982-1996 (blue trend) was a recovery from the two major volcanoes – Nino34 SST’s (purple trend) cooled slightly.
Note that Nino34 temperatures have cooled strongly in the past month – will we see a repeat of the failed 2019 harvest on the Great Plains again this year?
tropicaltidbits.com/analysis/ocean/nino34.png
6. The sequence is Nino34 Area SST warms, seawater evaporates, Tropical atmospheric humidity increases, Tropical atmospheric temperature warms, Global atmospheric temperature warms, atmospheric CO2 increases (Figs.6a and 6b).
Other factors such as fossil fuel combustion, deforestation, etc. may also cause significant increases in atmospheric CO2. However, global temperature drives CO2 much more than CO2 drives temperature.
7a. Why does the lag of atmospheric CO2 changes after temperature changes equal ~9 months?
In a perfect sine wave, the integral lags its derivative by pi/2, or 1/4 cycle.
There should therefore be approximately a (4 times 9 months = 36 months) 3 year average period in the data.
And there is – the inter-related datasets above show a ~3-year period, with the integral lagging its derivative by ~1/4 cycle.
Alan ==> I’ll give your paper a read. Thanks
Given IR absorption bands for CO2 are saturated, it does not matter!
No they are not saturared
Please show your evidence that they are not.
Stokes, NOT AGAIN? We are not falling for that totalizing sneaky trick. The claim is that the shape of the slope is not changing. NOT that the total is ‘different.”
Here, let me rephrase the quote you attempted to deny ….
This year, through April, THE SINE CURVE looks precisely like each of the previous four years.
Now I suggest you check out the graph I just posted.
” The claim is that the shape of the slope is not changing. NOT that the total is ‘different.””
If the difference can only displace the points by an invisible amount, then the shape of anything derived will not change. This requires no further explanation.
” It increases by a steady 2.5 ppm/year.”
No. It doesn’t.
In cool years like 1992, ( the year after Mt Pinatubo eruption) CO2 only rose by .46 ppm.
In warm years like 2016, CO2 rose by 3.0 ppm
The correlation is so good between temperature and change in CO2 you can tell if a year was warm or cool just by looking at the rate of change in CO2.
You can also tell if a year was warming or cooling by looking at wether the rate of change was increasing or decreasing..
NOAA publish annual change in CO2 here.
ftp://aftp.cmdl.noaa.gov/products/trends/co2/co2_gr_mlo.txt
The correlation between Temperature and the rate of CO2 change is very very good.
Compare the CO2 figures with the UAH lower troposphere temps here.
Since the world has been warming since the end of the little Ice Age we should expect the rate of CO2 rise to be increasing.
This year the UAH data is showing some cooling and if it continues we might expect the rise in CO2 this year to be less than in 2019.
I expect people will blame this reduction on the Covid19 driven economic downturn.
CO2 dependence on temperature causes CO2 to increase by a factor of a 55% increase from a 10 degree C increase of temperature if temperature variation by 10 degrees C during comings of ice age glaciations accounted for CO2 varying from 180 to 280 PPMV. That works out to a 4.5% increase from 1 degree C temperature increase. The variation is even less according to variation of solubility of CO2 in water from varying temperature according to Engineering Toolbox. C)2 went from 280 PPMV pre-industrial to a little over 213 PPMV last January, so I project the value for the year 2020 to be about 2020 because annual figures tend to be about the same as the January figures. Going from 280 to 413 PPMV is a 47.5 % increase, and the global temperature increase since pre-industrial times explains about a tenth of this.
Nick ==> Look at the Daily/Weekly — I give the link….
I have added the Daily/Weekly to the post for those who are too lazy to click the provided link.
OK, on that scale the difference would be 1 pixel, but the noise is vastly greater – no chance of seeing it.
Nick ==> What you are calling “the noise” is the actual measurement — the measured CO2 concentration. That is NOT noise — it is the thing being measured. On the scale of the Daily Weekly Graph, 2/10th of a ppm is clearly and easily discerned — the hash marks are .25 ppm. I’m not sure where you end up with a tenth of that amount. We are only concerned with the overall concentration — not the some unmeasured or calculated, assumed, or modeled anthropogenic portion.
The idea that the CO2 concentration measurements themselves are noise is what it wrong with this whole issue.
If reduced anthropogenic emissions of CO2 don;t change the totals, then we have learned something in our unintentional experiment.
Kip,
“the hash marks are .25 ppm. I’m not sure where you end up with a tenth of that amount.”
One weakness in your argument is that you say that the CV19 effect should be observable, without quantifying how much it reduced emissions. The relation between CV19 and emissions is not an atmospheric science issue. My understanding is that lockdowns reduced emissions globally by about 10%. So the 0.2 ppm increase that would have been expected in March is reduced to 0.18 ppm. It is that 0.02 ppm that you are trying to observe amidst the noise.
Nick ==> Since the lockdowns began, we should be seeing something….some reduction in increasing CO2. We have lockdowns beginning as early as mid_February, seriously affected months, March and April. The Daily/Weekly numbers should be showing something different than previous Marches and Aprils — but they do not.
None of the fiddling with the numbers, much of it assumed or derived through circular argument, makes any difference to that basic observational fact.
This post is only about that simple observed fact.
Not that this fact will become more apparent as the weeks go by and CO2 concentration continues to increase unabated and unchanged from the long-term pattern.
Kip,
“None of the fiddling with the numbers, much of it assumed or derived through circular argument, makes any difference to that basic observational fact.”
It isn’t an “observational fact” until you make some quantitative connections:
1. How much did emissions actually reduce as a result of the lockdowns?
2. How much difference in ppm would you expect to see as a result of that reduction (whatever it is)? It is an easy calculation based on conservation of mass.
Until you have dome that, you can’t claim to deduce anything from observation.
Nick ==> And I don’t claim to deduce anything — nor should anyone else — including your “any effect would be too small to see” even though the greater claims are that anthropogenic CO2 sources are causing anywhere from 100 to 200% of CO2 concentration increases.
If the “accidental experiment” of reducing anthropogenic CO2 emissions through de-industrialization (the Worldwide Lockdown) shows little or no effect (which is the case for the first two months of the experiment) then we have something to think about.
Right now, we just have the numerical measurements and our observation that they appear, so far, to be unchanged by the industrial slowdowns caused by the lockdowns.
Of course it is an observational fact — it is simply and nothing more than that — observing the ongoing measurements.
Quantitative connections are analysis and conjecture — not observation.
Seriously?
0.02 ppm/month = 0.0007 ppm/day = 0.00003 ppm/hour = 0.000005 ppm/minute = 0.00000008 ppm/second
At what point does it become absurd? ANSWER: 0.02 ppm
0.02 ppm/month=0.24 ppm/year=24 ppm/century.
But that is the 10% reduction due to CV, which of course won’t continue forever. The emissions will (unless …), and that is 240 ppm/century. Quite noticeable when we started at 280 ppm.
I think you are wrong there Nick. The 2.5 is the net increase. If human emission are down 10 %, that is from the gross human emissons of about 10 Gt, or similar to 5ppm.
10% of that is 0.5% annually, or approximately 0.04% monthly
About 50% of emissions remain in the air. It is reasonable to suppose that the same factor would apply to the reduction. It is possible there is a timing issue.
But even if one allows the entire reduction, it is still a very small change (now about 1 pixel).
No, as I see it, that is not reasonable.
The amount of carbon going from the atmosphere to plants and ocean depends on the excess amount of CO2 in the atmosphere, not the rate of emissions.
/Jan
The building La Nina into the NH winter 2020/2021 will certainly show up though in the MLO record.
The next few months will be interesting. As we enter the spring and summer months there is a decline in co2 because of plants growing in the northern hemisphere. Will the decline be as great as previous years?
CO2 reducing by plant-grow will be belated, because of the still existent snow masses above average in NH
I fetched the Mauna Loa daily dataset.
The image linked below demonstrates the raw sawtooth (gray line) overlayed with 7-day moving mean (red line) for the last four years, Feb/Mar/Apr only.
There’s no drama.
A case might be made for a tiny slump between 4/20 and 4/29 this year. It would be a pretty thin claim, compared to an 11% drop in human contribution. That’s my opinion.
However, others might be able to draw conclusions other than that. Have at it.
Thank you Wndlord for that useful year on year comparison. The most interesting observation for me, is the apparent stability shown this year compared with the recent past, particularly 2017.
Either new equipment is in place( or data program) that smooths out “spurious” variation or the sensors are detecting local variation rather than world wide well mixed atmospheric change.
Why is there such a visual difference between 2020 and 2017?
I just noticed that the x-axis is a little different on 2017. I’ll take a look at that and post two more years later today.
Looking deeper, I am claiming that no “ding”or wobble is visible in the measurement of CO2 concentration at Mauna Loa. Business as usual, despite an enormous 11% drop in human emissions.
Here is a graph comparison, 2014-2020:

the scale of the jpg is designed for visual comparison of the sine curves, not the numerical.
You can see the actual data in the next link …
Here is that graph and the underlying Excel Spreadsheet, with datapoints:
https://theearthintime.com/CO2-2014-2020.zip
Thank you for that!
Scissor, you are welcome.
Seriously, shouldn’t the CO2-danger-community admit this massive reduction in CO2 human release has to show up in even the tiniest ding at Mauna Loa? I mean, show me the damage.
At the very least, shouldn’t AOC-AlGore at least be nervous that a stoppage greater and faster than they hope for in all their dreams of repression of FF … lays an egg.
Winlord,
What link did you use to get daily data for April-May 2020?
Is it from NOAA or Scripps?
Can it be accessed by the public, people like me?
Geoff S
Geoff,
I’ve been graphing the daily CO2 concentration from Scripps with this as my latest, which compares dailies over the last seven years for the Feb/Mar/Apr time period:
I also linked a zip of my work, which includes the data points, here:
https://theearthintime.com/CO2-2014-2020.zip
You can get the data yourself here:
https://scrippsco2.ucsd.edu/data/atmospheric_co2/mlo.html
CO2- HOW DARE YOU defy Greta????
NO2 drops immediately, measurably, but CO2 isnt.
Even if you were to say that Mauna Loa measures a mixed atmosphere, rather than measuring directly the air above cities and industrial areas, as NO2 is, you would expect, that during spring, where there is a massive CO2 uptake by plants globally, and with mankind producing 30% less, at least, some signal.
Why? This is weird, very weird. Is the Carbon cycle so big, much bigger than thought, that man made CO2 just doesnt show up? Ie are there much bigger sources and sinks for CO2 that we just dont know about?
In a sane world these observations would result in immediate Public Inquiries from politicians the world over, into how they’ve been so duped by Big Green for so long.
Green Blob nonsense would be ditched and ‘renewables’ deservedly shown the door. But we don’t live in a sane world!
Expect a furious Green Blob pushback with multiple ‘rebuttals’ in very short order. It’s gonna be fun.
If the annual CO2 cycle is caused by plant growth, and NASA reports a 30% increase in greening, then we should see an increase in the amplitude of the Scripps sawtooth over the same period. Do we?
Yes we do. See here: https://scrippsco2.ucsd.edu/graphics_gallery/other_stations/global_stations_co2_concentration_trends.html
Blest if I can see a ~30% increase in amplitude (aka max-min) of the annual CO2 sawtooth.
Could you show me?
Sure. At PTB it was circa 310-324 ppmv min/max in 1960 and is now 400-418 (+29%). At LJO it was circa 309-317 and is now 404-416 (+50%). Of course these are just eye-balled and you would need to detrend them to get a more precise estimate.
Jim, thanks for the reply. For Mauna Loa, the one with the longest record, my eyeballs say a 7ppm swing in 1960, and a 7ppm swing in 2029.
I speculate that we might be looking at e.g. humidity rather than greening as an explanation. Given that the air samples are freeze-dried to -70 degC to remove any humidity before being read, a varying humidity in the original sample ought to show through in a varying result.
Incidentally Samoa has a pretty stable humidity, as does the South Pole, and both have a very low annual fluctuation. OTOH Point Barrow has a really big humidity swing, and a really big fluctuation.
If this speculation ‘holds water’ then the consequences for the Keeling Curve as evidence for AGW could be serious. Anybody interested in doing an analysis?
that 30% increase in greening wouldn’t be being observed in part by OCO-2 photosynthesis instrument would it?
– where photosynthesis is registered with an accurate CO2 measurement…..
My turn for a question. Every year at Mauna Loa, as shown in the 5 year plot included in the original post, the monthly growth of CO2 is lower for a month or so during the period from January to March. What is the cause of this? A clue, perhaps, is that it appears to be less pronounced during major El Niño years (which obviously would correlate with higher CO2 growth during such years).
Because Feb is 10% shorter than the other months?
Interesting idea, but in 2017 and 2018 the “low growth month” was January. Thanks for the suggestion though (especially as I had not thought of this!).
“Short February” is dwarfed by the fact that at Mauna Loa, there are missing days on a random basis every month. I discovered that when plotting the daily data last night. Some months 2-3 missing, some 5-6.
Link to spreadsheet showing this:
https://theearthintime.com/CO2-2014-2020.zip
Oops, my mistake! The years 2017 and 2018 are low growth because of the reduced difference between the monthly averages for Feb and Jan, and hence could be a result of less data in Feb. However, in 2019 and 2020, the low growth was between Feb and March, so it still does not work as an explanation.
Jim ==> I;ve already said “I don’t know”…. but I suspect that repeating little slowdown you mention is the Northern Hemisphere Spring event — the leafing out of all the trees and the growth of all things green sucking up CO2sub> in that brief mad burst. This, of course, is a uneducated guess.
Kip,
Thanks for the suggestion. The issue would then be, why does the growth rate “perk up” again through to the annual max in May when photosynthesis in the NH really kicks in (likely driven by the boreal forests). I think this could be a very important point in understanding the link between ENSO and atmospheric CO2 growth, given the AGW view that the increase in CO2 growth rate seen in major El Niño years is due to reduced CO2 removal of anthropogenic emissions by tropical vegetation because of drought – and without any material involvement of the oceans. Hard to believe!
Perhaps OCO-3 will help, though it doesn’t sound promising. Thanks very much for the update, Joel.
Jim ==> You may be misreading when the NH starts into Spring. It may well be an increase that starts in the Equatorial Band and sucks up CO2 starting there as the Sun passes directly overhead. Don’t know — but it is pretty consistent over the years — right in that same spot, give or take a month.
Kip,
Obviously photosynthesis starts earlier at lower latitudes, but the fact remains that the sharp drop in atmospheric CO2 occurs in May, both at Mauna Loa (MLO) and at Point Barrow (PTB), Alaska. The annual cycle is much larger at PTB than at MLO, which leads to the widely-accepted view that it is largely driven by far northern vegetation (supported by the δ13C data). The annual cycle even further north at Alert, Canada, shows virtually the same annual variation as PTB.
Of course, being “widely-accepted” doesn’t make it right, nor does it mean that I agree with it. The CO2 drop at MLO in late spring does seem out of line, but I suspect it is simply because it reflects what is happening at Barrow rather than its own latitude. In other words, the CO2 cycle at PTB dominates the northern hemisphere (NH) response. From May onwards, the MLO changes lag those at PTB, most noticeable where it generally shifts from decreasing to increasing in August at PTB and September at MLO. Such a relationship would also explain the overall NH diminishing size of the annual cycle from PTB southwards towards the equator.
Whether or not the annual cycle at PTB is driven by the terrestrial biosphere or by photosynthesis of phytoplankton (or a combination) would appear to be worthy of further investigation, especially as that seems to get going in May in the Arctic and the Iceland Sea (based on in situ pCO2 measurements). I can provide links if anyone is interested.
Jim ==> The point we were discussing is the little “stutter” seen in the Monthly Means graph about two-thirds of the way in the UP phase of each year.
Kip,
We were indeed. I tried to expand the discussion to include what else we see in the NH with regard to the effect of photosynthesis on atmospheric CO2, because I have difficulty assigning the “stutter” to this effect when CO2 continues to increase at Mauna Loa through until May. I tried to make that point previously, but I was not clear enough. I apologise.
Jim ==> No worries. This whole topic has been poisoned by the Climate Cabal, some representatives of which comment here.
I’m just trying to keep the thread constrained to the simple observation record. In the final analysis, and despite claims from some quarters, we know precious little about the true detailed causes of Atmo. CO2 fluxes.
With the drastic reduction in air traffic there should have been an equally large reduction in the number of contrails and contrail cirrus clouds in our skies. Has their been any discussion anywhere of possible effects on surface temperatures of such reductions today?
I have heard both of contrails (and also thinner cirrus clouds) cooling the world, and warming it (by absorbing thermal infrared and reradiating half of it downwards). There is more certainty that lower clouds have a net cooling effect.
iirc there were measurable changes in the clear skies after 9/11 … again iirc primarily in North America.
Go to http://www.retiredresearcher.wordpress.com for a detailed analysis.
Go to href=http://retiredresearcher.wordpress.com>Climate Changes for a detailed analysis.
Total Aviation is down 50+%
But it can’t have much effect.
The global aviation industry produces around 2% of all human-induced carbon dioxide (CO2) emissions. Aviation is responsible for 12% of CO2 emissions from all transports sources, compared to 74% from road transport.
Too many humans still breathing?
COVID is mother earth fighting back?
Covid-19 is killing off old comorbid people in nursing homes and hospitals.
And really not much of anyone else.
There is nothing special or unique or novel about Covid-19.
It’s just another run of the mill flu bug that found easy pickings in the too many, too old, too sick packed too close together.
NYC alone is responsible for 25% of the Covid-19 deaths.
The top ten states for deaths account for almost 80% of them.
Japan has a higher percentage, 27%, of 65+ than any other country and not even 1,000 deaths.
Somebody should go find out why.
https://www.cdc.gov/nchs/nvss/vsrr/covid19/index.htm
Hi Nick
There are lot of old people in the east part of the European Union, large percentage of young are employed on the long term bases in more industrialised and more prosperous countries of the EU, and yet death rate in the east is only fraction of that in the most of the west.
http://www.vukcevic.co.uk/EuropeCV.htm
as you say Somebody should go find out why.
Sounds like tailpipes and “smoke”stacks are a lot cleaner thasn one is led to believe.
Regarding: “Maybe, just maybe, anthropogenic emissions just don’t make that big of a contribution to the increase….Maybe abandoning fossil fuels and all the advantages of modern society isn’t a solution to rising CO2.”:
The current high level of CO2 was built up over decades. Dr. Roy Spencer worked out a natural removal rate that corresponds to a half-life of about 30 years, and a few years ago Willis Eschenbach worked out a natural removal rate that corresponds to a half-life of 41 years.
(To the extent natural removal of an injection (“pulse”) of CO2 into the atmosphere goes by exponential decay instead of a Bern model, and atmospheric concentration and emissions data can’t prove one over the other until there’s a sustained substantial departure of emissions from exponential growth great enough to cause the growth of the “atmospheric surplus” to deviate substantially (and for at least a few years) from exponential growth.)
A decrease of emissions by somewhat over 10% for a few months is not going to make a visible difference in a graph of the Keeling curve, perhaps a couple tenths of a PPMV, as expected by Dr. Roy Spencer.
Donald ==> You may be right — however if the Spencer/Willis calculations are circular (based on the graph itself to explain the graph….) then those bets are off.
We do not know how much CO2 we are adding to the atmosphere . . . we only have guesses, mostly based on the Keeling Curve with the assumption that any increase is due to anthropogenic emissions.
The point of this accidental experiment is that if we reduce our emissions by a discernible amount and Atmospheric CO2 Concentrations do not reduce by that discernible amount, then we know that something is amiss with the calculations we wewre depending upon.
The accidental experiment is not over, of course, but preliminary data is in . . . . we will be able to determine the results of the experiment over the next six months or so.
If CO2 concentration continues to rise in the same manner as before, despite our reductions in emissions, then our emissions are having precious little to do with it.
If CO2 rise reduces by 5 % — Spencer’s calculation — then we might have some evidence of how anthropogenic emissions add to whole atmosphere CO2 concentration (or how little.)
You get the circularity issue?
Spencer figures that a 43% decrease of emissions will cause atmospheric CO2 concentration to level off, +/- regular seasonal variations, irregularities in seasonal variations and year-to-year variations (such as from ENSO). He cites EIA expecting an 11% decrease of CO2 emissions, and I searched and found this is a US figure and not a global one. With industrial countries other than the US recovering more quickly than the US, the global figure for emissions decrease for 2020 would be less than 11%. An 11% decrease for a whole year would merely slow down CO2 growth by .6-.7 PPMV over a year, so the actual 2020 decrease of global CO2 emissions looks like it will accomplish less than that, a value comparable to year-to-year variations in the CO2 increase trend.
Donald ==> The guesses about anthro emissions notwithstanding, the “proof of the pudding”s whether or not reduction in human industrial activity slows the rise of Atmo. CO2.
We know that fossil fuels are going unburned — petroleum prices have gone negative and stockpiles are overflowing.
The CAGW stance is that in order to save the world, we must do what is currently being done — slowing industrial activity.
We will see, over the next six months or so, how much, if any, slowing industrial activity affects Atmo. CO2.
It is an experiment that we could not otherwise have done — and the results will tell us something.
I’ve already admitted I don’t know what it will tell us — we only have interesting but preliminary results so far.
Spencer/Willis are wrong. See Dr. Ed Berry’recent comment on his blog.
What is really interesting is this – what does it take to bring that number down? Shutting down most of Europe and the U.S. had basically no effect, thus, all the plans of climate change enthusiasts are pretty much moot – they won’t make any difference at all. We can’t do any more than what we just did. We shut down as much of our generation as is humanly possible, and it didn’t move the needle even a little bit. Whatever the reason it don’t change the numbers, the fact remains, shutting down our entire economy would still not be enough to affect any change whatsoever in carbon dioxide concentrations. If you say, well it is because China didn’t shut down, then fine. We don’t control China. If it was natural then fine, we don’t control nature. Either way it doesn’t matter.
President Trump just said he has been taking hydroxychloroquine for the last few weeks as a preventative for the Wuhan virus!
The reporters are Stunned!!!
Kip: No argument with your article, but I would point out that the MLO is — by intent — high in a mountain in the tropics. CO2 is “well-mixed”. Like O2,N2 and Ar (but not H2O) long-term, it tends to be much the same everywhere on the planet. But, it’s not clear how long it would take for changes in the gas mixture of the Northern Farrell Cell (the heavily populated/industrialized North Temperate Zone) to propagate to the Northern Hadley Cell where MLO is located. It’s possible that measurable changes are taking place, but that our key instrument won’t see them for a while.
… or not.
While looking to see if the Scripps Institute weekly flask measurements of CO2 at various latitudes might show anything (I didn’t find them quickly in an easy to read form), I came across a rather neat article
https://www.esrl.noaa.gov/gmd/ccgg/about/co2_measurements.html If it’s too long, just skip down to figure 5a. That, in itself, seems enough to suggest to me that some caution is in order when dealing with short term CO2 measurements.
Presumably, someone will come along in a few years and do a really detailed analysis of today’s MLO, Scripps, OCO-2 and OCO-3 data. My GUESS is that they will find a recognizable COVID-19 effect just as there is a very small blip in the early 1990s MLO data that is likely due to Mt Pinatubo (1991). But it will likely be small and not very informative.
Don K ==> It has long been known that near surface CO2 varies with the activity of the plants (and animals — such as above huge herds of beasts in Africa). The figure 5 graph is informative of this fact — oddly, not true every day — the last couple of days of the measuring shows little height difference.
“The “Build Back Better” movement.”
The problem with this concept is that nothing was removed that needs to be built again. They’re talking about replacing perfectly good infrastructure for no reason (well, their fairy tale reason, but nothing based in reality). Such a thing would cost, well, as much as the so-called GND, for no gain, and demonstrable loss.
You Citizen Scientists are not probing well enough.
Believe the CO2 in air measurements at your peril.
Repost from 15 March WUWT follows:
When you decide to investigate a process that involves measurement, two fundamental questions always need confident answers:
1. What is the limit of detection?
2. What is the total error envelope?
Those wanting to track daily atmospheric CO2 during this 2020 lockdown should be aware that there is next to no daily CO2 data available to the public apart from some from Mauna Loa. That the agreement between daily NOAA and Scripps measurements there indicates an error envelope of some +/- 0.5 ppm CO2 (1sigma) for 2020 so far. This helps dictate the detection limit, indicating some 1 ppm.
Looking for a change of 0.2 ppm, as some people are, is therefore not possible.
There is a determination from several research bodies away from Mauna Loa to not release daily CO2 data for 2020 to the public. If you do not believe this, ask them, as I did.
Summarising, the citizen scientist has next to no hope of contributing to the science because access to required data is being denied by several of its curators, or simply not updated by others.
Science policy at its worst. Geoff S
“Citizen Scientist”
Speaking for myself only, I prefer “Climate Realist” with the job description inferred:
“Member of the Rational peer group.”
One sign we are far more qualified to detect error and/or fallacious conclusion in certain closed-off tiny peer groups than those few within their own collective? When they afraid to show their data.
At the risk of spamming the thread, I think that the bee in my particular bonnet is worth a wide hearing:
As a citizen, I have long suspected the dependence on the Scripps process to justify the AGW conjecture. My suspicions have been confirmed by the annual amplitude of the ‘swing’ being ascribed to N. Hemisphere plant growth and decay. However, NASA claims a ~30% increase in the greening of the planet, but eyeballing the annual ‘swing’ since 1960, there seems to be no increase in amplitude. WUWT?
Given the Scripps process of freeze-drying the air samples, my own conjecture is that these measurements are affected by the variation in site humidity. And looking at e.g. Samoa and Point Barrow annual monthly humidity readings, it seems that the ‘sawtooth’ amplitude does indeed follow local humidity.
IF my conjecture holds any water (pardon the pun) then the Scripps process might at least partially be tracking local humidity. If so, then the AGW conjecture based on the Keeling Curve could be in trouble.
Any comments, including refutations would be most welcome (as it would help me move on to a new ‘buzz’)
Interesting. Glad someone else checked. I looked for websites under several combinations of Google search string:
“world co2 monitoring stations, graph”, and “northern hemisphere CO2 monitoring stations, graphs”,
“Co2 monitoring stations combined, graph,” etc…
All roads lead to Mauna Loa, which is one of the four observatories in the “Global Monitoring Laboratory” network.
https://www.esrl.noaa.gov/gmd/ccgg/about.html
One of the pages at that website is devoted to the Global Greenhouse Gas Reference Network”.
Along with the line of Pacific observatories – at Barrow, Mauna Loa, American Samoa, and Antarctica, which are all about 150 degrees W longitude – they monitor from “Aircraft”, “Surface Continuous”, “Tower”, and “Surfact Discrete”, at various locations, all noted on the map linked above.
I checked for data or compilations of world data at the Boulder monitoring station. It says all their current and historical readings were “ongoing”.
Anyway, a simpleton’s-eye-view of CO2’s values, judging from what’s available at Mauna Loa is as follows, in ppm:
2017-’18 – 401-410, for a gain of 9ppm
2018-’19 – 403-411, for a gain of 8ppm
2019-’20 – 405-415, for a gain of 10ppm
2020—– 408-416, for a gain of 8ppm
For someone more energetic, an average seasonal gain over last several decades would be useful.
Best.
In 2020, May is not yet over, and May is normally the peak month.
On average from 1958 through 2019, in each year May of a year was 3 PPMV above that year’s average and Sep-Oct of a year were about 3.2 PPMV below that year’s average, according to my eyeballing of the inset graph in https://upload.wikimedia.org/wikipedia/commons/c/c5/Mauna_Loa_CO2_monthly_mean_concentration.svg
This would mean a rise of 6.2 PPMV and a drop of 6.2 PPMV repeating annually on average if CO2 did not have an increasing trend.
From January 2015 to January 2020 Mauna Loa CO2 increased from 399.98 to 413.39 PPMV, which is .2235 per month. I figure that’s slightly less than 1.8 PPMV to add to 6.2 PPMV or a total of slightly under 8 PPMV average increase from September to May, and slightly less than .9 PPMV to subtract from 6.2 PPMV for a total of slightly over 5.3 PPMV average decrease from May to September. (Assuming the average seasonal variation in the past few years is unchanged from the 1958-2019 average seasonal variation, and from January 2015 to January 2020 is representative of the increasing trend in recent years.)
Repeating for January 1959 (315.62 PPMV) to January 2020 (413.39 PPMV) which works out to .1987 PPMV per month, this means average Septermber-May increase of slightly less than 7.8 PPMV and average May-September decrease of slightly more than 5.4 PPMV.
I tried answering this with my math work and did not see indication of my post making it to moderation, maybe I missed something. Trying again more briefly: I figure on average using average monthly deviations from annual values and the gain rate from January 1959 to January 2020, an increase of slightly under 7.8 PPMV on average from September to May, and a decrease of slightly over 5.4 PPMV from May to September.
Using the same average average monthly deviations from annual values and the gain rate from January 2015 to January 2020, I figure average increase from September to May of slightly under 8 PPMV, and average decrease of slightly over 5.3 PPMV from May to September.
I note a BBC story from 3 hours ago https://www.bbc.com/news/science-environment-52724821 under the headline “Climate change: Scientists fear car surge will see CO2 rebound” shows graphs that (without careful reading) appear to report on measurements showing CO2 levels falling. The article uses phrases such as “the fall off in carbon” and “the rebound, especially on the roads, could see a carbon surge.”
A careful reading reveals that the graphs are created from models, and purport to show rates of emissions of CO2, rather than measured levels of CO2.
boffin ==> The “data” is from the Global Carbon Project — an advocacy group pushing Net Zero scheme. They are guessing, like everyone else. The pudding tasting is Atmospheric CO2 Totals — and that is a lagging stat — we’ll know more in six to nine months.
CO2 Data Source:
Scripps has daily records for measurements for all of its related sampling stations, available from links at this page: Atmospheric CO2 Data – Sampling Station Records .
Note that there are a lot of missing data points in the .csv files, but they are extensive and might be useful to anyone with a deep interest.
Detailed analysis href=http://retiredresearcher.wordpress.com/a>
Detailed analysis