Reposted from Dr. Judith Curry’s Climate Etc.
Posted on May 10, 2020 by niclewis
By Nic Lewis
Introduction
A study published in March by the COVID-19 Response Team from Imperial College (Ferguson20[1]) appears to have been largely responsible for driving government actions in the UK and, to a fair extent, in the US and some other countries. Until that report came out, the strategy of the UK government, at least, seems to have been to rely on the build up of ‘herd immunity’ to slow the growth of the epidemic and eventually cause it to peter out.
The ‘herd immunity threshold’ (HIT) can be estimated from the basic reproduction rate of the epidemic, R0 – a measure of how many people, on average, each infected individual infects. Standard simple compartmental models of epidemic growth imply that the HIT equals {1 – 1/R0}. Once the HIT is passed, the rate of new infections starts to decline, which should ensure that health systems will not thereafter be overwhelmed and makes it more practicable to take steps to eliminate the disease.
However, the Ferguson20 report estimated that relying on herd immunity would result in 81% of the UK and US populations becoming infected during the epidemic, mainly over a two-month period, based on an R0 estimate of 2.4. These figures imply that the HIT is between 50% and 60%.[2] Their report implied that health systems would be overwhelmed, resulting in far more deaths. It claimed that only draconian government interventions could prevent this occurring. Such interventions were rapidly implemented in the UK, in most states of the US, and in various other countries, via highly disruptive and restrictive enforced ‘lockdowns’.
A notable exception was Sweden, which has continued to pursue a herd immunity-based strategy, relying on relatively modest social distancing policies. The Imperial College team estimated that, after those policies were introduced in mid-March, R0 in Sweden was 2.5, with only a 2.5% probability that it was under 1.5.[3] The rapid spread of COVID-19 in the country in the second half of March suggests that R0 is unlikely to have been significantly under 2.0.[4]
Very sensibly, the Swedish public health authority has surveyed the prevalence of antibodies to the SARS-COV-2 virus in Stockholm County, the earliest in Sweden hit by COVID-19. They thereby estimated that 17% of the population would have been infected by 11 April, rising to 25% by 1 May 2020.[5] Yet recorded new cases had stopped increasing by 11 April (Figure 1), as had net hospital admissions,[6] and both measures have fallen significantly since. That pattern indicates that the HIT had been reached by 11April, at which point only 17% of the population appear to have been infected.
How can it be true that the HIT has been reached in Stockholm County with only about 17% of the population having been infected, while an R0 of 2.0 is normally taken to imply a HIT of 50%?
The importance of population inhomogeneity
A recent paper (Gomes et al.[7]) provides the answer. It shows that variation between individuals in their susceptibility to infection and their propensity to infect others can cause the HIT to be much lower than it is in a homogeneous population. Standard simple compartmental epidemic models take no account of such variability. And the model used in the Ferguson20 study, while much more complex, appears only to take into account inhomogeneity arising from a very limited set of factors – notably geographic separation from other individuals and household size – with only a modest resulting impact on the growth of the epidemic.[8] Using a compartmental model modified to take such variability into account, with co-variability between susceptibility and infectivity arguably handled in a more realistic way than by Gomes et al., I confirm their finding that the HIT is indeed reached at a much lower level than when the population is homogeneous. That would explain why the HIT appears to have been passed in Stockholm by mid April. The same seems likely to be the case in other major cities and regions that have been badly affected by COVID-19.
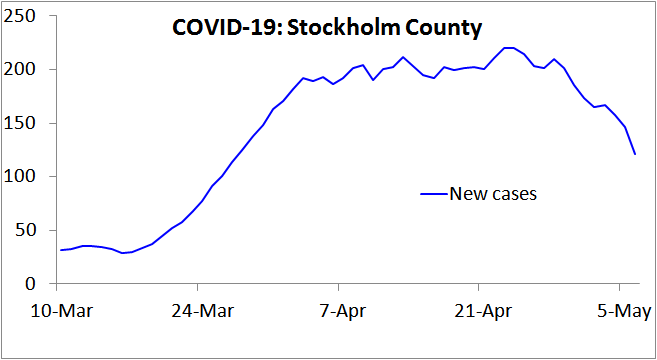
Figure 1. New COVID-19 cases reported in Stockholm County, Sweden, over the 7 days up to the date shown. Note that in Sweden testing for COVID-19 infection was narrowed on 12 March, to focus on people needing hospital care, so from then on only a tiny proportion of infections were recorded as cases. This would account for the lack of growth in cases during the first week plotted. Since hospitalisation usually occurs several days after symptom onset, this change also increases the lag between infection and recording as a case. Accordingly, from mid- March on the 7-day trailing average new cases figure will reflect new infections that on average occurred approximately two weeks earlier.
The epidemiological model used
Like Gomes et al., I use a simple ‘SEIR’ epidemiological model,[9] in which the population is divided into four compartments: Susceptible (uninfected), Exposed (latent: infected but not yet infectious), Infectious (typically when diseased), and Recovered (and thus immune and harmless). This is shown in Figure 2. In reality, the Recovered compartment includes people who instead die, which has the same effect on the model dynamics. The entire population starts in the Susceptible compartment, save for a tiny proportion that are transferred to the Infectious compartment to seed the epidemic. The seed infectious individuals infect Susceptible individuals, who move to the Exposed compartment. Exposed individuals gradually transfer to the Infectious compartment, on average remaining as Exposed for the chosen latent period. Infectious individuals in turn gradually transfer to the Recovered compartment, on average remaining as Infectious for the selected infectious period.

Figure 2. SEIR compartment epidemiological model diagram.
In the case of COVID-19, the diseased (symptomatic) stage is typically reached about 5 days after infection, but an infected individual starts to become infectious about 2 days earlier. I therefore set the average latent period as 3 days.[10]
The infectious period depends mainly on the delay between infectiousness and symptoms appearing and on how quickly an individual reduces contacts with others once they become symptomatic, as well as on how infectious asymptomatic cases are. In an SEIR model, the infective period can be derived by subtracting the latent period from the generation time – the mean interval between the original infection of a person and the infections that they then cause.
The Ferguson20 model assumed a generation time of 6.5 days, slightly lower than a subsequent estimate of 7.5 days.[11] I use 7 days, which is consistent with growth rates near the start of COVID-19 outbreaks.[12] The infectious period is therefore 4 (=7 − 3) days.
I set R0=2.4, the same value Ferguson20 use. On average, while an individual is in the Infectious compartment, the number of Susceptible individuals they infect is R0 × {the proportion of the population that remains in the Susceptible compartment}.
With these settings, the progression of a COVID-19 epidemic projected by a standard SEIR model, in which all individuals have identical characteristics, is as shown in Figure 3. The HIT is reached once 58% of the population has been infected, and ultimately 88% of the population become infected.
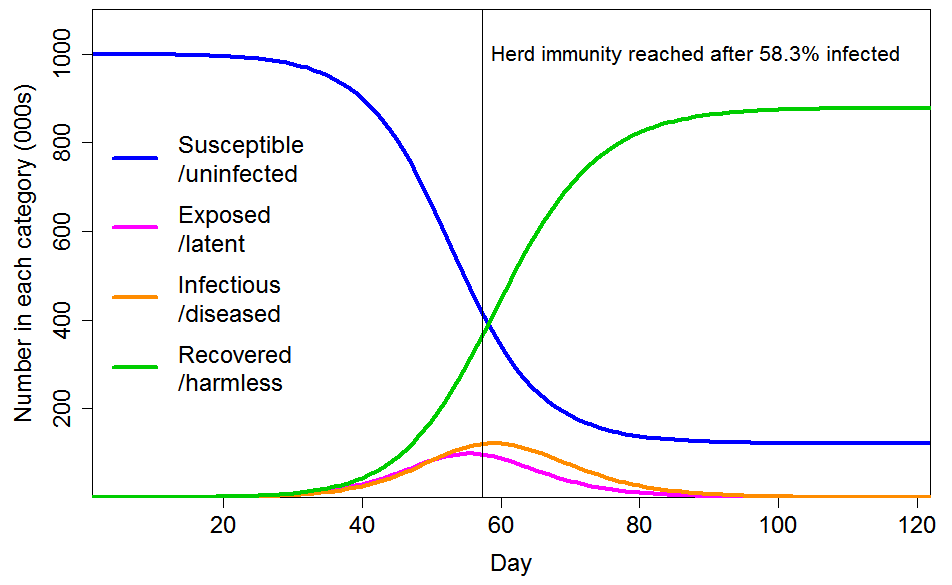
Figure 3. Epidemic progression in an SEIR model with R0=2.4 and a homogeneous population. The time to reach the herd immunity threshold, which depends on the strength of the seeding at time zero, is arbitrary.
Modifying the basic SEIR model for variability in individual susceptibility and infectivity
The great bulk of COVID-19 transmission is thought to occur directly from symptomatic and pre-symptomatic infected individuals, with little transmission from asymptomatic cases or from the environment.[13] There is strong evidence that a small proportion of individuals account for most infections – the ‘superspreaders’.
A good measure of the dispersion of transmission – the extent to which infection happens through many spreaders or just a few – is the coefficient of variation (CV).[14] Two different estimates of this figure have been published for COVID-19. A Shenzhen-based study[15] estimated that 8.9% of cases were responsible for 80% of total infections, while a multi-country study[16] estimated that 10% were so responsible. In both cases a gamma probability distribution was assumed, as is standard for this purpose. The corresponding CV best estimates and 95% uncertainty ranges are 3.3 (3.0–5.6) and 3.1 (2.2–5.0). These figures are slightly higher than the 2.5 estimated for the 2003 epidemic of SARS.[17]
CV estimates indicate the probability of transmission of an infection. They reflect population inhomogeneity regarding individuals’ differing tendency to infect others, but it is unclear to what extent they also reflect susceptibility differences between individuals. However, since COVID-19 transmission is very largely person-to-person, much of the inhomogeneity in transmission rates will reflect how socially connected individuals are, and how close and prolonged their interactions with other individuals are. As these factors affect the probability of transmission both from and to an individual, as well as causing variation in an individual’s infectivity they should cause the same variation in their susceptibility to infection.
A common social connectivity related factor implies that an individual’s susceptibility and infectivity are positively correlated, and it is not unreasonable to assume a quite strong correlation. However, it seems unrealistic to assume, as Gomes et al. do in one case, that an individual’s infectivity is directly proportional to their personal susceptibility. (In the other case that they model, they assume that an individual’s infectivity is unrelated to their susceptibility.)
Some of the variability in the likelihood of someone infecting a susceptible individual during an interaction will undoubtedly be unrelated to social connectivity, for example the size of their viral load. Likewise, susceptibility will vary with the strength of an individual’s immune system as well as with their social connectivity. I use unit-median lognormal distributions to reflect such social-connectivity unrelated variability in infectivity and susceptibility. Their standard deviations determine the strength of the factor they represent. I model an individual’s overall infectivity as the product of their common social-connectivity related factor and their unrelated infectivity-specific factor, and calculate their overall susceptibility in a corresponding manner.[18]
I consider the cases of CV=1 and CV=2 for the common social connectivity factor that causes inhomogeneity in both susceptibility and infectivity. For unrelated lognormally-distributed inhomogeneity in susceptibility I take standard deviations of either 0.4 or 0.8, corresponding to a CV of 0.417 or 0.947 respectively. Where their gamma-distributed common factor inhomogeneity is set at 1, the resulting total inhomogeneity in susceptibility is respectively 1.17 or 1.65 when the lower or higher unrelated inhomogeneity standard deviations respectively are used; where set at 2 the resulting total inhomogeneity in susceptibility is respectively 2.17 or 2.98. The magnitude of variability in individuals’ social-connectivity unrelated infectivity-specific inhomogeneity factor does not affect the progression of an epidemic or the HIT, so for simplicity I ignore it here.[19]
Results
Figure 4 shows the progression of a COVID-19 epidemic in the case of CV=1 for the common social connectivity factor inhomogeneity, with unrelated inhomogeneity in susceptibility having a standard deviation of 0.4. The HIT is 60% lower than for a homogeneous population, at 23.6% rather than 58.3% of the population. And 43% rather than 88% of the population ultimately becomes infected. If the standard deviation of unrelated inhomogeneity in susceptibility is increased to 0.8, the HIT becomes 18.9%, and 35% of the population are ultimately infected.

Figure 4. Epidemic progression in an SEIR model with R0=2.4 and a population with CV=1 common factor inhomogeneity in susceptibility and infectivity and also unrelated multiplicative inhomogeneity in susceptibility with a standard deviation of 0.4.
Figure 5 shows the progression of a COVID-19 epidemic in the case of CV=2 for the common social connectivity factor inhomogeneity, with unrelated inhomogeneity in susceptibility having a standard deviation of 0.8. The HIT is only 6.9% of the population, and only 14% of the population ultimately becoming infected. If the standard deviation of unrelated inhomogeneity in susceptibility is reduced to 0.4, those figures become respectively 8.6% and 17%.
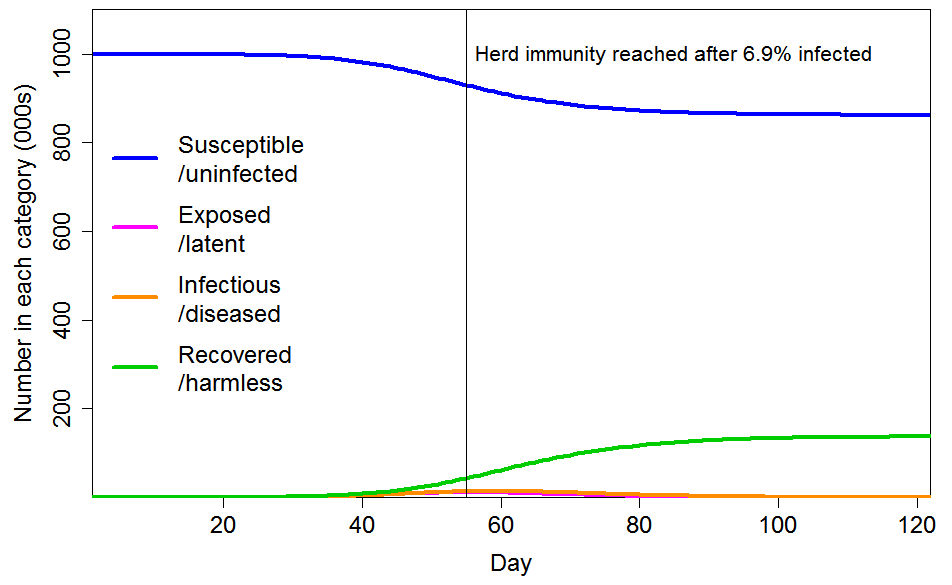
Figure 5. Epidemic progression in an SEIR model with R0=2.4 and a population with CV=2 common factor inhomogeneity in susceptibility and infectivity and also unrelated multiplicative inhomogeneity in susceptibility with a standard deviation of 0.8.
Conclusions
Incorporating, in a reasonable manner, inhomogeneity in susceptibility and infectivity in a standard SEIR epidemiological model, rather than assuming a homogeneous population, causes a very major reduction in the herd immunity threshold, and also in the ultimate infection level if the epidemic thereafter follows an unconstrained path. Therefore, the number of fatalities involved in achieving herd immunity is much lower than it would otherwise be.
In my view, the true herd immunity threshold probably lies somewhere between the 7% and 24% implied by the cases illustrated in Figures 4 and 5. If it were around 17%, which evidence from Stockholm County suggests the resulting fatalities from infections prior to the HIT being reached should be a very low proportion of the population. The Stockholm infection fatality rate appears to be approximately 0.4%,[20] considerably lower than per the Verity et al.[21] estimates used in Ferguson20, with a fatality rate of under 0.1% from infections until the HIT was reached. The fatality rate to reach the HIT in less densely populated areas should be lower, because R0 is positively related to population density.[22] Accordingly, total fatalities should be well under 0.1% of the population by the time herd immunity is achieved. Although there would be subsequent further fatalities, as the epidemic shrinks it should be increasingly practicable to hasten its end by using testing and contact tracing to prevent infections spreading, and thus substantially reduce the number of further fatalities below those projected by the SEIR model in a totally unmitigated scenario.
Nicholas Lewis 10 May 2020
[1] Neil M Ferguson et al., Impact of non-pharmaceutical interventions (NPIs) to reduce COVID-19 mortality and healthcare demand. Imperial College COVID-19 Response Team Report 9, 16 March 2020, https://spiral.imperial.ac.uk:8443/handle/10044/1/77482
[2] A final infection rate of 81% implies, in the context of a simple compartmental model with a fixed, homogeneous population, that the ‘effective R0‘ is between 2.0 and 2.1, and that the HIT is slightly over 50%. Ferguson20 use a more complex model, so it is not surprising that the implied effective R0 differs slightly from the basic 2.4 value that Ferguson20 state they assume.
[3] Flaxman, S. et al., Estimating the number of infections and the impact of non-pharmaceutical interventions on COVID-19 in 11 European countries. Imperial College COVID-19 Response Team Report 13, 30 March 2020, https://www.imperial.ac.uk/mrc-global-infectious-disease-analysis/covid-19/report-13-europe-npi-impact/
[4] Based on the Ferguson20 estimate of a mean generation time of 6.5 days, which appears to be in line with existing evidence, an R0 of 2.0 would result in a daily growth rate of 2.0^(1/6.5)= 11%. That is slightly lower than the peak growth rate in cases in late March in Stockholm County, and in early April in the two regions with the next highest number of cases, in both of which the epidemic took off slightly later than in Stockholm, and in line with the growth rate in Swedish COVID-19 deaths in early April
[5] https://www.folkhalsomyndigheten.se/contentassets/2da059f90b90458d8454a04955d1697f/skattning-peakdag-antal-infekterade-covid-19-utbrottet-stockholms-lan-februari-april-2020.pdf
[6] John Burn-Murdoch, Financial Times Research, 2 May 2020. http://web.archive.org/web/20200507075628/https:/twitter.com/jburnmurdoch/status/1256712090028576768
[7] Gomes, M. G. M., et al. Individual variation in susceptibility or exposure to SARS-CoV-2 lowers the herd immunity threshold. medRxiv 2 May 2020. https://www.medrxiv.org/content/10.1101/2020.04.27.20081893v1
[8] The 81% proportion of the population that Ferguson20 estimated would eventually become infected is only slightly lower than the 88% level implied by their R0 estimate of 2.4 in the case of a homogeneous population.
[9] https://en.wikipedia.org/wiki/Compartmental_models_in_epidemiology#The_SEIR_model
[10] Gomes et al. instead set the latent period slightly longer, to 4 days and treated it as a partly infectious period, unlike in the standard SEIR model.
[11] Li Q, Guan X, Wu P, et al.: Early Transmission Dynamics in Wuhan, China, of Novel Coronavirus-Infected Pneumonia. N Engl J Med. 2020; 382(13):1199–1207.https://www.nejm.org/doi/10.1056/NEJMoa2001316
[12] Once a SEIR model has passed its start up phase, and while a negligible proportion susceptible individuals have been infected, the epidemic daily growth factor is R0^(1/generation time), or 1.10–1.13 for R0=2.0–2.4 if the generation time is 7 days.
[13] L. Ferretti et al., Science 10.1126/science.abb6936 (2020).
[14] The coefficient of variation is the ratio of the standard deviation to the mean of its probability distribution. It is usual to assume a gamma distribution for infectivity, the shape parameter of which equals 1/CV2.
[15] Bi, Qifang, et al. “Epidemiology and transmission of COVID-19 in 391 cases and 1286 of their close contacts in Shenzhen, China: a retrospective cohort study.” The Lancet Infectious Diseases 27 April 2020. https://doi.org/10.1016/S1473-3099(20)30287-5
[16] Endo, Akira, et al. “Estimating the overdispersion in COVID-19 transmission using outbreak sizes outside China.” Wellcome Open Research 5.67 (2020): 67. https://wellcomeopenresearch.org/articles/5-67
[17] Lloyd-Smith, J O et al. “Superspreading and the effect of individual variation on disease emergence.” Nature 438.7066 (2005): 355-359. https://www.nature.com/articles/nature04153
[18] For computational efficiency, I divide the population into 10,000 equal sized segments with their common social connectivity factor increasing according to its assumed probability distribution, and allocate each population segment values for unrelated variability in susceptibility and infectivity randomly, according to their respective probability distributions.
[19] A highly susceptible but averagely infectious person is more likely to be removed from the susceptible pool early in an epidemic, reducing the average susceptibility of the pool. However, no such selective removal occurs for a highly infectious person of averagely susceptibility. Therefore, as Gomes et al. point out, variability in susceptibility lowers the HIT, but variability in infectivity does not do so except to the extent that it is correlated with variability in susceptibility.
[20] On 8 May 2020 reported total COVID-19 deaths in Stockholm County were 1,660, which is 0.40% of the estimated 413,000 of its population who had been infected by 11 April 2020. COVID-19 deaths reported for Stockholm County after 8 May that relate to infections by 11 April 2020 are likely to be approximately balanced by deaths reported by 8 May 2020 that related to post 11 April 2020 infections.
[21] Verity R, Okell LC, Dorigatti I, et al. Estimates of the severity of COVID-19 disease. medRxiv 13 March 2020; https://www.medrxiv.org/content/10.1101/2020.03.09.20033357v1.
[22] Similarly, the HIT may be significantly higher in areas that are very densely populated, have much less inhomogenous populations and/or are repeatedly reseeded from other areas. That would account for the high prevalence of COVID-19 infection that has been found in, for instance, some prisons and residential institutions or in city districts.
Originally posted here, where a pdf copy is also available
I’m confused, how does this testing method tell us anything about community prevalence?
How do we not know that there are more ‘exposed’ out there in the herd?
This confuses me a little too, since the focus on testing only people needing hospital care is one of the aspects of the UK plan that has been massively criticised, and which has essentially forced the government into massively expanding testing in other areas.
I am confused too!
I took the equation and started adding variables for all the factors that may affect the detection rate, factors like cost of crude oil falling so people could afford to travel further, ageing population, publicity campaigns, availability of tests, youtube video of to Californian ER doctors appears, then removed, Boris goes to to Hospital publicity, etc etc and I fell off the end of the desk!
Another Covid statistic according to the recording criteria.
https://www.cdc.gov/nchs/data/nvss/coronavirus/Alert-2-New-ICD-code-introduced-for-COVID-19-deaths.pdf
Damn another variable affecting the statistics!
The math is too complicated for me, but the principle is fairly simple:
A small percentage of people are highly susceptible to infection and then, once sick, are either average or high in their contagiousness. These people will get sick more easily and then cause a disproportionate number of cases, ie, more cases will come from them than from other people.
Yet these same people, by tending to catch the virus early, will also become immune early, and will drop out of the vulnerable population early.
As they drop out, the R0, or rate of new infections per established case, will drop…by definition the remaining population has grown, on avg, less susceptible. The epidemic spread will slow.
How important this is would depend on how disproportionately susceptible this super-susceptible group is.
I doubt the numbers are predictable from first principles. Instead one must work empirically, counting cases, especially the rate of new cases divided by the rate of testing. Further, one must know if the rules for getting tested are changed (eg, from symptomatic-only to anyone who has been in contact with a case, or on to random population screening.)
Case rates per test will naturally be higher if tests are only given to confirm a clinically diagnosed case of covid-19. Case rates will naturally be lower if teats are given throughout an asymptomatic population.
Then, numbers in hand, one might generate models (oh, god, not that….I know…) imputing various patterns of susceptibility until finding a good fit. Then try predicting new cases and test the models thereby (the thing the climate-disasterists never seem to do!)
What is the point of testing for the virus when there is no treatment? We almost never test for respiratory viruses – which is why we don’t actually know the number of people who dire from ‘flu each year. Testing for the virus in non-symptomatic people will simply raise the “case” numbers irrespective of the actual number of sick people – witness the ever increasing number of “cases” while at the same time hospitalizations are falling. PCR-based tests for viral RNA are really very simple and it is easy for a government to look like they are doing something by rolling out massive testing programs, when these are actually counter-productive to policy setting.
Random serological testing, on the other hand, will show the percentage of the population who have been exposed and are probably now immune. This is a tool for public health authorities to use to determine what measures are needed to control further serious infection levels.
This, 100%.
PCR testing might even make sense at the start of an outbreak, along with an aggressive contact tracing. But once the outbreak is widespread, who really cares how many people have a living virus in their system? The more important thing is to determine how many people HAVE had it (through random serological testing) so you can understand how far along we are towards herd immunity, and hence the true public risk.
This appears to be too complex of a concept for the media to grasp, since they’re always barfing up the pointless “positive cases” data — which is really a proxy for # of tests performed. If they were even remotely concerned about giving useful information, they’d AT LEAST regularly report how many tests they conducted vs. test positive so the average layperson can at least track some simple numbers and draw their own conclusions.
For what it’s worth, the province of British Columbia, Canada (population 5 million) has been doing an admirable job of tracking relevant data. The province is just north of Washington State, and the data shows the infection likely peaked around first or second week of March.
Figure 2 (page 2) shows symptom onset peaking around March 18th, so peak infection would have been about a week prior to that:
http://www.bccdc.ca/Health-Info-Site/Documents/BC_Surveillance_Summary_May_8_2020_Final.pdf
Vancouver has 120+ weekly arriving flights from China. They also hosted 100,000 people for the Rugby 7’s tournament March 7 & 8, so it makes perfect sense.
SteveB you are exactly right, I went over this a few days ago with my wife after skimming a article in the paper asking for more testing. The idiot author did not know the amount of testing is as you say does not matter. It what the test tell you as a percent of those positive in a random sample. Does not mater if that sample is a thousand or ten thousand as long as it random. So if you test a thousand randomly one week and ten have COVID you, you know 1 percent infection if 20 have it the next week from a random sample you know it increasing in your sample area, if the count goes down it decreasing. None or that is being done so all we have is a pile of worthless numbers the intellectually challenged cling onto. To bad most of our media and political class fit into the intellectually challenged group.
What happens when people who have been infected have no antibodies because they had an extremely low viral load? How does that screw up the projections? And these antibodies are known to fade quite quickly. Immunity could be lost in a matter or months. How does that screw up projections?
The Province of Ontario (Canada) produces a daily report similar to British Columbia’s. Based on the matching chart, the symptom onset peaked in Ontario around April 15. (Figure 2, page 4.)
https://files.ontario.ca/moh-covid-19-report-en-2020-05-11.pdf
Also of note in that same report is Figure 3, page 5, that shows “Number of COVID-19 tests completed and percent positivity.” The number of tests is trending upwards and the percent positive is trending downwards. Interpret that as you will.
As for the local media, they always report the daily increase in the number of deaths and positive tests, but never report the number of cases resolved (recovered). Again, interpret that as you will. 😉
They also don’t report that testing rates went up dramatically in April, only that the number of confirmed infections went up. Quite misleading. Nate Silver at his 538 publicly called out the media out last week on this biased reporting of telling lies by omission.
@PaulH
Thanks for sharing. Eyeballing the Figure 2 graph in your link, peak infection in Ontario would have been NO LATER THAN about a week prior to symptom onset, so roughly April 7-8.
Of course, this picture is somewhat skewed by the fact that testing didn’t really get going in Ontario until the second week of March. So we have no idea if the peak was much earlier and already “coming down” as the testing was ramping up.
Like you, I’ve also been watching % positivity very closely. It’s not always easy to interpret, since it’s highly dependent on arbitrary testing practices (BC’s footnotes indicate when they’ve shifted their focus, which is very helpful in untangling the spikes and drops).
A couple of observations. Coronavirus presence as a % of total tests (performed chiefly on those with influenze-like-infections (ILI)) in these 2 provinces has not exceeded 10%. And also, studies in the past have shown that the coronavirus family, as a percentage of total virus presence in a population of ILI infected, ranged from roughly 5%-15% annually.
That means:
1. The current SARS-CoVid2 variant is present in percentages that are within the normal historic range, and;
2. Over 90% of the remaining ILI cases in our society are being caused by some combination of rhinovirus, influenza virus, enterovirus, respiratory syncytial virus, metapneumovirus virus and parainfluenza
To echo your words: “Interpret that as you will” 😉
‘Average layperson can track simple numbers’
From the Washington State you mentioned:
https://depts.washington.edu/labmed/covid19/
Date %Positive
02/03/20 3.2
03/03/20 33.3
04/03/20 3.3
05/03/20 0.0
06/03/20 7.8
07/03/20 5.9
08/03/20 14.1
09/03/20 9.4
10/03/20 6.0
11/03/20 7.5
12/03/20 6.5
13/03/20 6.5
14/03/20 5.8
15/03/20 5.4
16/03/20 8.3
17/03/20 7.3
18/03/20 6.0
19/03/20 6.2
20/03/20 6.5
21/03/20 7.3
22/03/20 9.0
23/03/20 13.3
24/03/20 10.0
25/03/20 9.8
26/03/20 9.1
27/03/20 10.2
28/03/20 13.9
29/03/20 13.8
30/03/20 13.6
31/03/20 14.7
01/04/20 11.8
02/04/20 10.9
03/04/20 12.8
04/04/20 10.8
05/04/20 8.7
06/04/20 11.8
07/04/20 10.8
08/04/20 10.3
09/04/20 8.7
10/04/20 10.2
11/04/20 9.2
12/04/20 10.5
13/04/20 12.2
14/04/20 8.2
15/04/20 8.9
16/04/20 11.3
17/04/20 7.8
18/04/20 8.0
19/04/20 11.2
20/04/20 7.0
21/04/20 8.5
22/04/20 6.7
23/04/20 7.1
24/04/20 6.9
25/04/20 5.2
26/04/20 9.7
27/04/20 5.9
28/04/20 5.5
29/04/20 4.8
30/04/20 4.6
01/05/20 3.9
02/05/20 4.5
03/05/20 6.9
04/05/20 4.6
05/05/20 4.8
06/05/20 6.8
07/05/20 7.0
08/05/20 5.0
09/05/20 4.3
10/05/20 5.4
Plot that!
I have often wondered why they were looking at Cruise Ships as an ‘in vivo’ sample for the community. Surely they should have only been relevant if you compared the cruise to similar voyages in similar regions in similar weather. My understanding of the Cruise Industry is many passengers are on end of life bucket list adventures and have a habit of dying, returning to port in the freezer and this is more likely in bad weather with the common viral infections. Another anecdote is you do not tell anyone you are sick or your entire cabin will spend the voyage in confinement.
By the way where are those ships or are they being requisitioned for another Falklands war?
How do you do random testing? The only really random way would be to pick from a master list of the entire population, a certain percentage. But no such list exists. Illegal aliens would be omitted. A certain percentage of those picked from the list would be unlocatable; others would refuse the test. And testing only volunteers isn’t random. Testing is severely constrained by geography. If you tested in Detroit, you’d get one result, in rural Michigan, another. Average the two and it doesn’t represent either. Finally, how accurate is your test? And how do you know how accurate it is? In a disease that is largely asymptomatic, with the time antibodies remain detectable unknown, how do you cross-check your results?
No Treatment?! Do some basic search. If Obama or Biden mentioned hydroxychloroquine, a proven effective treatment, the Kraang would be shouting from the rooftops our salvation. I have been prescribing it for 28 years, and trust the results that my fellow physicians report who routinely give it and see 90%+ efficacy. See the AAPS study. In Turkey, everyone symptomatic gets HCQ. It works better with zinc and Vitamin D, but alone is also better than the much ballyhooed remdesivir. The so-called studies that dis it are shoddy at best, and are a disservice to medicine and patient health.in the real world, I consider not offering it is unethical and a violation of our Hippocratic Oath.
First time in history that instead of vulnerable and infected people, we quarantined the healthy population.
+1000
Not just HCQ either.
What do you mean “no treatment”?
There are a lot of”treatments” out there, they just don’t want anyone using them.
Do a bit of research on what doctors in many countries have used.
Wow!
Climate scientists switch to epidemiology.
More money lure?
The application of statistical methods and mathematical models is hardly confined to one discipline. Critical thought seems to be a key factor missing in those wish others with relevant expertise but otherwise non-specialist to the field to “stay in their lane.”
Joel O,
Tell that to climate “scientists”, who seem to think that physicists are unqualified to critique the physics used in climate “science”. (^_^)
CLIMATE SKEPTICS SWITCH TO EPIDEMIOLOGY.
Not more money. More brains… and an infinitely better predictive track record on matters of public importance.
The full lockdown was a huge error. I told you so 21Mar2020. So did Willis E, independently.
Sweden was correct – no full lockdown. So were we.
Nic Lewis is a very intelligent gentleman with a good track record of being correct. I don’t have the time to duplicate his work, but he is probably correct.
Total mortality in Sweden peaked in Week 15 2020, the week of 6Apr2020 to 12 Apr2020. In Europe. It peaked in Week 14, on average.
It could very well be true that herd immunity was reached ~2 weeks prior, circa Week 12 or 13, 16Mar2020 to 29Mar2020.
https://www.euromomo.eu/graphs-and-maps/
Herd immunity was probably also achieved by ~mid-to-late-March 2020 in most countries. The lockdowns has little effect, except to trash the economy and impoverish billions of low-wage earners, especially young people.
The high death toll in London, New York and elsewhere was concentrated in old folk’s homes and similar – due to criminal incompetence by the authorities.
The low-risk population was over-protected and the high-risk population was enormously under-protected.
I repeat – what a grotesque, costly debacle!
About half of us here on WUWT have been saying and maintaining from the start that the “experts” were acting irrational and dangerous. It’s too bad that consistently being wrong has no consequences for the “experts”.
The problem is they are held responsible, or at least people will blame them if its worse than expected, so they look at this as over promising and underdelivering.
The difference with the climate modeler types is that the results of the models will be known now, not long after they are dead
Allan this is a surreal situation we have allowed ourselves to be forced into. If the politicians and experts knew they would lose their jobs and income with little prospect of getting another job soon, they would most certainly not have gone down this route. They need to be hung, drawn and quartered – figuratively.
Ironically, Donald Trump was correct in the beginning, but was persuaded to do the full lock-down by his advisers, who got it wrong. Trump did make the right call by quickly stopping travel from China,
Our village idiot Trudeau and his advisers refused, because they said it was “racist” to prevent travel from China. Really! This was a week or two after Trudeau said we should ban all plastics.
I believe that nobody, not even Justin and his advisers, could be this stupid for this long. I believe they are traitors to Canada – just like the Dems in the USA..
THE LIBERALS’ COVERT GREEN PLAN FOR CANADA – POVERTY AND DICTATORSHIP
by Allan M.R. MacRae, B.A.Sc., M.Eng., October 1, 2019
https://wattsupwiththat.com/2019/10/01/the-liberals-covert-green-plan-for-canada-poverty-and-dictatorship/
Hi Michael – my best regards to Dublin and the beautiful Southwest Coast of Ireland.
Ironically, Donald Trump was correct in the beginning, but was persuaded to do the full lock-down by his advisers, who got it wrong. Trump did make the right call by quickly stopping travel from China,
Our village idiot Trudeau and his advisers refused, because they said it was “racist” to prevent travel from China. Really! That cost Canadian lives – many of them. This was a week or two after Trudeau said we should ban all plastics. These were two incredibly stupid decisions – where do they get these people?
They also persist in their delusion that CO2 causes dangerous global warming, and just instituted a costly carbon tax – during a global recession/depression! I believe that nobody, not even Justin and his advisers, could be this stupid for this long.
I believe the Trudeau Libs horribly-wrong decisions were deliberately destructive – they are traitors to Canada – like the Dems in the USA.
THE LIBERALS’ COVERT GREEN PLAN FOR CANADA – POVERTY AND DICTATORSHIP
by Allan M.R. MacRae, B.A.Sc., M.Eng., October 1, 2019
https://wattsupwiththat.com/2019/10/01/the-liberals-covert-green-plan-for-canada-poverty-and-dictatorship/
More money lure? More ability-to-scare-people lure.
It is terrifying to see how more governments are relying only on computer models now to answer complex questions on how they should react and act. Models NEVER replace proper human brain power as they never have every parameter punched in to them and therefore haven’t a clue to all the possibilities. Climate change is another “model” whereas if humans do the work we get a very different result. I wonder how long it will be for human beings to go back to relying on our knowledge and experience to manage our amazing planet !!!
A very long time sadly. For some reason or another, governments around the world are in thrall to these fools- who, remember, usually have little real world experience- and their computer models. Remember the 80s when everyone you knew was going to die of Aids? Lord knows how many similar scare stories there’s been since but they never seem to learn. It’s things like this that convince me that voting is an utter waste of time, since all politicians seem to obey the ‘science’ regardless.
Reading a code review on Ferguson’s data – even after it was cleaned up for publication – I would not put any trust in its output. A team from Edinburgh could not get reproducibility from runs with the same data. There are apparently two problems, one with the seed storage, which is fixable. The other is one or more concurrency bugs. The code is run on multiple cores for speed and is decomposed into threads and/or processes for this. When asked about the non-deterministic results Edinburgh were told to run it on a single core but apparently even that did not produce consistent results from run to tun with the same data. My point, and I have worked with concurrent systems for 50+ years, is that if you have synchronisation problems in the code you just can not trust the results produced. Even though the form of the results may look correct, any qualitative prediction is useless. Even if you average many runs, which Imperial recommended.
Forgot the link: https://lockdownsceptics.org/code-review-of-fergusons-model/
I’m looking forward to the manuscript by Sue der Pantsoff.
I would not trust too much in the information from Swedish health authorities. They are desperate to hide the failure of protecting the old and weak, which was their stated highest priority. Their voluntary measures have so far resulted in ca. 3200 deaths (32,2 per 100.000 persons), whereas the number in Norway is ca. 220 deaths (4,1 per 100.000). For the other Nordic countries the numbers are; Denmark ca. 530 / 9,2, and Finland ca. 270 / 4,9. Both nations implemented a strict lockdown policy. The main effect of the herd immunity policy seems to be reducing the herd.
Sweden’s minister for public health has acknowledged that they did a poor job on protecting the elderly. However, wait until the fat lady sings, or doesn’t, to judge the effects of herd immunity. Sweden should get there first.
Also, keep in mind that initially the goal in many countries was to “flatten the curve.” The assumption at the time was that the area under the curves would be about the same. Further demographics and other factors need to be considered.
“Also, keep in mind that initially the goal in many countries was to “flatten the curve.” The assumption at the time was that the area under the curves would be about the same.”
Yes, this is true, as long as the curve being referred to is the curve of infections since, by flattening that, and not overwhelming the health care system (as appears to have happened in Italy), you avoid people dying due to there being no capacity to provide them with life-saving treatment.
Ultimately there are people who would’ve died anyway, and they still will, but it’s those ones who’re serious enough to need hospital treatment, but respond successfully to it, that “flattening the curve” of infections hopes to save.
Scissor
May 11, 2020 at 7:07 am
——————————-
Sweden does not get any special outcome there Scissor.
Is mainly all the same for all in proposition of “herd immunity”
The “herd immunity” is a population effector in consideration of individual(s) immunity.
It excels and factors in the herd due to the natural condition of sharing within the
herd among the members, where the best and fittest immune responses are shared and dominate in the herd,
the success of the best fittest responses.
It properly excels in the condition of strong epidemics and pandemics, which can not be stopped or slowed down, like seasonal influenza.
So there is no way that you, me any one, we humanos can stop or slow down a proper strong wide vector spread epidemic pandemic disease or infection, especially a double one.
So in that aspect as far as “herd immunity” concerned, all populations, in proper meaning of global, are subjected to the same outcome, regardless of the specific action from different places.
The observed (or not) degree of stupidity does not actually effect the outcome of
“herd immunity”… that is fundamentally impossible.
No possibility of boosting or preventing herd immunity… not even possible to trace the vector effectors in the herd in consideration of herd immunity.
Standing by heard immunity approach means one being careful and responsible about its action…in consideration of epidemics and pandemics.
Technically meaning that one does not make it worse for the sufferers, by mishandling and mismanaging the situation due to panic or incopetence .
Where also with a very increased chance to detect and address any proposition that it may suggest possible problems with certain individuals or groups of risk in consideration of “herd immunity”.
Any condition with a disease that the herd has it not, but you may, it means you get no any proper support from the herd or it’s immunity factor,
as the herd does not even have or know that problem.
An individual or group with such condition will be in their own for a considerable time… with no extra support response from herd immunity, as there not even herd immunity sensitivity to contemplate about that condition.
again;
Natural sharing among the individuals in a herd, consist as herd immunity…
where outcome means the best immune responses will spread and dominate over the herd.
Simple.
Herd immunity consist since the first day of any herd, it simply keeps upgrading and growing, “evolving” over time and generations.
Excels and grows within the condition of pandemics and epidemics… thus the “herd” thingy, a condition tied to the population, the herd, under the force of a disease at once over the most or the whole.
Oh, well, this completely different as for how Nick considers it,
but hey, in the end is not even rocket science, for gosh sake.
The lock downs effect not the herd immunity, one way or the other, but in consideration of individuals or groups that actually have a quite different path than the herd in a given pandemic disease, it will mean a longer time there in the land of:
“you are in your own” mate…
and good luck with all these doctors and all there around, like perhaps the flu vaccines too.
cheers
Did I miss some information? Isn’t the jury still out on obtaining “herd immunity” to this virus? Based on case data, it seems like herd immunity does exist but to what degree?
Mr. Lewis- thanks for the analysis.
Whiten? Is it just me or do you not write in complete sentences? Maybe English is not your first language? I really honestly want to understand what you are saying on herd immunity and I think I got the jest of it, but the details are lost in a string of unconnected phrases.
Shelly, I think you meant to say you got the gist of it, but perhaps you were jesting.
It is interesting that Swedish epidemiologist, Professor Johan Giesecke, who is helping the Swedish minister recognized the failure in the homes some time ago. He attributed it to the number of immigrants and refugees working in these homes whose grasp of the Swedish language was poor and that they did not properly understand all the instructions relating to Covid 19.
Can you provide links/references for the unreliability of the data being published by the Swedish authorities? Thanks
Henning Nielsen
May 11, 2020 at 6:38 am
“They are desperate to hide the failure of protecting the old and weak, which was their stated highest priority.”
——————-
You mean like Cuomo, or worst or not as worst as Cuomo, perhaps.
Or as in the case of Italy, where Italians have already arrived at the proposition of singing in sorrow to their Country being one with no “nonni”, grandparents, any more?
Is it the same desperation and sorrow you talking about, or perhaps like that of UK?
You see, we talking about modern and industrialized countries here mate.
Why people like you dislike so much Sweden?
Any idea? Or kinda of special ideology there?
cheers
..the majority of CV deaths in Sweden were from nursing homes
In Canada, 81 percent of CV deaths have been in nursing homes (official government figure). We have had a moderately strict lockdown policy. And a population distribution quite similar to Sweden.
Why people like you dislike so much Sweden?
Because they don’t like the idea that proportional response to the pandemic, i.e. milder lockdown, would yield the same or similar results as hard lockdown. Furthermore, Ferguson’ model for Sweden was a sheer fantasy, giving results in terms of hospitalization and deaths at least order of magnitude bigger that actual number thus far. They always compare death rate in Sweden with Denmark or Norway but very seldom with, for instance, the UK.
In my view that’s over-reaction. Would be wiser simply to say something like: ‘OK, great for Sweden that they found the way of controlling the spread of the virus without massive cost to the society and economy, unfortunately this approach wouldn’t work in places as London or New York’.
Hard lockdown simply may not be the universal solution for everyone.
Uh but all the evidence shows that quarantining the healthy and locking down the economy had no benefit. Look back at yesterday’s post about NYC numbers, over half of the positive cases were sheltering at home. In a place like NYC, they can’t even effectively get outside and do the social distancing, leaving the people locked within their apartments to worsen their vitamin D deficiency.
I’m no expert but I keep thinking that somebody should have piped up (emperor’s new clothes style!) and reminded us all that quarantine is usually applied to people who have or may have been in contact with an infectious disease not to those people who haven’t.
Instead we all got hung up on idiot phrases like “self-isolate” (telling somebody they must self-isolate is an abuse of the English language for a start!), and then we must go for “lockdown” (something you do to prisoners to quell or prevent a riot not to law-abiding citizens going about their normal business!).
Along with three-part slogans which like all slogans were largely meaningless the main effect (aim?) has been to scare the living daylights out of people to the point where 90% of people in a UK poll yesterday want the present restrictions to continue.
And for what? I only have UK figures but the death toll at the moment is 32,000 out of a total population of 67 million. The 1968 flu pandemic killed 80,000 out of a population of 54 million. The total number of deaths (all causes) in the UK in 2018 was 616,000 or 11,000 a week.
I’m not drawing any conclusions because, as I say, I don’t pretend to any expertise in the matter but making allowance for population increase CV-19 needs to kill another 70,000 to match the 1968 H2N3 epidemic and I don’t see it happening.
So why the panic and the total (virtually worldwide) shutdown of life this time?
Most of this data analysis has to do with general population. Nowhere in there is information on “at risk” populations. Certainly, the data will have to be examined in greater detail and with the benefit of more comprehensive stats., but the math makes sense and seems to align with what we are seeing. It appears that the optimum strategy will be to improve the protection of seniors and at risk people while letting the virus run it’s course. It will probably all but go away over the summer and return in the fall. We cannot take a wrecking ball to the economy again. People will probably have to have certificate of clearance to enter senior’s homes and scrub down every time in. Not so much to ask to protect our elderly loved ones. This may apply to hospital visits, also.
If Nic Lewis is right about herd immunity being largely reached at 23%, New York City is already there… scroll down to see graph https://www1.nyc.gov/site/doh/covid/covid-19-data.page
My guess is the rest of the country is near there already. My state of Colorado shows both cases and fatalities have tapering off to nothing by summer. https://covid19.colorado.gov/data/case-data
Any claim that catching the virus is not tantamount to receiving immunity is bogus. Of course it is. Exposure to the bug (with whatever level of immunity we already have) is the only vaccination against Coronavirus that most of us need and will get. A commercial vaccination is years off. The real success stories of new vaccine development, though spectacular when they happen, almost always are “epics”, taking far longer than the first few waves of the disease.
Unfortunately coronavirus must work its way through our senior communities as well. Unless seniors choose to live out their waning years in isolation tended by constantly vigilant caregivers dressed in space suits, we might want to ask them how they want to play it. The one good thing about bending the curve like Beckham is that it’s given pulmonologists enough time to see that mechanical ventillators are a form of inhuman torture that seem to be ineffective and unnecessary, and they should stop using them, please.
Nic Lewis says:
I just spoke to my doctor yesterday remotely, and from what I can read, quite a few hospital staff and doctors are ensconced at home like him, looking decidedly underwhelmed.
Isolate the sick, restrict certain high-risk professions. Develop useful technologies. Encourage healthy people to carry on with sensible precautions.
Let ‘er rip!
https://www.youtube.com/watch?v=m43rLhelNLM
“Today is a good day to die.”
I’ve been monitoring Stockholm’s Citymapper data for a couple of months now. Percent-of-normal activity has been in the 25-30% range, higher than most other cities but NOT even close to normal activity. The vast majority of Swedes are staying at home voluntarily. So, to draw any conclusions about herd immunity on this basis is dangerous.
Agreed, in the UK the country was locking itself down before the UK Govt imposed one, if the UK Govt had no imposed one there would still have been a lockdown. People are not stupid, they did the same actions in medieval times with no central Govt to tell them what to do. Until the business activity figures come out we cannot tell if Sweden’s actual lockdown was any different in scale than the UK’s.
You mean that by leaving the freedom of choice in tact, the people that were more at risk chose to quarantine and the low-risk population could choose to go about business as usual.
That’s exactly what’s happening in Sweden. The 30% who don’t feel at risk are out-and-about. A large percentage of these have already contracted the disease. So, the low-risk portion of the herd is immune (presumably). However, there aren’t enough of them to create nationwide herd immunity, and the 70% who feel vulnerable (for good reason, as they have seen the nursing home devastation), aren’t going to participate in this experiment.
………….and then go home/work/play; and spread any disease they got?
Standard medical advice from my hospital team, reference my ongoing respiratory problem:
1. If someone is coughing, stay away from them
2. Avoid crowds, especially during winter months.
3. Try to avoid public transport (apparently it is the best way to spread disease!)
4. Wash your hands frequently, and always before preparing food.
5. See your dentist at recommended intervals !
That’s exactly what I’ve been hearing anecdotally. An acquaintance who operates several restaurants in Sweden had 2 of them forcibly shut down by the government and the rest are operating at a fraction of capacity. The situation there is nowhere near “normal” as many posts here seem to imply. The Swedes are not stupid and are watching out for themselves and each other, they’re just not throwing joggers and hair stylists into jail, like some other formerly “free” countries I can think of.
I have been monitoring the congestion tracker from TomTom. Congestion in Stockholm has been similar to 2019 except weekends which show a reduction. Most other european cities show significant congestion reduction throughout the week and negligible weekend traffic.
So now the conspiracy is that Sweden is hiding the number of dead? Let’s not forget that the virus actually started in the USA, right comrade?
Historically, the second year of a novel virus is MUCH worse than the first, despite draconian quarantining of the healthy never being tried before. That might give you a clue to how things will work out when this is all over. Hamstring the economy while making the second wave of virus much worse, what a brilliant plan.
Funny…I would say I would not trust too much in the information from Finnish health authorities. But comparisons to Finland are crazy. They literally blocked-off all roads to/from the Helsinki region (containing roughly 25% of the nation’s population) with police and military for what…3 weeks? It wasn’t just cancelling school, telling people to work from home, and having people following social distancing.
Can’t get too carried away with stats because of different testing, different ways of reporting a COVID-19 death, etc. But Sweden with its near-zero lockdown has basically an identical deaths per capita as the Netherlands and is lower than France, UK, Italy, Spain, Belgium, etc.
Thank you Henning. I can see you are not desperate to say lock downs are a failure–weird how any thinking person can see the results around the globe and how they worked to slow the curve which is what we wanted, yet some continue to torture the statistics to claim all lock downs unnecessary and failures. No one wanted the economic outcome (well not conservatives). That is not to say that lock downs were done correctly, and there is a great argument that the benefits may not outweigh the liabilities (especially economic). We need to have that debate; but to claim they didn’t work and to use Sweden as an example is biased and self-serving–not honest.
Thank you Nic for taking the time and effort for a professional analysis of the virus propagation. We are very fortunate to have a country that took a conservative approach to this virus and that a well respected individual analyzed the data.
Yes, good analysis.
I’ve been mulling the susceptibility variance for some time, thinking (hoping) it should factor in a positive way. But I only play an expert on TV. Now here’s something I can hang my hat on.
It seems to me that what is lacking is a test to see what would happen if you were exposed to COVID-19 – would your immune system fight it off with either no symptoms or temporary symptoms, or will you become very sick, and what determines this. At the moment, it seems the best they can do in this respect is a PCR IgG and IgM test. However, I am sure they have enough data now from people who been exposed and/or recovered to study this question.
There is also the question as to whether COVID-19 is the actual cause of death. As Elon Musk eloquently put it
– if you get hit by a bus and are taken to hospital and you die from your injuries, if you tested positive to COVID-19, it will be recorded as the cause of death. (The hospital gets paid for treating COVID-19 so there is a financial incentive to attribute the death to COVID-19 even if it is not the proximate cause).
Does any body have any information about how the Spanish Flu was eradicated? There were no vaccines or antibiotics to take care of bacterial infections in 1918.
“The first wave of the 1918 pandemic occurred in the spring and was generally mild. The sick, who experienced such typical flu symptoms as chills, fever and fatigue, usually recovered after several days, and the number of reported deaths was low.
However, a second, highly contagious wave of influenza appeared with a vengeance in the fall of that same year. Victims died within hours or days of developing symptoms, their skin turning blue and their lungs filling with fluid that caused them to suffocate. In just one year, 1918, the average life expectancy in America plummeted by a dozen years”
“Almost 90 years later, in 2008, researchers announced they’d discovered what made the 1918 flu so deadly: A group of three genes enabled the virus to weaken a victim’s bronchial tubes and lungs and clear the way for bacterial pneumonia”
https://www.history.com/topics/world-war-i/1918-flu-pandemic
Walt D:
>>Does any body have any information about how the Spanish Flu was eradicated? There were no vaccines or antibiotics to take care of bacterial infections in 1918.<<
as far as i know – flus in general proliferate until there are no more vulnerable bodies within reach – then the flu virus attains Limbo – or perhaps find another species to infect – ominously called "reservoirs"
Thinking there is some conflict with “second wavers.”
Isn’t all of this based on the assumption that cvd-19 is new and we have never been exposed to it before?
The fact that many people show no symptoms of illness is evidence that they were exposed to cvd-19 long before the lockdown began. How long before is anyone’s guess really, 2 years ago, ten years ago?
Probably not. More likely that there is an aspect of the structure of China virus that is common to another pathogen experienced long ago in human history. Some people were preferentially selected for survival by virtue of having a particular mutation. Over time that mutation has been retained by a few people. People still carry immune system features that protect against the black Death. Regardless of the disease the death rate is never 100% (cross your fingers).
There are I believe at this time seven COVID strains for will give you cold systems and to the most part will not cause high mortality. They are out there and it looks like the reason children are not affected by COVID-19 is due to that and why the elderly are is it been to may years since they had one of the other non lethal COVIDs. That may also be why only 17% of the population need to have it to get herd immunity. By the way the cruise ship showed the same thing only about 20% got it after that it quit spreading.
Maybe it’s just not a very pathogenic virus to begin with, which is what the data suggest.
Everyone has an immune system with some aspects of innate immunity. Here’s a tutorial.
http://www.biology.arizona.edu/immunology/tutorials/immunology/page3.html
SARS-CoV-2 is likely a bat coronoa virus of the beta-corona virus group. Within the betaconroaviurs group there are two other beta corona virus (of 4 total cornoa viruses, the other 2 in the alpah group) that have widely circulated for decades in the human population via person-to-person spread (not zoonotic).
What that means is their is a lot of molecular homology (similarness) within the viral proteins that encode critical virus molecular functions like the RNA-dependent, RNA polymerase (RDRP), and the non-structural viral proteinases that cut the initially-made long poly-protein into functional parts after translation by ribosomes. That means their is likely a high degree of cross-reactive memory T cell pools formed between related beta-coronoa viruses. This memory T-cell cross reactivity is a leading hypothesis on why so many get infected with SARS-CoV-2 but remain asymptomatic.
“Age associated decline of the immune system continues to be a major health concern. All components of innate and adaptive immunity are adversely affected to lesser or greater extent by ageing resulting in an overall decline of immunocompetence. As a result in the aged population, there is increased susceptibility to infection, poor responses to vaccination, and increased incidence of autoreactivity. There is an increasing focus on the role of T cells during ageing because of their impact on the overall immune responses. A steady decline in the production of fresh naïve T cells, more restricted T cell receptor (TCR) repertoire and weak activation of T cells are some of the effects of ageing. In this review we summarize our present understanding of the effects of ageing on naïve CD4 T cells and potential approaches for therapeutic interventions to restore protective immunity in the aged population”
https://www.ncbi.nlm.nih.gov/pmc/articles/PMC3928693/
Oddly doesn’t mention zinc as a therapeutic intervention to build up the thymus, which makes T-cells.
Should be easy to check if thymus regeneration increases resistance to infection. Males who have chemical/surgical castration, or undergo hormone treatment for prostate cancer, tend to undergo thymus regeneration.
Lots of elderly people use vitamin/mineral supplements anyway..
But the “infection” is not a problem, “death” is. The number of dead depend on wealth, age and cares.
There is evidence that the coronavirus infection may lead to things like heart problems. link So, you get better from coronavirus but you now have an ongoing heart problem. The link says the problem could affect as many as 1 in 5 cases.
The possibility of a covid-19 infection should not be treated lightly, even if you’re young enough that it won’t kill you.
Doh! The k word. Sorry mods.
More than likely what’s happening in such cases is covid-1984 is bringing existing, hidden cardiac problems to the surface. There doesn’t seem to be much evidence of systemic virulence.
If there is denial of anything in the sciences, surely it is Darwin?
You can’t always, with the best will in the world, dodge it.
A vaccine could take years…
“The Stockholm infection fatality rate appears to be approximately 0.4%,[20] considerably lower than per the Verity et al.[21] estimates used in Ferguson20, with a fatality rate of under 0.1% from infections until the HIT was reached.”
What am I missing? 0.4% is less than 0.1%?? Typo,….. or what else is possible? Or is this an overall effect of lock-down. 😉
That confused me as well, I think there are taking about 2 different things.
First “The Stockholm infection fatality rate appears to be approximately 0.4%,[20] considerably lower than per the Verity et al.[21] estimates used in Ferguson20” and Reference 21 gets “We obtain an overall IFR estimate for China of 0.66% (0.39%,1.33%)” so higher that 0.4%.
Second “with a fatality rate of under 0.1% from infections until the HIT was reached.” means under 0.1% of the population, not those infected. They are expecting to achieve heard immunity after 23.6% infected, and 23.6% of 0.4% is less that 0.1%.
If a person is susceptible to covid, and if the infection rate is so high, then everybody essentially that can get it , will get it, save only the super careful- very few. over the period of a year, even with the lock down. over a year holed up in your house with only contact with family members, and grocery stores, and delivery people, – mail, pharmacy … it will find you. So who exactly is being saved by the lockdown? In the longer run, and assuming no vaccine to save us, probably nobody. (also assuming hospitals are now as ramped up as they can get. that seems true). So given we can’t keep lockdown for another year, lets proceed and treat the casualties, because the area under the flattened curve is the same as a more peaked one apparently
Good point!!
99% of hospitals are actually at historically low patient capacity.
Good points, but the whole area under the curve assumption/flatten the curve premise is suspect.
I agree with this analysis and have mentioned this in previous comments. Susceptibility should not be considered simply a measure of lacking humoral immunity (having antibodies from previous exposure). It is also a manifestation of poorly understood and measured factors that include behaviour, genetics, social structure and function, and possibly other elements yet unknown.
I suspect that for many populations the herd immunity threshold is around 20%. It will not be the same in every population depending on factors such as population density, social habits and interaction, economic structure and function and other possible factors such as climate.
There may be exceptions where there is much higher population penetrance of the virus such as we see in nursing homes and veterans facilities. These are special cases where there is a high rate of weakened immune defences, chronic disease and enforced social proximity. It mays also be that the inhabitants of these facilities have increased infectivity once infected due to high viral shedding.
So far most of the models being used to predict the epidemic curve seem to miss most of these complexities and thereby predict a massive surge in infections that never arrives.
This is a different critique of Ferguson’s model than I have seen in other fora as it has accepted the basic premise and just modelled population heterogeneity. As such it is yet more evidence that the Ferguson model is clearly not one that governments should have used in determining their strategy.
However, I do not believe that the various governments who took this decision did so purely on the basis of the model, but the alarmist media outlets who were pushed ever more scary worst-case scenarios and whipped up such a (social media) frenzy that governments felt compelled to respond with extreme lockdown measures. If this had been done by an individual to drop the stock price of a company, those people would have been prosecuted for share manipulation.
bingo … herd immunity has always been a local community thing that depends on the number of previously infected and the type of physical interations in that community … herd immunity in my small town in PA is obviously completely different than in NYC … a simple increase in hand washing combined with reduced face touching will dramtically slow a viral spread but also dramtically slow the herd immunity as well …
Thanks for the highly informative paper Mr. Lewis!
Your model is very “useful” in that it suggests that relatively small changes in some of the input variables result in huge differences in progression of the disease.
This leads me to a question for the medical background posters on WUWT:
What if there is large variability in infectivity due to the age of the person? (Or some other innate characteristic.)
Consider that if almost no infected children 14 and under are shedding active virus, and very few people age 15-29 are shedding active virus, what that does to the herd immunity models based on Mr. Lewis’ analysis.
The progression of the pandemic has not followed any of the models or predictions very well. Heterogeneous infectivity could explain some of the “odd” results, and I have not seen a previous discussion anywhere of that variable.
Where do we go for better “experts”?
ECDC just reported the lowest daily US Covid-19 deaths since the end of March.
I’m certain you saw the 48 pt headlines.
“Fighting the inflammatory process
He also explains that the cytokine storm is the body’s immune state in which it begins to produce various types of substances that on the one hand are designed to fight the inflammatory process, but on the other can also intensify the inflammatory response. So, as a consequence, the patient’s condition can get much worse.
– Knowing about the occurrence of such a situation, we reach for Tocilizumab – a drug that counteracts the inflammatory storm arising as a result of virus infection – says prof. Życińska. He points out that Tocilizumab is an antibody that blocks an important substance that enhances the development of inflammation – interleukin 6.”
The Australasian Society for Clinical Immunology and Allergy recommend tocilizumab be considered as an off-label treatment for those with COVID-19 related acute respiratory distress syndrome. It states this because of its known benefit in cytokine storms caused by a specific cancer treatment, and that the cytokine storm may be a contributor to mortality in severe COVID-19.[36]
On 11 March 2020, Italian physician Paolo Ascierto reported that tocilizumab appeared to be effective in three severe cases of COVID-19 in Italy.[37] On 14 March 2020, three of the six treated patients in Naples had shown signs of improvement prompting the Italian Pharmacological Agency (AIFA) to expand testing in five other hospitals.[38] Roche and the WHO are each launching separate trials for its use in severe COVID-19 cases.[39]
In March 2020 a randomized study, at 11 locations in China, which should conclude by 31 May 2020, started to compare favipiravir versus tocilizumab versus both.[40]
https://en.wikipedia.org/wiki/Tocilizumab
The key observations to me are:
1. That Sweden and US states that isolated with less then state mandated lock downs (by sheltering voluntarily as mentioned above) HAVE NOT seen a disastrously (or any really) higher/worse result then places that did lock down.
2. 2/3rds of new Chicom-19 hospitalizations in NY after 4 weeks of lock down are are now documented as being of individuals who HAVE BEEN IN LOCK DOWN.
3. Death statistics now clearly document that it is the elderly and individuals with co-morbidities who are most at risk (over 88% of deaths in my county in Santa Clara CA).
Putting that last bit into perspective means we’ve experienced about 15 additional deaths among our younger and healthier population (1/8th of our 130 reported deaths) of some 1.5M+ (making a swag that 75% of our 2M are not old and/or suffering with a serious co-morbidity). That is 1/1000th of 1%.
So my conclusion is it spreads if you are locked up or not, and unless you are in a high risk segment, getting it is about as likely to be fatal as the normal flu. This doesn’t mean that you can’t get sick and die, but for most of us you are just as likely to die from dozens of other causes we find perfectly acceptable to face every day without fear and panic.
MHO for what it is worth
The big reporting problem also exists for those 18 additional deaths because, as has been pointed out frequently, if someone in the US dies with a COVID-19 PCR positive result from other unrelated causes, many hospitals have been encouraged (with additional money) to report them as COVID-19 deaths.
And HIPAA privacy mandates will prevent many after-the-fact re-examinations of those originally reported results.
The strongest correlation with severe C-19 is vitamin D deficiency. Locking people inside out of the sun and creating economic fears where families are eating raman instead of salmon and mushrooms will sure help. /s
There is still a correlation versus causation problem with Vitamin D levels and COVID-19 severity.
Higher vitamin D levels may just reflect healthier people who get outside more (high functioning elderly, versus low-functioning elderly also correlates to co-morbidities and what gerontologists call frailty syndrome), thus correlated but of possibly limited or no causal linkage.
My observation, simply from watching the TV interviews with younger or the middle age people recovered from hospital treatment or sadly died is that great majority was well on the overweight side, and that is the case with BoJo, our PM.
“In summary, from our data, we conclude that highly pathogenic influenza viruses are able to reach the thymus via dendritic cells and to interfere with T lymphocyte development. Moreover, this exceptional mechanism might not only be found in influenza virus infection, but also might be the reason for the increased immune evasion of some new emerging pathogens” The Journal of Immunology, 2010, 185: 4824–4834
There are several trials studying vitamin D, so hopefully these associations are clarified.
https://clinicaltrials.gov/ct2/who_table
your MHO is 100% correct
So, we may realistically have a significant “inhomogeneity in susceptibility and infectivity”, which in this model can lead to a herd immunity situation with “only 14% of the population ultimately becoming infected”?
Now, everyone, check me if I’m wrong, as I try to interpret the common sense implications of this. If the model parameters here happen to be both realistic and effectively correct, the ultimate infection of 14 percent of the population implies that 86 percent of the population *never* becomes infected, right? This is despite the prospect that some sizeable fraction of the 86 percent will have definitely been exposed to someone infectious at one point or another? Also, the writer says that “susceptibility will vary with the strength of an individual’s immune system as well as with their social connectivity”. So some of the 86 percent who never get it will have been more or less protected by relative isolation, others by just having “a stronger immune system”, with *no special acquired immunity* needed for their immune systems to give them significant protection against this virus! Also the total population death rate is projected to be “well under” a tenth of a percent up to the time of herd immunity being reached (which could be a very large sounding absolute number, given the large populations these days, but still a relatively low risk and/or death rate compared to other medical issues like cancer rates, etc).
This is certainly at variance, it seems to me, with the implication that is often given out these days, that we must always “save lives” by locking down as firmly as possible whenever we see a significant infection rate and/or death rate from this particular virus! People (including quite a number here on WUWT at times), even throw around large numbers for the lives ‘saved’ by locking down — but where do you find those numbers, exactly, in this sort of model? The equilibrium of 14 percent (or whatever) being specifically immune, with almost everyone else being either naturally resistant or never having been exposed, that equilibrium is reached eventually in a way that lock downs probably don’t impact much?
The alternative to locking down is basically that the pandemic is going to proceed to a herd immunity level, by which time modern medicine will have a good chance at minimizing any further illness or deaths from this. Reasonable hygiene might slow the spread or help stabilize the rate of illness lower than might otherwise happen, *but* I can’t find any indication in this kind of scenario that *extreme* measures are doing anything worth the costs (in dollars or lives), i.e., the lock down ‘cure’ could easily come out worse than anything we might have gained?
Consider the extreme case of inhomogeniety is in STD’s. If you are in a sub-group that is highly sexually active, you are much more likely to get an STD than a celibate monk. That is, the population is not homogenous in behavior and environment, thus some will be at high risk, others at low risk to exposure.
Models that assume the population is homogenous thus requires higher threshold of HI to bring R(0) well under 1.0 and thus diminish viral spread.
The assumption though is that from a strict BIOLOGICAL susceptibility standpoint all members of a population can be infected by the virus.
@David Blenkinsop
You are right with your skepticism.
The term “herd immunity” is used wrongly in this context. What is described is a change in Rt that leads to the end of an epidemic. But that implies the assumption that this Rt doesn’t change up back again. That depends largely on people’s behavior.
Given the happened superspreading events the assumptions made about 10-20% of immune people being able to ease any spread in a way of “herd immunity” are very unlikely.
A recent study done in NYC (not yet peer reviewed but solid data nonetheless) should bring lots of concern about SARS-CoV-2 as to when virus shedding abates after resolution of symptoms in individuals. The comforting thing is that all PCR testing confirmed/infected SARS-CoV-2 individuals went on the develop IgG responses. Specific IgG at sufficient titers is widely believed (from lots of data) as a correlate of long lasting immunity (with both memory B cells and memory T cells pools formed as requirement to get to IgG production) against viral infections that are not able to seasonally mutate antigenic surface structures for immune evasion (like influenza virus does so easily).
The study (not yet peer-reviewed):
“Humoral immune response and prolonged PCR positivity in a cohort of 1343 SARS-CoV 2 patients in the New York City region”
https://www.medrxiv.org/content/10.1101/2020.04.30.20085613v1
The important take away is where they conclude: “We also report that in a large proportion of individuals, viral genome can be detected via PCR in the upper respiratory tract for weeks post symptom resolution, but it is unclear if this signal represents infectious virus.”
They also write in their discussion section, “The 19% of participants who remained PCR positive despite self-reporting full resolution of symptoms bring to light important considerations regarding the possible duration of viral transmission, and the limited utility of PCR testing to ensure clearance. This positive PCR finding could represent shedding of nonviable virus, non-infectious genome fragments or viruses engulfed by immune cells, asymptomatic carriers of SARS-CoV-2, or ongoing disease despite full resolution of symptoms. Detection of viral genome even months after resolution of infection has been shown for viruses like measles virus.”
Also of note is where they report, “Of the 113 participants with PCR confirmed SARS-CoV-2 and weakly positive or negative titers on their first serum antibody test, 64 have returned for follow up antibody titers at the time of submission. Of these, 57 (89%) displayed increased titers between the two tests, a median of 13 days (5-25) later (Figure 1B). Four remained weakly positive, and three remained negative.
The three that remained negative all self-reported positive PCR testing (none were documented in our EMR). (Table 2)
That of course is a polite way of saying those 3 study subjects who remained IgG negative likely misreported (lied?) a PCR CoV-2 RNA positive result to the investigators.
The result of this study as clear implications about health officials assumptions on duration to remain isolated after the resolution of symptoms. To me, it is another reason these lockdowns are particularly in-effective with this virus.
As such, clean clear distinctions of SEIR model assumptions of when a person moves from one compartment to the next are fraught with many exceptions in the real world. These are critically important “exceptions” that make belief in contact tracing of exposed individuals practically meaningless once a virus with the high transmissibility, long periods of asymptomatic individuals like we see with CoV-2 then becomes widely dispersed across all facets of population as it is now in most countries.
We’ve known for many decades that measles virus (infectious virus) continues to be shed by asymptomatic/immune/recovered patients for months. Yes, months. Similarly we see this also with varicella zoster, the chicken pox virus, a herpes virus, long after the symptoms in an infected individual have abated and all outward signs of morbidity (feeling sick or being symptomatic) have long ceased and the person’s immune system has established increasing immunity.
Thank you for that reference- there is a dearth of follow-up studies on post-infection status as – I suppose understandably – the focus is on primary infection rates.
In respect to this, do you know of any serological studies/follow up of the passengers and crew from the Diamond Princess? I saw a preliminary report that only about 10% had positive tests (PCR presumably), of which half developed symptoms. I have would like to know if there have been further studies to determine if any of the non-PCR positive individuals were sero-positive to determine if there was either a) immunity from previous exposure/cross-immunity from other corona viruses, or b) sero-conversion in the absence of viral detection.
I think the problem with follow-up on the Diamond Princess
lab ratspassengers and crew is now they are dispersed back to 4 corners of the world, including the multinational crew since most of the cruise lines are now shutdown and they laid off everyone.At least in a densely populated urban area, like NYC, it can be easier to get COVID-19 patients to come back into the same medical centers for follow-up serology tests since they live or work nearby.
The herd immunity threshold is complicated by seasonality, which independently reduces transmission. Seasonality is not understood, and has not yet been established for COV-2, but three of the four common corona viruses that infect humans are strongly seasonal.
The thing that has bothered me about relying on herd immunity, is that the Spanish Flu had 3 waves. Three times the virus swept thru, rising exponentially and then falling away. Herd immunity could not have been achieved by the first two waves, it came back a third time.
There is even argument as to the cause of it not coming back a fourth time. Did it mutate itself out of the ability to harm us, or did it finally achieve herd immunity?
It definitely was mutating. That is why they think the second wave was more deadly than the first. But there is no proof either way.
So, can any model predict three waves for the Spanish Flu? This model explains how full herd immunity might not be established in one or maybe two waves. But can it explain a second wave?
If so, does it predict more waves to come of COVID-19?
I remember my grandfather telling me that he suffered two infections, the first one was not too bad, but the second one was nearly fatal, his family didn’t expect him to survive. If he had acquired even partial immunity I would expect it to be the other way around. I do not know if there was a third wave in the area, but I don’t think he ever mentioned it.
What little I’ve read about the Spanish Flu would seem to say that a flu of that sort was a different thing from the current pandemic, with *that* virus going very aggressively after the bronchial tubes of both young and old.
So if we can shut down entire businesses, hospitality industries, schools, etc., over something like Wuhan Coronavirus, what would we do about something more like the Spanish Flu, I wonder?
From British eggheads today: they claimed – based on serology and antigen testing – that only 4% of the UK population contracted the virus. That would be a staggering difference compared with Sweden if Nic’ estimation are – even very roughly – correct.
Is there a link to this information?
That was from today PM evening briefing with profs. Whitty and Vallance; from 33 min onward:
https://twitter.com/i/broadcasts/1lPKqVXOOmwGb
Thanks.
So 4% in the whole country, 10% in London. Would have liked to know the specifics of the test but you can’t have everything.
The UK situation was that the NHS was not coping with business as usual, due to UK Gov policy of dismantling the NHS.
What else could be done
“Have you got any evidence of this “dismantling”?
The NHS treats around 40% more A& E patients than it did 10 years ago and carries out about 45% more elective procedures.
As an aside it is worth noticing postmortem results in Hamburg Germany.
Professor Klaus Püschel, head of Hamburg forensic medicine, remarks:
“All of those we have examined so far have had cancer, a chronic lung disease, were heavy smokers or heavily obese, suffered from diabetes or had a cardiovascular disease.”
“This virus affects our lives in a completely exaggerated way. This bears no relation to the danger posed by the virus. And the astronomical economic damage now arising is not commensurate with the danger posed by the virus. I am convinced that corona mortality will not even make itself felt as a peak in annual mortality . . .” (my emphasis)
https://www.mopo.de/hamburg/rechtsmediziner–ohne-vorerkrankung-ist-in-hamburg-an-covid-19-noch-keiner-gestorben–36508928
Why are journalists not carefully analysing and looking at the implications of this?
Why did our politicians not factoring this in in their draconian lockdowns and protracted opening up plans?
They probably didn’t factor these things in because that’s not what they were told at the time of the lockdown. In the UK the government were advised that the outcome could be half a million deaths, and a collapsing health service. That outcome has influenced their policies ever since. Just a couple of days ago the warning was that there could be a hundred thousand deaths (extra? – the media didn’t say / think to ask), if the lockdown is ended too soon.
Lockdown measures should vary because of population density.
New York State demonstrates what happens when lockdown is not soon enough.
And it was more important that New York city lockdown was before New York state due the city’s higher density.
Though it’s not about some arbitrary city boundary line and for example it’s more about mass transit routes
and other factors.
The densities of New York State demonstrates what went wrong globally with this virus and New State has
the highest death per million as compared anywhere in the world, and currently it’s 1,381 deaths per million.
Or in terms of the world, one reason to lockdown is about the rest of the world, rather than region which is locked down. New York city delay in lockdown caused area near it, to also have high deaths per million, New Jersey has 1,048 deaths per million.
One could say the main purpose of the lockdown is because you don’t want to lockdown too late- like New York city did. The nature of this virus would have lockdown NYC without anything done by government, and government did manage to lockdown before this situation occurred.
It seems NYC and Wuhan were similar in terms of being to too late to lockdown- Wuhan infected the entire world, and to such an extant that herd immunity and other lockdown measures resulted NYC only causing high death per million to the region near it. No doubt NYC was victim of the hell inflicted by WHO and China, but NYC delay caused a smaller but stronger hell.
And would say NYC was late by at most, 1 week. If it hadn’t lockdown, with an addition 1 week of delay, it would have “naturally” had a lock down- and would been even worse.
Of course, UK also did a NYC and seemed to even delay longer than NYC.
It seems the difference largely has to do with how elderly were isolated.
In terms of death per million, it’s largely/exclusively about isolation the elderly.
Though death per million of elderly, has nothing to do protecting the rest of the world. They aren’t the cause of the endangerment, the cause of the hell of this pandemic. Or you need a lockdown {rather just isolating the elderly] because the large amount serious illness and small chance of death to rest of population.
The lockdown is for the +20 to 65. The isolation of elderly is from what the +20 to 65, cause at the time of near peak spread which has a high viral load environment.
One say complete isolation of +65 during the Passover. Though very early isolation of elderly and once you get herd immunity, it’s safer for elderly, but it seems now nowhere in the world has it reached point of “safer for elderly”. But would say it’s safer almost everywhere world for below 65. And other than moderate measures in terms social distancing, was it ever problem for people less than 20 year old.
But there was unknowns regarding the younger population and could be still significant unknowns. As example children with deficiencies in vitamin D. And I don’t think there any significant problem with prison population {other than elderly population within prisons]
The problem with NYC, Boston, London, Paris, Chicago is mass transportation modalities (underground subway and bus systems) are the perfect environment to spread a respiratory pathogen like SARS-CoV-2 in the air and via touching likely contaminated hand-holds, seats, ticket machine buttons, and turnstiles.
Out in LA and San Francisco fewer take those public modalities and many drive their own car, as seen in the linear parking-lot freeways of SoCal in normal economics times past.
Plus the elevators.
We need better elevators and mass transit.
I see no reason it should cost much to improve them so they aren’t breeding grounds for pathogens.
Buses should be easy, elevators and airplane also fairly cheap. The subway trains with their tunnel systems might be expensive.
Please reconcile those conclusions with NY/NJ, where 36K are dead out of a population of 30M. The very lowest “death” rate is already past 0.1% of the population. Each day more die, that number grows.
Anytime a fixed number (the death rate) changes with the wind – I have to question the entire premise.
I was already questioning it with this statement: ” little transmission from asymptomatic cases.”
CDC contradicts this directly.
(*e.g., more will die where fewer hospitals exist)
How many of those people actually died from CCP-19?
…” little transmission from asymptomatic cases.”
That is what it actually is written in the reference about it:
“The model estimated R0 = 2.0 in the early stages of the epidemic in China. The contributions to R0 included 46% from presymptomatic individuals (before showing symptoms), 38% from symptomatic individuals, 10% from asymptomatic individuals (who never show symptoms), and 6% from environmentally mediated transmission via contamination. Results on the last two routes are speculative.”
So just a guess, no proof.
Well a coronavirus has never reached more than about 20% infection of a human population, so why should this one be any different. Partly because the virus really doesn’t care which mammal it infects as long as it exists. Rhino can reach 60% and flu very rarely above 40%.
Nice model, but it really wasn’t needed.
+10
Well the number of new cases has dropped dramatically in NYC, is this due to lock down or herd immunity being reached ? Other states with similar lockdowns are not seeing cases drop as much as NYC so I tend to believe herd immunity playing a role in NYC.
One interesting thing is if you are 80 do you prefer to get the disease now, or risk getting it next year when you may not be as healthy. A year can make big difference at that age.
“Well the number of new cases has dropped dramatically in NYC, is this due to lock down or herd immunity being reached ? Other states with similar lockdowns are not seeing cases drop as much as NYC so I tend to believe herd immunity playing a role in NYC.”
there is zero evidence for herd immunity occurring anywhere.
the observational evidence required to establish herd immunity as a cause is not easy to collect.
To prove herd immunity you cannot simply look at the number of cases.
Example. People decide to wear masks and wash their hands religiously.
spread will slow and stop.
has zero to do with herd immunity.
basically Nic is playing with a model and hoping it is true.
“New study from Germany finds that every COVID-19 death was someone who had cancer, lung disease, was a heavy smoker or morbidly obese”
“Head of Forensic Pathology in Hamburg on covid19 autopsy findings: “not a single person w/out previous illness has died of the virus in Hamburg. All had cancer, chronic lung dis, were heavy smokers or heavily obese, or had diabetes or cardiovasc dis” 1/3 https://t.co/u4Pi9ntRT0 pic.twitter.com/PaSdh2UnF5″
“New York City: 99% of fatalities of all age groups had underlying conditions
Italy: 98%
Britain: 95%https://t.co/uAhg…//t.co/sxqTq51mvkhttps://t.co/TUNgUyFcJf”
Edit or delete this
Switzerland rolls back coronavirus lockdown earlier than expected. Schools to reopen since children rarely get virus or transmit it. Even better, Swiss tell those over 65 they can resume their lives. https://t.co/y9QrXP1Jmc via @TheLocalSwitzer
“In my view, the true herd immunity threshold probably lies somewhere between…”
But is it true herd immunity? As I understand the analysis, it says that the observed R₀ is inflated by subgroups where the virus spreads more easily, and when they develop immunity, effective R₀ is lower. But the herd is not immune. Well, of course, it never is, completely. But the problem is that this immunity derived from inhomogeneity is dependent on maintaining the inhomogeneity. Suppose, for example, that the spreading groups are occupational, and employment changes. Then the spreading starts again.
It appears that this number of 20% of a given population being infected by the covid-19 is a recurrent one and constitutes very likely the maximum of contamination that a population will experience. We found exactly the same numbers on the Diamond Princess, the Theodore Roosevelt and many serology studies across the world. There should not be any place left for doubt.
This tells us that mass confinement was a useless strategy.
However the increase in the rate of developing antibodies means that the much sought-after group immunity – where there are so many people immune to the virus that it has little or no opportunity of spreading – is still a long way off.
Experts generally reckon that it would take a minimum of 70% of people with antibodies before group immunity is present. At a rate of 3% every three weeks, that target would only be attained in late July 2021.
https://www.brusselstimes.com/all-news/belgium-all-news/110383/only-6-of-population-have-antibodies-group-immunity-still-far-off/
Do we need herd immunity when the only people at risk are the old and already ill.
It is really just another illness the old and ill will have to deal with.
If you know personally somebody who got a stroke in his 20’s without any listed co-morbidity but with SARS-CoV-2 you might change your opinion.
Happens that that is the case for the colleague of my colleague’s husband. Whole program: facial paralysis, loss of speech etc. Fortunately in way better shape now, speech back and in rehabilitation.
Wonder what the microembolisms do to the heart and brain of children when you can already see them on their feet.
A NOVEL virus with no previous human experience. The only sensible way to deal with it is to crush it by depriving it of hosts. It can be crushed in a month – Taiwan and other countries have proven that.
Sweden’s expert is horrified by the number of deaths but it is his strategy that is responsible for their death. A blind person can see that a slow burn through the population will result in tens of thousands of deaths and take years. Why choose that path when there is a much quicker, less costly approach. Particularly when the long term health impacts are unknowable. We already know the virus has much broader impact than just respiratory stress.
The median age of test-positive deceased is 80 in Italy, 83 in Germany and 84 in Switzerland.
This elegant analysis is in common with much mathematical modelling of of epidemics is that it physical and does not encapsulate the biology of infections. I don’t mean as a criticism of the author but to make the point that the conventional modelling can only very crudely reflect reality.
He makes the point that relatively small changes in assumed susceptibility, which is a biological trait, can lead to markedly different predictions. I think most medics are well aware of variability of susceptibility to infections, even novel infections which may be due to genetic variability in NK lymphocytes or by recognition of CV19 proteins that are recognised as structural homologies by T cells and stimulate existing clones of B cells. This has been very difficult to quantify in the past and becomes simply part of the estimate of R although it has huge significance for understanding epidemics.
This is particularly the case in CV19, which which appears to have different clinical characteristics to other respiratory viral infections and epidemiological models based on one disease may not the applicable to others. For example, the pneumonia associated with CV19 seems to be very unusual ( a high V/Q abnormality leading to hypoxaemia without respiratory distress) and this may be one of the reasons ventilator capacity has been overestimated.
Use of the SEIR model is based on the assumption that infection confers immunity. How many people out there are immune to the common cold?
Infection MAY confer immunity, or the whole essay may be Garbage In Garbage Out. Mr Lewis could at least grant that he has made an assumption.
I am going with garbage in garbage out. Mathematics is not a life form. More and more mathematics seems to have failed the life sciences.
Unsurprisingly, Maoris were 7 times more likely to suffer Spanish Flu than the European New Zealanders, as Fijians were to suffer measles etc, so this would affect Ro? However societies with just two racial groups are rare now, and it is not totally apparent that different ethnicities will provide protection or susceptibility, what is certain is that perhaps in Iceland where one ethnicity dominates one should expect variations in degrees of infectivity?
Why are only Florida and Texas making special efforts to reduce fatalities by protecting the elderly? Both States could still do better at their nursing homes, but they are focusing some resources where the problem is.
Few of the over 70 elderly (95% of fatalities) are still working, so are far easier to sequester. Common sense screams out for focused protection of those over 70 to have any chance of reducing fatalities during the period of widespread viral exposure.
NY did the opposite of a focused protection of the elderly when they relocated patients with the viral infection into Nursing Homes…resulting in thousands of deaths. The resulting journalistic silence at this outrageous incompetence is telling. Imagine the outcry if Trump had made an idiotic Exec order that resulted in thousands of deaths.
Common sense epidemic management is broken.
Journalism is really broken.
Calculating Ro appears to be a very complex business
(see https://www.ncbi.nlm.nih.gov/pmc/articles/PMC1804098/)
In order to calculate crude estimate (I called it Rp) of what is going in your country you can do a simple exercise using MS Excel.
column A – date
column B – number of daily infections
column C – in C5 cell type following: =(AVERAGE(B3:B9)/AVERAGE(B2:B8))^2
now copy C5 cell result and paste it from C6 all the way to nearly the end of your data, leaving the last three cells clear. For detail see the inset in the graph I did for the UK
http://www.vukcevic.co.uk/Rp.htm
whereby the blue line is a hand-drawn approximation.
Rp it is simply square ratio of the 7 day average for any day of interest and the 7 day average for the previous day.
I don’t know much (or anything) about virology, but I do know math. The author states:
The ‘herd immunity threshold’ (HIT) can be estimated from the basic reproduction rate of the epidemic, Ro – a measure of how many people, on average, each infected individual infects. Standard simple compartmental models of epidemic growth imply that the HIT equals {1 – 1/Ro}.
If true, and if HIT = 17% in Sweden (as stated), then algebra indicates that Ro = 1.2.
It seems to me, and again I am not a virologist, that Ro is conditional upon circumstance. An infected person who is coughing on a crowded subway train is going to infect a lot more people than one who is alone in the middle of a desert. Similarly, an infected lab tech at a Chinese wet market is going to infect more people than a bat in a cave in the wilderness.
Rather than being a fixed property of the virus, Ro is more of an emergent property dependent on the physical social environment. I just guessing here, not being an expert.
Thus we might speak of “effective Ro” given the conditions. In which case, an effective Ro of 1.2 in Sweden is just as likely as Philandering Fergie’s 2.4, a number that apparently appears out of nowhere as far as I can tell. But what do I know? Please don’t hesitate to correct me if I am wrong (as I probably am).
Rather than being wrong you are right. That has been proven by all the countries that had it raging internally and reversed that process by getting the reproductive rate below 1. Spain is a very good example for CV19:
https://www.worldometers.info/coronavirus/country/spain/
You see Spain had a very rapid rise and a less rapid fall. Most draconian measures of all countries. China’s most draconian measures were applied in Wuhan.
Australia had a three prong approach – border control to prevent importing infection; quarantining as many of the population as possible in their own home and then manual contact tracing of those showing positive to CV19:
https://www.worldometers.info/coronavirus/country/australia/
The rapid rise followed by a rapid fall because the virus really did not get into the community. With the high initial R0 in crowded communities, hours mattered in getting people separated. The most effective of the three measures was border controls because the virus did not get going in the community apart from isolated outbreaks.
Taiwan by far the most effective. Got in early with border controls and just crushed the virus in a matter of days with good testing and electronic as well as manual contact tracing:
https://www.worldometers.info/coronavirus/country/taiwan/
Their pandemic was done and dusted in a single month!
It has been repeatedly stated by some political leaders that “No one is immune from this virus”. it is apparent from the fact that when Covid-19 invades some people it causes no, or very mild symptomatic effects, indicating some degree of immunity. The only thing I have seen reported that seems significant have been the posts by Monckton and one other post on WUWT about the possible impact of Vitamin D Insufficiency. I’ve read an analysis done by LSU where 86.4 percent of their ICU patients were Vitamin D insufficient or deficient. 100 percent of the patients under the age of 75 were insufficient or deficient. While I think this one small analysis is not enough to indicate that spending more time in the sun or supplementing with Vitamin will and possibly does render some immunity to some of the herd, it should be studied in relation to the relative health status and comorbidities of known patients. Any correlations can be applied to the models being used to predict herd immunity. But better yet if by simply spending a little more time in the sun or taking an inexpensive supplement most of us can live with this virus let’s find out.
“it is apparent from the fact that when Covid-19 invades some people it causes no, or very mild symptomatic effects, indicating some degree of immunity.”
That has most likely nothing to do with immunity because asymptomatic cases seem to have the same viral load as the worst symptomatic.
Therefore, it is probably something else that modulates severity of the symptoms. If we would figure that out we would have a target for a therapy that helps as long as there is no vaccine.
Herd immunity is just a euphemism for herd culling.
Right now in my state, there are counties with zero cases which are having their plans for reopening being rejected as not “conservative” enough — that is to say trying to reopen too quickly. The quacks have come to dominate public health temporarily, or they are reasoning using their limbic system, or fear, or superstition, or….
The acceleration of new cases declined precipitously in this state during the period March 15-21. The orders to close some public amenities, and begin social distancing came out on the 18th, so there was no way that this order caused the epidemic to become essentially steady state as the peak of transmission must have been before March 15-21 and the orders didn’t become effective until well after. I think the very susceptible population, for whatever reason, was smaller than people imagined. Epidemics burn themselves out and always have — some go away to never return, some maintain a small presence, some drift and reappear periodically as a scourge.
Nonetheless, not to let observation guide them in any way, our “public” broadcasters continue to beat the drum about a coming peak of infections in two weeks time. There is so much to learn about this disease and how we should respond more intelligently if it does reappear, but the propagandists among us are planning to sabotage it.
It’s not clear that Sweden is past peak as the article seems to suggest, but if it is it might be because the population of Sweden (my stereotype based on acquaintances and other observations) is overall culturally civic minded and generally highly educated and likely to “do the sensible and responsible thing” even if they are not forced to do so. It’s also a relatively sparsely populated country. I guess we in the US will find out what happens when restrictions are lifted in a denser population where people are often, well, not like that. I hope it all turns out well, but we definitely should watch the numbers as time progresses.
Sweden has the 7th highest recorded death rate at 322/million] , US has 10th highest at 247/million.
Of “proper” countries Belgium leads the pack at 751/million.
Norway, neighbouring Sweden, sits at 39th with 41/million.
Sweden claims a much lower infection rate than the US but has a lot lower rate of testing.
Time will tell whether different approaches lead to different long term health and economic results.
Will Sweden recover economically faster than Norway?
A stochastic simulation with two groups of “people”. One lot that has frequent interactions with the public and one group with few interactions – plus details regarding the probabilities – would quickly show that the infection dies out when only around 20% of the population has antibodies.
Changes of policy such as encouraging young people to get harmlessly infected in school and protecting the elderly would be the best approach. There is little new about this version of influenza. Its epidemiological behaviour is well-understood.
It is amazing that they use models like that of the arrogant idiot Ferguson.
There seems to be a wilful ignorance of the most fundamental issue.
Does surviving COVID-19 give you effective immunity against reinfection? If so, how long does that immunity last? We do not have an answer to that yet, and so the concept of ‘herd immunity’ might not be applicable to this at all.
What if this behaves like Herpes? It goes into remission, apparent recovery, but it is still present in the body where the immune system can’t attack it, and when the body is stressed, it can emerge, and the person becomes sick and infectious all over again.
As for Sweden, you seem to rely on the fact that the Government didn’t implement a ‘lockdown’, but perhaps most sane Swedes implemented their own form of that and that is what you claim is evidence the lockdown was useless.
The biology of CV19 is completely different to herpes and HIV. The genome is RNA and there is no retro-transcription. It seems very unlikely that there will be latent infections although degraded viral particle shedding may continue during recovery.
Last message. In Poland, a doctor was cured who took care of Covid-19 patients in a nursing home. He was hopeless. After administration of a humanized monoclonal antibody against the interleukin-6 receptor, he came back to life and was able to say hello to his children and wife. One wise professor saved him.
https://en.wikipedia.org/wiki/Tocilizumab
This man is a hero. He treated the sick, although he fell ill himself. He should die, but the medicine helped.
This is what is called clutching at straws.
There were 5 restaurants closed in Stockholm on 27 April. They were the worst offending for breaking social distancing rules. Then we see a drop in CV19 cases in early May in Stockholm and claim it is the result of herd immunity – what a joke.
Meanwhile Sweden plods along its path of infecting 600 people each day with CV19 resulting in about 80 deaths per day. No Swede can visit their parents in aged care facilities for the foreseeable future. Swedes will still be social distancing in 2025.
A clever country simply crushes the virus. Taiwan closed borders with China in January. Implemented social distancing, used the Chinese developed testing kit to confirm infection of sick people then applied their efficient contact tracing process. So far 440 cases and 6 deaths. Last death was early April; now more than a month ago. Their pandemic took just 31 days to crush. Economic impact measured in points of a percent.
Sweden is a joke. All the silly charts above to try to justify killing people.
Those who doubt any of what I write. Go to this link:
http://91-divoc.com/pages/covid-visualization/
Look at the first chart then select Sweden and compare with Taiwan. For that matter select Spain and compare with Sweden.
There are still dingbats in this would who do not think quarantine is effective against microscopic virus and bacterium. Take a lesson from history and William Mompesson:
https://www.bbc.com/news/uk-england-35064071
Because it was not as bad as first thought in terms of cases.
Have you seen this?
https://www.zerohedge.com/markets/computer-model-locked-down-world-turns-out-be-shtcode?utm_campaign=&utm_content=ZeroHedge%3A+The+Durden+Dispatch&utm_medium=email&utm_source=zh_newsletter
“Results
We characterized 8 novel recurrent mutations of SARS-CoV-2, located at positions 1397, 2891, 14408, 17746, 17857, 18060, 23403 and 28881. Mutations in 2891, 3036, 14408, 23403 and 28881 positions are predominantly observed in Europe, whereas those located at positions 17746, 17857 and 18060 are exclusively present in North America. We noticed for the first time a silent mutation in RdRp gene in England (UK) on February 9th, 2020 while a different mutation in RdRp changing its amino acid composition emerged on February 20th, 2020 in Italy (Lombardy). Viruses with RdRp mutation have a median of 3 point mutations [range: 2–5], otherwise they have a median of 1 mutation [range: 0–3] (p value < 0.001)"
https://translational-medicine.biomedcentral.com/articles/10.1186/s12967-020-02344-6