Posted on March 24, 2020 | Winter sea ice maximum extent on March 5 was the highest since 2013
The most positive thing that US National Snow and Ice Data Center sea ice experts could say about this year’s winter sea ice maximum was that it wasn’t a record breaker. But it provides ample polar bear habitat when the bears need it most: just before the critical spring feeding season.
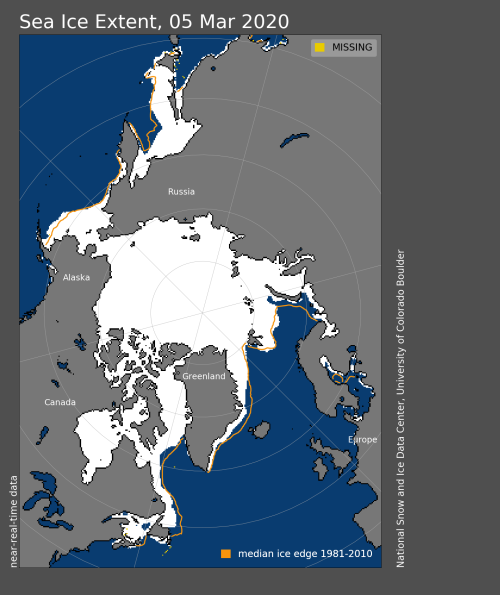
In fact, they said: “The 2020 maximum sea ice extent is the eleventh lowest in the 42-year satellite record, but the highest since 2013.” All that winter ice is essential polar bear habitat just before the critical spring feeding season (Crockford 2019, 2020) and it’s one of the reasons that polar bears are thriving.
The table included in this year’s maximum sea ice report was a list of the ten lowest years since 1979 and 2020 wasn’t on it. The winter max extent for 2020 was 15.05 mkm2.
The report also noted that, “for the Arctic maximum, which typically occurs in March, the uncertainty range is ~34,000 square kilometers (13,000 square miles), meaning that extents within this range must be considered effectively equal” and made special pains to point out that “maximum extent is not predictive of minimum extent“.
In other words, don’t get your hopes up that ample sea ice this winter will mean abundant sea ice at the end of summer.
NSIDC Masie graphs for 5 March below, by region starting with the Northern Hemisphere:

The Baltic Sea and Sea of Okotsk (below) are included in the Arctic total but polar bears don’t live there, so the lower than usual ice levels in those regions this winter have had no impact on available polar bear habitat.


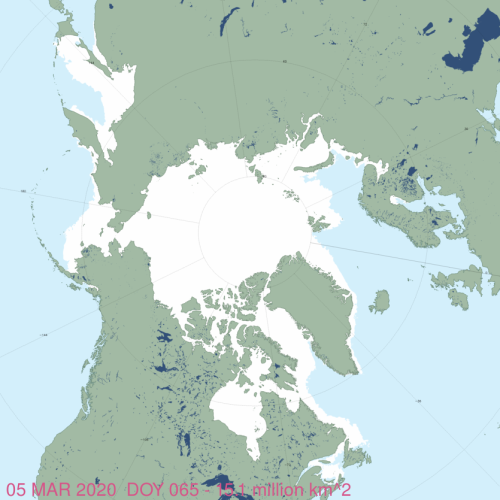
NSIDC Masie ice chart for 5 March 2020 puts the total ice extent at 15.1 mkm2:
References
Crockford, S.J. 2019. The Polar Bear Catastrophe That Never Happened. Global Warming Policy Foundation, London. Available in paperback and ebook formats.
Crockford, S.J. 2020. State of the Polar Bear Report 2019. Global Warming Policy Foundation Report 39, London. pdf here.
“The 2020 maximum sea ice extent is the eleventh lowest in the 42-year satellite record..”
That was worth commenting on as if it was highly significant and a source of worry? Really?
How pathetic can you get? Talk about clutching at straws when the data isn’t following your catastrophic narrative.
Compared with the summer minimum, the winter maximum doesn’t vary that much. It’s quite possible to have a normal winter maximum and a record low summer minimum like in 2012.
The thing that is more predictive of the durability of the ice is its thickness.
Don’t forget how rotten the ice is. /sarc
“Something is rotten in the state of Denmark.”
Shakespeare was obviously one of the first employees at the NSIDC.
Bob , the point is when the summer min stopped providing OMG headlines, they realised they could OMG the lower spring max. Then it was the “lowest January every” , then it was “the lowest 12th February on record” ….. as if all that actually meant anything.
It’s all about deflecting attention from the fact that the last two years’ summer minimum was indistinguishable from that of 2007 when all panic and hyperbole about “ice free ( well not *really* ice-free ) summers” started.
“…the winter maximum doesn’t vary that much.”
True, because it’s geographically semi-constrained. When the ice reaches a coastline, that’s all, folks. It can pile up, but no more square kms in that direction.
“The thing that is more predictive of the durability of the ice is its thickness.”
Right. Let’s all go out and measure it.
It was higher than 1974.
See Parkinson and Cavalieri, JOURNAL OF GEOPHYSICAL RESEARCH, VOL. 94, PAGES 14,499-14,523, OCTOBER 15, 1989
Taking bets as usual that third week in September 2020 will be below four million square kilometres. No takers dammit.
Yes – but just wait for the excuses that limited recovery is just due to Covid!
URGENT MESSAGE
The Government is running out of excuses to panic the nation with. Could any believers in Alien Invasion, Yellowstone Eruption or Zombie Apocplypse submit any warnings they may be able to create to the National Office of Scares, who will convert these into semi-believable semi-scientific wording and issue it together with instructions to run for the hills….
Not exactly new, but maybe we could resurrect this one.
https://thepeoplescube.com/current-truth/anthropogenic-continental-drift-an-incoherent-truth-t1668.html
Let me try this again. Sorry if this appears twice. Maybe we can resurrect this:
https://thepeoplescube.com/current-truth/anthropogenic-continental-drift-an-incoherent-truth-t1668.html
…and then there’s the Continental Drip Theory: The majority of peninsulas, continents, capes, etc. on the earth drip from north to south. This is obviously being caused by global warming, causing the land to slowly ooze southward.
“maximum extent is not predictive of minimum extent”
Is this really true ?
Yes. Look at record low summer minimum year of 2012, which enjoyed a high winter maximum.
Griff is notorious for predicting new lows based upon low maxima. Always wrong.
What matters to minima is WX in August and September. If there be late summer cyclones, sea ice minimum will be low, as in 2007, 2012 and 2016. In the latter year, there were two cyclones, which spread out and pile up flows.
Hey! I miss Griff. Here’s why:
My good friend Dr. Dave, a talented specialist physician, often rants about the stupidity of the average human. I have to remind him that if the average human were a lot smarter, he would no longer be of above-average intelligence.
“Hey Dave, if people were a lot smarter, you wouldn’t be so smart anymore.”
Thank you Griff and all the warmist hysterics out there. You make us look good. 🙂
IMO Griff’s latest avatar is Loydo.
Yes Stevek, this site is great for answering those kinds of questions:
https://nsidc.org/arcticseaicenews/charctic-interactive-sea-ice-graph/
… as I posted above.
Of course – the Arctic is pretty much bound to be dark and cold each winter. It freezes. Its at the margins where there is variation. The summer any amount could melt.
The variation is mostly at the open sea margins. Of course there’ll always be ice at the poles: it’s that old T⁴ heat dump to outer space temperature.
Stevek,
Look up the concept of “ice arches.”
Thick ice blocks the straits (ex: Fram Strait) and prevents ‘bergs from migrating south into warmer water, where they melt. Water does pass under the arches, but the floating ice stays north.
Episodically storms with wind and waves will burst the arches.
Episodes are not predictable.
2007 was such a year and there is text and animations of this.
This is called “damning with faint praise.”
One of the most toxic products on the face of the earth is Coca-Cola. And not because of the caffeine — it’s the sugar and teeth-corroding carbonation. The adoption of the Polar Bear by that company as a branding leviathan, a lovable, heartwarming and funny fuzzy fumtious huggy, has done as much harm.
Meanwhile, every gain by polar bears is a death-knell for baby seals, who are torn limb from limb, eaten alive in front of the mother seals. By the millions. This is only diversified by male bears cannibalizing any polar bear cub they did not father, if they can get past the ferocious female bears who expend tremendous energy protecting them from such a fate.
This is cynically called the “spring feeding season.”
People love their Polar Bears, so cute. They will label carbon dioxide “pollution” to save the bear. And never mind their teeth and their arteries.
And never mind the war against arguably the most life-enhancing product in history: energy from the burning of fossil fuels.
windlord-sun brings up an important dichotomy: some people are in favor of the tuna and not the sharks, and the offset, some people are in favor of the polar bear and not the baby seals. It’s a bipolar world (literally!) we live in.
Because the ice is so thin and made up mostly of first year ice these days it doesn’t take much to melt, so today 20 days later its now lowest for the date in 40 years. So easy to pluck dates.
https://ads.nipr.ac.jp/vishop/#/extent
Agree about plucking. We should not pluck at all. We should show extent in spaghetti maps all the way back to the start of the Holocene, and when the ice disappeared completely for a thousand years, have some sort of null line.
By clearly graphing the ice as a sine curve, nature’s favorite rocking motion, short-term ups and downs are not totalized into panic.
“We should not pluck at all” !!!
That’ll sort the population levels out
If they are not going to create panic, what’s their purpose?
windlord-sun March 26, 2020 at 3:47 am
Agree about plucking. We should not pluck at all. We should show extent in spaghetti maps all the way back to the start of the Holocene, and when the ice disappeared completely for a thousand years, have some sort of null line.
—————–
That is just pathetically ridiculous!
why 1000 years ? why not 4,000,000,000 years
Its like all those plots of temperature showing how if current temps are plotted at a scale of -40 to +50°C – its a flat line so therefore no problem
Why not plot covid-19 deaths on a sensible scale of 0 to 7,500,000,000 (world population) you would then be able to say no problem any death is immaterial and can be ignored – get out there to those empty churches, football stadia, party-party=party. There is no problem!!!
please be sensible if possible
stay safe
Ice extent during the Holocene, and compared to prior interglacials are the most relevant possible data. They show that sea ice waxes and wanes cyclically naturally.
That it’s down from its 20th century high in the 1970s has nothing to do with a fourth molecule of plant food per 10,000 dry air molecules. If CO2 were the cause of Arctic decline, then why did Antarctic sea ice grow from 1979 to 2014?
The fact is that Arctic sea ice is still far above its level for most of the Holocene. As is to be expected at this point in an interglacial.
Or you could look at the number of deaths each day, week, month, year, and see that so far, there is not the slightest sign of CV in the data. People dying (associated mainly) with the disease are mainly those who would have died anyway. Please be sensible if possible, and understand what data is.
Yes if detrended tabulated daily death data for 2019 and 2020 were placed alongside each other then I’m pretty sure that the difference would be so small that nobody could tell which was which.
Jacinda, the idiot child who has never had a real job, is destroying the NZ economy. In NZ ten million dollars of economic damage equals about one early death is my guess from what is spent on health care in NZ.
The troll whines that only the cherry picking he supports is valid.
“Why not plot covid-19 deaths on a sensible scale of 0 to 7,500,000,000 (world population) you would then be able to say no problem any death is immaterial and can be ignored – get out there to those empty churches, football stadia, party-party=party. There is no problem!!!”
Or once you perceive there’s a problem you bankrupt the majority with lockdown for a couple of months limiting US death rates to that of 2017-18 flu season patting yourself on the back at what a great job you’ve done and expect rinse repeat next season.
Hey we have to go even harder longer folks to nail these perpetual bugs that plague us. Umm… what about our economic wellbeing? Don’t you care about the bugs in the environment killing people? Shame on you and shutup and pay more taxes to lick this problem just as the WHO has demanded.
You could plot the effects versus the total number of living things on earth on a time scale that goes back to the big bang.
That would make some people happier by making them realize that their problems really aren’t very important. It could also make some people very cynical if they feel that nothing they do makes any difference.
It should make the global warmists less certain that they are gods who can control the earth itself by taking away other people’s SUVs
Yes, as the DMI volume model shows it has been tracking as lowest on record……
http://polarportal.dk/fileadmin/polarportal/sea/CICE_curve_thick_LA_EN_20200325.png
“lowest on record” …. when you limit your record to the last five years. Like Loydo’s Jap site which only plots 1st lowest, 2nd lowest, 3rd lowest. ie only presents a deliberately biases window and does not allow any independent data selection.
That politics, not science. Just because you have a graph does not make it science, it makes it sciency.
*Measured* arctic sea ice volume is stable all year since record began in 2011. Ocotber ( first month available after sept min ) has been gaining steady since 2012.

https://climategrog.wordpress.com/cpom_arctic_ice_vol_mths_2019-2/
April and September ice volumes are on a steady decline according to those you measure the volume.
http://psc.apl.uw.edu/wordpress/wp-content/uploads/schweiger/ice_volume/BPIOMASIceVolumeAprSepCurrent.png
Wake me up when the Arctic is free of ice
A piddlingly short record, starting at the extreme anomalous high of the late 1970’s which was up with the extreme extents of the LIA.
There is still FAR more sea ice in the Arctic than there has been for most of the current interglacial
My knowledge is lacking in this area. If the 1970’s had ice levels similar to the little ice age, what was the reason for that? It wouldn’t be temperature since there were many many decades of warming in the time between.
How would whatever this effect was be playing into the current ice levels?
Temperatures were cooling from the 1940s to the 1970s. (or at least they were until the temperature sets were “adjusted” to make the past cooler).
Yes, but the temperatures were not nearly as cool as the little ice age (at least overall.
Is the ice amount driven by local temps (is the trend different than world-wide trends), is it driven by ocean currents, perhaps by precipitation?
Maybe arctic sea ice isn’t directly related to world-wide temperature trends,
Is it? They make mo claim there. And the 2nd lowest is higher than the 3rd lowest.
That’s why the icebreakers had problems to reach the Polarstern, for days no chance to move trough meter thick ice.
And shure, their planes got a landing piste within days, all beccause ice is tp thin.
Your post as usual worth a laubgh 😃
Correction, should better say runway for their aeoroplane.
https://follow.mosaic-expedition.org/
Choose English and follow comments as per March 17th.
The Kapitän Dranitsyn had to be drawn out of to thick ice by the icebreaker Admiral Makarow, that was on the way for fuel needed by K. Dranitsyn
 ?w=1024&h=839
When you wrote “piste” I wondered when the first round saber matches were starting! 😀
Addendum:
Icebreaker Trapped Resupplying MOASiC
At the bottom of the page some hints about “thin ice” 😀
According to NSIDC, it’s still higher than 2019, 2018, 2017, 2016 and 2015 on this date.
Inconvenient truth.
Hmmm, now how can we spin this into a negative?
Easy. All years higher than the 2012 record low are just weather.
Even if 2012 still be the low in 2042, that’s all just weather. As we learned during the so-called “Pause”. No matter how long the world goes without any warming, it’s all weather. Only brief natural warming spells count as climate.
“According to NSIDC, it’s still higher than…”
No inconveniently its the lowest.
https://nsidc.org/arcticseaicenews/
Nothing there to indicate lowest. However if we use the Charctic Interativr for all years the downturn gets lost.
https://nsidc.org/arcticseaicenews/charctic-interactive-sea-ice-graph/
perhaps you should look at all years and not use your “best” guess.
You might be right, it looks like there are 4 or 5 years lower for the date according to that plot. This plot shows 2020 currently in second behind only 2017.
https://ads.nipr.ac.jp/vishop/#/extent/&time=2020-03-26%2000:00:00
This is why 2020 has gone from unremarkable to now almost a frontrunner.
https://twitter.com/ZLabe/status/1243211454121005057/photo/1
loydo, “This is why 2020 has gone from unremarkable to now almost a frontrunner.”
So now it is not the frontrunner. Now that’s funny.
Chartic shows the average of the last 5 days, not today’s data, the last two days have shown rapid drops which Chartic has smoothed out.
But Al Gore and Peter Wadhams et al assured us that the ice would be gone by now!
So, what do they measure, if there is no ice at all ?? 😀
But let’s live Al Gore some weeks in the Arctic, it will recover again 😀
Obviously false. Unless the majority of Arctic sea ice melted last summer, the majority cannot be first year ice now.
Logic not the strong suit of Alarmists is it?
Try and get your facts straight and don’t just rant at Loydo. Summer ice minimum (median average for 1981-2010 is around 6 million km² and winter maximum is around 15 million km², which means that there is about 9 million km² of first-year ice – EVERY WINTER. And the majority (9 million out of 15 million is 60 percent, which was a majority last time I looked) DOES melt every year.
“Logic not the strong suit of Alarmists is it?“. Not exactly monopolized by skeptics either, is it?
But as there is not all ice melting, there too is a rest of ice older than one year.
In so far, you calculation is for the…. (is wrong)
It might help to remember that ice coverage is based on 15% of the water covered in ice, not 100% coverage.
Well last September the ice extent was ~4Mkm^2 and the Maximum this month was ~15Mkm^2, so that means that 73% is first year ice.
Loydo, please bookmark this site. It will help you with correcting your ability to say something stupid on here every time you post:
https://nsidc.org/arcticseaicenews/charctic-interactive-sea-ice-graph/
I don’t need a calculator to know that 2007 is well within the past 40 years.
To all, it’s a good site and you can customize your own spaghetti graph as well as correcting the rabid nitwits who come on here.
“So easy to pluck dates.”
As she busily plucks dates.
NSIDC shows current ice extent higher than 2015-2019, 2011, 2005-2007.
Your link managed to “pluck dates” that omitted the above years, do they not lie within the last “40 years?”
loy-doh,
there is one heck of a lot of sea ice up there.
FAR more than for nearly all of the current inter-glacial,
Don’t let that fact get in the way of your ignorant comments.
It has always been mostly first year ice since a lot of it melts in summer. And of course it is entirely so at the southern extremities which are now starting to melt.
And no it isn’t “lowest for the date in 40 years”, it’s the lowest since 2017:
http://masie_web.apps.nsidc.org/pub/DATASETS/NOAA/G02186/plots/4km/r00_Northern_Hemisphere_ts_4km.png
Incorrect. I said “for the date” the date was the 25th. It’s still dropping sharly, not surprising because the ice is so much more vulnerable these days.
Millikilometers squared?
Probably bad form to change it Mkm2, also. Flr instance, we say cc interchangeably with cm3. We don’t mean 1/100th of a m3 when we say that, we mean 1cm x 1cm x 1cm.
Excerpt from article:
Just sa mor “junk science” agitprop being touted by the “anthropogenic warminists”.
The Polar Bears would do just fine without all that winter sea ice, ……. but ya can’t say the same for the female Polar Bears or their pups.
The pups especially, …. would be in BIG, BIG trouble.
I do not agree with the number of the article, as per March 4th – 15.05 Mio qkm:
ftp://sidads.colorado.edu/DATASETS/NOAA/G02135/north/daily/data/N_seaice_extent_daily_v3.0.csv
notes 15.155 Mio qkm
2	29	15.030

3	1	15.037

3	2	14.964

3	3	15.032

3	4	15.155

3	5	15.048

3	6	14.971

3	7	14.911

3	8	14.910

3	9	15.007

3	10	15.025

3	11	15.088

3	12	15.022
http://camargue-flamenco.de/Upload/ASEact.png
as per March 18th
Not as good as I hoped. Winter freeze started slow like last year, accelerated ++ like last year, got to a really good level and fizzled out. Going down rapidly at moment but always goes the opposite of what one thinks.
The rate if recovery, at times, was stunning.
Why not say that the 2020 maximum is at 96% of the median ?
Watching a little TV last night with my honey. A WWF fund raising commercial comes on featuring the plight of the polar bear. All the usual tricks of the advertising trade pulling hard at the viewers heartstrings. I said “I cant believe they are still using the polar bear to raise funds” She responded “why, Isn’t it endangered” Even a well educated person who rightfully prides themselves on having evidence based beliefs can be drawn to the wrong conclusions. That’s the power of the lie repeated over and over again until it becomes accepted truth. I think we have a built in susceptibility to the most obvious of lies presented the right way. What we seem to disbelieve is that people will tell the most amazing lies to reach their goals. Bernie Madoff never invested his clients money in the markets. He simply stole it. WWF is Bernie Madoff.
From the article: “The table included in this year’s maximum sea ice report was a list of the ten lowest years since 1979 and 2020 wasn’t on it.”
The year 1979 was one of the coldest since the early 20th century, so it is to be expected that arctic sea ice would decrease during the warmup from 1979 to the present, just like arctic sea ice decreased during the warmup from 1910, the previous cold period, to 1940.
Arctic sea ice increased from about 1940 to 1979.
The Earth’s temperatures cool for a few decades and then they warm for a few decades and then they cool again.
During the cooling decades from the 1940’s to the 1970’s it cooled so much some climate scientists were claiming the Earth was cooling into another Ice Age.
Then the temperatures started warming in the 1980’s for decades in a row, and some climate scientists are claiming this rising temperature trend will continue to the point of causing enormous destruction to the inhabitants of the Earth.
What we can learn from this is that some climate scientists think trends will continue forever, whether up or down. We should be skeptical of people who make such claims. They apparently cannot see the “Big Picture” (the cyclic nature of the Earth’s weather).
Arctic sea extent from 1953-2018 shows a fairly steady decline.

In the 1970’s, science was 6:1 warming:cooling.
https://journals.ametsoc.org/doi/abs/10.1175/2008BAMS2370.1
Yes ?
http://camargue-flamenco.de/Upload/ASEact.png
Aha…..
Trend was up c. 1887 to 1916, down c. 1917-46, up 1947-76 (the PDO flipped in’77), down 1977 to 2006, flat to up since then. Natural cycles of around 30 years. On the longer time scales, Arctic sea ice has trended up since the end of the Holocene Climate Optimum, ~5200 years ago.
Do you have a citation for that assertion?
Never heard of the “Neoglaciation”, Jack ?
Why do you continue to DENY climate history ?
Yes.
https://www.cato.org/publications/commentary/global-warming-apocalypses-didnt-happen
Northern Sea Route was open during the ’30s and WWII, then needed atomic icebreakers.
A newspaper article is your source. And one that does not attempt to verify its claims.
“It is clear that summer temperatures are rising faster than winter temperatures
are rising, but again that 1922 was a purely LOCAL event in Spitzbergen, not a
REGIONAL one. ”
http://www.globalcoral.org/_oldgcra/LONG%20TERM%20ARCTIC%20ICE%20TRENDS%20AND%20GLOBAL%20WARMING.1.pdf
AS for the North Sea Route, portions were open:
In the 1920s the newly established Soviet Union began developing the Northern Sea Route as a shipping lane, and domestic cargo ships started using portions of it during the summer months in the 1930s; the first successful one-season through-transit of the passage was by a Soviet icebreaker in 1934. Portions of the route were used between 1942 and 1945 during World War II by ships carrying Allied supplies from cities on the U.S. West Coast to ports in northern Siberia, notably Tiksi at the eastern edge of the Lena River delta. Domestic regional shipping grew after the war, made easier by improved navigational aids, a growing fleet of icebreakers to allow passage through the sea ice, and a lengthening shipping season—the latter having become year-round in the western section by 1980.”
https://www.britannica.com/topic/Northeast-Passage
I look forward to reference to counter that.
You might be interested in Peter Gwynne’s comment about the 1970’s cooling article he wrote for Newsweek.
https://www.insidescience.org/news/my-1975-cooling-world-story-doesnt-make-todays-climate-scientists-wrong
JD, “1970’s cooling article he wrote for Newsweek.”
You mean the one the alarmists insist never occurred?;)
Please find a quote from me that indicates that I made such a statement.
JD please give a quote from lee where he claimed you, specifically, did.
There seems to be some confusion here.
This was the comment to which I was referring to comment to lee. :
lee March 27, 2020 at 1:53 am
JD, “1970’s cooling article he wrote for Newsweek.”
You mean the one the alarmists insist never occurred?;)
The request from me that you quoted was with reference to this comment.
John Tillman March 26, 2020 at 9:46 am
Trend was up c. 1887 to 1916, down c. 1917-46, up 1947-76 (the PDO flipped in’77), down 1977 to 2006, flat to up since then. Natural cycles of around 30 years. On the longer time scales, Arctic sea ice has trended up since the end of the Holocene Climate Optimum, ~5200 years ago.
No Jack, that graph is a farce, as it bears no relationship to Arctic temperatures.
This one is far closer to reality.
And the reality is that there is FAR more sea ice up there than for nearly all of the last 10,000 years
Don’t be a climate change denier, Jack.
I do not deny climate change? But as a true skeptic I need to verify your evidence. Please post the links to the studies.
Jack Dale
Thanks for reminding us about this good old stuff about warming vs. cooling, misrepresented ad nauseam by so many bloggers.
And in order to convince the German Krishna goose below, we should add NSIDC’s monthly data for 1979-2020, first in absolute form (including area aka 100% pack ice), and then in anomaly form:
https://drive.google.com/file/d/1oCz4CpngfnxglQY8ZIXpi0IAhzePPQyL/view
Linear estimates over absolute values for 1979-2020, in Mkm² / decade:
– extent: -0.57 ± 0.12
– area: -0.26 ± 0.12
Estimates since 2007:
– extent: -0.68 ± 0.73
– area: -0.55 ± 0.74
When using absolute values within short periods of time, the standard errors become absurdly high due to the strong seasonal deviations, and therefore lack statistical significance.
For the umpteenth time, let us repeat that anomalies removing seasonal dependencies (in Roy Spencer’s jargon: ‘the annual cycle’) are not an instrument to produce faked data.
https://drive.google.com/file/d/1EO6TkEqrpenslDHtAyXxDVLPb_WochT2/view
Linear estimates over anomalies wrt the mean of 1981-2010 for 1979-2020, in Mkm² / decade:
– extent: -0.55 ± 0.02
– area: -0.24 ± 0.02
Estimates since 2007:
– extent: -0.46 ± 0.11
– area: -0.35 ± 0.11
The melting season has become less strong since 2007; but conversely, the ice rebuild season did not, especially not as far as pack ice is concerned.
J.-P. Dehottay
Source
ftp://sidads.colorado.edu/DATASETS/NOAA/G02135/north/monthly/data/
What parameter are you using for sea ice extent.
“Extent defines a region as “ice-covered” or “not ice-covered.” For each satellite data cell, the cell is said to either have ice or to have no ice, based on a threshold. The most common threshold (and the one NSIDC uses) is 15 percent, meaning that if the data cell has greater than 15 percent ice concentration, the cell is considered ice covered; less than that and it is said to be ice free. ”
http://nsidc.org/arcticseaicenews/faq/
Jack Dale
“What parameter are you using for sea ice extent.”
Ooops?!
What a strange question. Didn’t you look at the source?
It is the original NSIDC sea ice data, hosted within ‘colorado.edu’.
Sea ice extent is defined everywhere as ‘sea surface having at least 15 % ice’.
And that is valid for their data as well.
The only difference is that colorado.edu also maintains ‘area’ data, i.e. pack ice.
All others AFAIK only maintain extent data.
J.-P. D.
Thanks
You will me convince of what ?
That the data and the graph I shared are wrong ??
But I’m convinced of the fact, you can’t comment without personal attack / insult. So you are noncredible and from my point of view a person ot worth to discuss with.
Bye
Masie cannot be used for year to year comparisons
MASIE graphs are not applicable to trends.
“Use the Sea Ice Index when comparing trends in sea ice over time or when consistency is important. Even then, the monthly, not the daily, Sea Ice Index views should be used to look at trends in sea ice. The Sea Ice Index documentation explains how linear regression is used to say something about trends in ice extent, and what the limitations of that method are. Use MASIE when you want the most accurate view possible of Arctic-wide ice on a given day or through the week. ”
https://nsidc.org/data/masie/masie_faq
The current Sea Ice Index shows a steep decline with current levels at almost 2 SD below the mean.
The whole Arctic hasn’t been unusually cold this winter, but Alaska & the Svalbard Island area have been.
Can you imagine, that the researchers on Polarstern told to wait for rain as the warming in Arctis is so much higher as elsewhere ?
PS
At the bottom of the page, you find all weather data, mouse-over, you see the corresponding position where the data has been measured
https://www.dwd.de/DE/fachnutzer/schifffahrt/maritimberatung/mosaic/polarstern/polarstern_node.html
According to the UA data the Arctic continues to warm at twice the rate of the rest of the globe.
https://www.nsstc.uah.edu/data/msu/v6.0/tlt/uahncdc_lt_6.0.txt
Obviously:
http://ocean.dmi.dk/arctic/meant80n.uk.php
Arctic continues to warm at twice the rate of the rest of the globe
Even if, what does it mean ?
Ice melting ? No.
Ice melting is due to water temperatures, not air temperatures. See the data staying below 0°C most of the time, anomalies are not of interest here.
The extend is driven by wind and storm pressure.
So come with real news, please
Yes, and perhaps vast areas of the Arctic might warm up enough to be alittle more habitable. A plus for humanity & life in general.
Bods are not habitable. When permafrost melts it turns into a bog.
Also exposes buried Greenland burials 😉
Like melting glaciers expose tree stumps from 3000 years ago.
Funny that any permafrost melting is usually around villages.
Still FAR more sea ice than there has been for most of the last 10,000 years, Jack
Don’t be a climate change denier.
There are insufficient stations to reach such a conclusion, but even if true, so what? If the planet warms one degree per century (as it hasn’t, but for sake of argument say it has), then the Arctic has warmed two degrees C. Essentially all of that will be from Oct 15 to April 15, so the north polar region will have gained an average of four degrees during its six coldest months, going from average of -28 to -24 degrees C. Sounds like a win to me.
UAH data is satellite data, not land stations.
The TREND of Arctic warming, not the seasonal difference, is twice that of the rest of the planet.
As the Arctic warms, permafrost melts, releases methane and turns into bog. Not good.
Only land stations showing warming are in the expanding urban type centers.
Here are some real temperatures for Arctic stations.
Notice anything?
I notice that you post graphs with links to the sources. That triggers my crap detector.
nice fred you left out many stations AND hid the satellite data.
is your middle name Mann?
wrong John,
plenty of stations, as confirmed by satellites.
“According to the UA data the Arctic continues to warm at twice the rate of the rest of the globe.”
At least 50% of the time 😉
UAH NoPol this century.
No warming apart from the effect of the 2015/16 El Nino, now basically gone.
You are mis-imformed , as always, Jack !
The El Ninos affected more than just the Arctic.
The Arctic trend 0.25
The global trend 0.13
nearly gone, Jack
Do you really “believe” that El Ninos are anthorpogenic.. seriously
Far more sea ice up there than for nearly all of the last 10,000 years.
Don’t be a climate change denier, Jack
No I do not assert that El Ninos are anthropogenic (note spelling). And I never indicated such.
I do not deny that climate changes and I not deny climate science.
If you point on typos, it’s El Niño
fred250
“Only land stations showing warming are in the expanding urban type centers.”
*
I suppose you wanted to write
“Only land stations in the expanding urban type centers are showing warming.”
Would make a bit more sense I guess.
*
1. To show a few cherry-picked stations among over 1500 for the latitude bands above 60N: that is completely useless.
Here is a graph with an anomaly plot (wrt 1981-2010)
https://drive.google.com/file/d/10goUcu43ZxvtwCQY0kRWgAM2LAupsjeR/view
for the Siberian station Verhojansk
https://tinyurl.com/ungfabl
located in the middle of nowhere in Northeastern Siberia. It is together with Ojmjakon one of the coldest places in the NH.
Linear trends in °C / decade:
– 1925-2020: 0.19 ± 0.03
– 1979-2020: 0.41 ± 0.10
Notice something around the Golden 1930s ?
Of course: people like you are quick with claims a la ‘this station certainly is worst-sited’, etc etc. I know enough of such incompetent claims, based on nothing verifiable.
Here is thus a second graph comparing, within CONUS
– 71 USHCN stations, well-sited according to surfacestations.org;
– all available GHCN daily stations for CONUS (over 8000 during the satellite era).
https://drive.google.com/file/d/1pbQCHFwTTy1HIns9pDNj6mDQ85Vau7NC/view
And to show the comparison for two isolated stations, look at a graph comparing
– the so-called ‘worst-sited’ UHI airport station AK Anchorage Intl AP
with
– the pristine USCRN station AK Kenai, located about 50 km away in a forest:
https://drive.google.com/file/d/1OhCuDiAFUT80Ws4S8XopciaWQTp4rorn/view
*
What now concerns you NoPol stuff, please let me laugh a bit.
Here is a chart comparing UAH’s original NoPol series with one within which the 2016 peaks were smoothed away (but… WITHOUT compensation by smoothing drops away, huh):
https://drive.google.com/file/d/1OOsLs5kb04qJaGvJniChNXHZHsglmfK8/view
You see the giant difference between blue and red…
Linear trends for 2000-2020, in °C / decade, 2 sigma:
– original: 0.235 ± 0.05
– all 2016 peaks off: 0.221 ± 0.06
It’s sooo easy to cherry-pick a flat period like 2000-2015, which ‘by accident’ shows a trend of 0.05 °C / decade!
I appreciate sound skepticism. No science without it.
But what you are doing here, fred250: that is pseudoskepticism.
Feel free to come back here when you have more intelligent points to debate!
J.-P. Dehottay
Off topic, I’m sure but most posts this far down the list are mostly that.
I have been told The Polar Soda Company, Worcester, Mass took on the Coca-Cola outfit about using polar bears in advertising and won. Don’t recall any recent C-C ads with cuddly cuties in it. Also there is/was a Polar Brewing company in Maracaibo, VZ that turned out a very respectable pilsner.
“Recent mapping of a number of raised beach ridges on the north coast of Greenland suggests that the ice cover in the Arctic Ocean was greatly reduced some 6000-7000 years ago. The Arctic Ocean may have been periodically ice free.”
How did the cuddly Polar Bears survive?
https://phys.org/news/2008-10-ice-arctic-ocean-years.html
That would at the Holocene Optimum. Not a big surprise
So you admit that ice is just beginning to form. We just don’t know the std. deviation about the mean, ie. what normal variation is as it grows.
” The Arctic Ocean may have been periodically ice free.”
Your assumption does not necessarily follow.
“So you admit that ice is just beginning to form. “
As of today Antarctic sea ice is right about on the average.
Here are the daily Arctic sea ice extent measurements from
ftp://sidads.colorado.edu/DATASETS/NOAA/G02135/north/daily/data/
– one showing absolute values:
https://drive.google.com/file/d/1-rIi_Ml6yinPkUWPDFPz4VEy9BUX4fZL/view
– one showing departures from the mean of 1981-2010:
https://drive.google.com/file/d/19I6WWxw-xavC0H7K7tS_Ocef8BE2gzcs/view
(looking at anomalies often gives us a better view on what happens).
Thus, if I well understand, March 5 was chosen because it was this winter’s top peak value, isn’t it?
Great idea.
J.-P. D.
opps,
what happened
https://nsidc.org/data/masie/masie_plots
Report from 1817:
“It will without doubt have come to your Lordship’s knowledge that a considerable change of climate, inexplicable at present to us, must have taken place in the Circumpolar Regions, by which the severity of the cold that has for centuries past enclosed the seas in the high northern latitudes in an impenetrable barrier of ice has been during the last two years, greatly abated.
(This) affords ample proof that new sources of warmth have been opened and give us leave to hope that the Arctic Seas may at this time be more accessible than they have been for centuries past, and that discoveries may now be made in them not only interesting to the advancement of science but also to the future intercourse of mankind and the commerce of distant nations.”
President of the Royal Society, London, to the Admiralty, 20th November, 1817 [13]
*13 President of the Royal Society, Minutes of Council,
Volume 8. pp.149-153, Royal Society, London.
20th November, 1817.