Reposted from Dr. Roy Spencer’s Blog
March 22nd, 2020 by Roy W. Spencer, Ph. D.
Some global warming alarmists are celebrating the current economic downturn as just what is needed to avert climate catastrophe. I’ve seen a couple estimates that China’s manufacturing and commerce might have seen up at 40% reduction recently.
The current global crisis will be a test of just how much economic pain is required to substantially reduce CO2 emissions (assuming there is no reasonably affordable and practical replacement for fossil fuels).
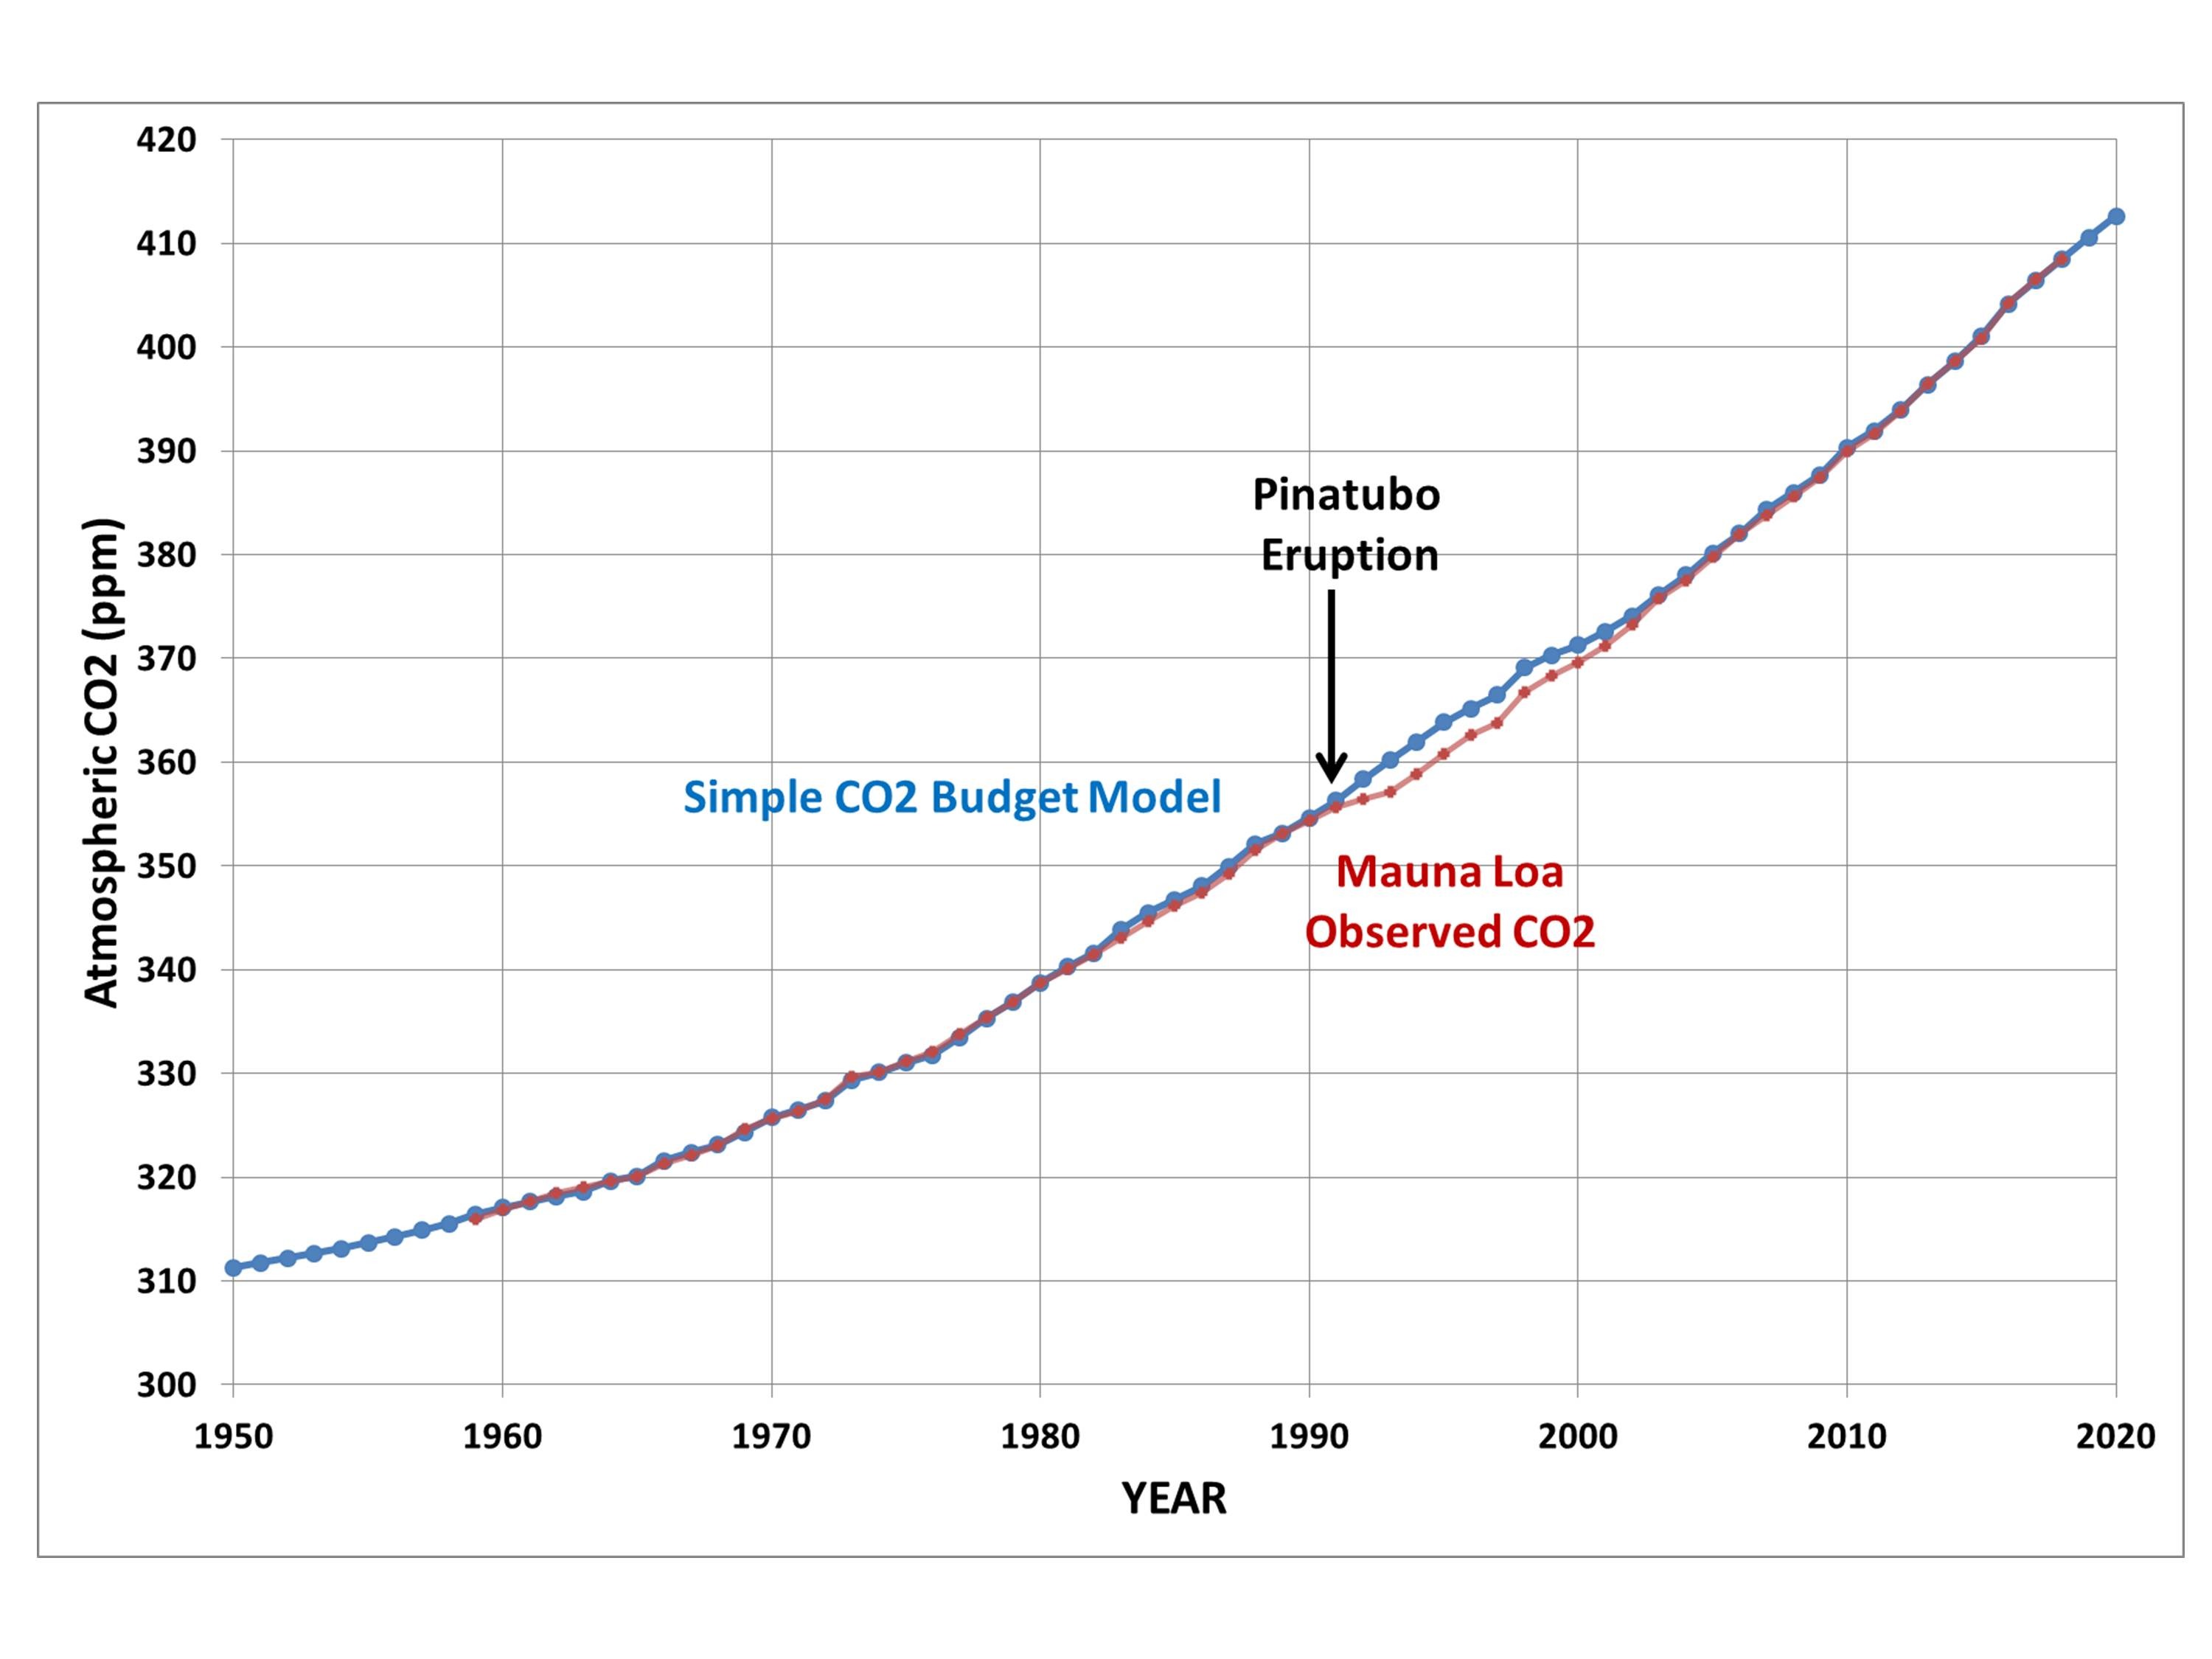
I already know that some of my “deep skeptic” acquaintances (you know who you are) who believe the global CO2 increase is mostly natural will claim a continuing CO2 rise in the face of a decrease in economic activity supports their case. I have previously shown that a simple model of the CO2 variations since 1959 forced with anthropogenic emissions accurately explain the Mauna Loa observations (see Fig. 2 , explanation here). It will take considerable evidence to convince me that the long-term rise in not anthropogenic, and maybe the current “coronavirus experiment” will provide some contrarian evidence.
Of course, for anthropogenic CO2 emissions reductions to have any effect, they actually have to show up in the atmosphere. The most widely cited monitoring location for CO2 is on Mauna Loa in Hawaii. It is at high elevation in a persistent subtropical high pressure zone that should be able to detect large emissions changes in several weeks time as weather systems move around the world.
I’ve had several requests, and seen numerous social media comments, suggesting this is something that should be looked at. So, I’ve analyzed the Mauna Loa CO2 data (updated monthly) through February 2020 to see if there is any hint of a CO2 concentration downturn (or, more accurately, reduced rate of rise).
The short answer is: No… at least not yet.
The Mauna Loa Data: Removing Seasonal and ENSO Effects
While an anthropogenic source of CO2 can explain the long-term rise in CO2, the trouble with finding an anthropogenic signal on time scale of a few months to a couple years is that natural variations swamp any anthropogenic changes on short time scales.
The monthly data (arbitrarily starting 1996, below) shows a continuing long-term rise that has been occurring since monitoring began in 1958. Also seen is the strong seasonal cycle as the vegetation in the Northern Hemisphere goes through its normal seasonal variations in growth and decay.

Obviously, not much can be discerned from the raw monthly average data in the above plot because the seasonal cycle is so strong. So, the first step is to remove the seasonal cycle. I did this by subtracting out a 4th order polynomial fit before removing the average seasonal cycle, then adding that statistical fit back in:

Next, there are some wiggles in the data due to El Nino and La Nina (ENSO) activity, and if we remove an average statistical estimate of that (a time lag and averaging is involved to increase signal), we can get a little better idea of whether the most recent month (February 2020) is out of the ordinary. I have zeroed in on just the most recent 5 years for clarity.

The polynomial fit to the data (thin dotted line) shows what we might expect for the coming months, and we can see that February is not yet departing from the expected values.
Of course, there are a variety of natural variations that impact global average CO2 on a month-to-month basis: Interannual variations in wildfire activity, land vegetation and sea surface temperatures, variations in El Nino and La Nina effects, and short-term fluctuations in anthropogenic emissions immediately come to mind. (The Pinatubo and El Chichon volcano eruptions actually caused a reduction in global CO2, probably due to post-eruption vegetation effects from an increase in diffuse sunlight penetration of forest canopies).
I will try to update this analysis every month as long as the issue is of sufficient interest.
The human contribution to atmospheric CO2 is rather small. The only way ‘they’ can make it a problem is to postulate ridiculously long residence times in the atmosphere. If you calculate a slew rate based on the annual variability, it puts the lie to decades long residence times.
Usig carbon isotope analysis the 45% increase in atmospheric CO2 over the past 2.5 centuries can be directly attributed to the burning of fossil fuels, a human activity.
Oh good. That means you accept the isotope analysis after the cessation of A-bomb tests that indicates a relatively short residence time. WUWT
That is explained here:
http://www.jamespowell.org/Stuff/Ourfault/Ourfault.html
An explanation that is consistent with a short residence time is that a/the major source of the extra atmospheric CO2 is the deep ocean. link Again, isotopes are used as the proof.
… the isotopes are “like a return address label on a letter from the deep ocean.”
It has been oft noted that atmospheric CO2 lags temperature. The most plausible mechanism for that is the return of CO2 from the deep ocean. The link I supplied above explains how that happens.
As always, you have to keep your eye on the doughnut. I was talking about residence time. The link you supplied does not deal with that.
I came across a counterargument,
During the 1950s, thanks to A-bomb testing, there was a spike in C-14. That spike originate in the Northern Hemisphere, where the testing was done, and later spread to the Southern Hemisphere. There was about a 6 month lag in C14 changes to the Southern Hemisphere.
https://www.cambridge.org/core/services/aop-cambridge-core/content/view/6BD120B674D0467B648CE1B8DF6428B8/S0033822200048979a.pdf/atmospheric_radiocarbon_for_the_period_19502010.pdf
Since MOST fossil fuels are burned in the NORTHERN hemisphere, any relative drop in C-13 should show up first in the Northern Hemisphere, with that same 6 month lag,
UNLIKE the case of C-14, there doesn’t appear to be a lag in C-13 reduction in the Southern Hemisphere,
http://citeseerx.ist.psu.edu/viewdoc/download?doi=10.1.1.550.8637&rep=rep1&type=pdf
Holy Smokes, Alan that’s an excellent catch.
If true, that will upset a whole bunch of apple carts.
A comment on the Quirk paper.
“We conclude that this paper is of no help in understanding the information given by studies of the stable carbon isotope carbon ratios.”
https://www.jstor.org/stable/43735381?read-now=1&seq=6#page_scan_tab_contents
You have to read anything written by Ferdinand Enlebeen very carefully. He’s not exactly the village idiot. Does he actually refute Quirk’s observation? (It’s a major inconvenience to read the comment because of the security settings in my browser.)
He and Barrett refute both the methodology and the results. When the skeptics challenge another skeptic’s work I tend to pay attention.
My first encoubter with Englebeen was http://www.ferdinand-engelbeen.be/klimaat/jaworowski.html
I have a free jstor subscription. It allows 6 views a month, but that is about I ever use it.
Jack, you surely need to study, a lot, geology!!
This phrase in the suggested site says it all
“So we know the added carbon in the atmosphere is coming from plants, but which plants?”
Desperately in need to study again the Carbon Cycle…
These arguments also completely makes impossible to have CO2 increases in the past, where there were no humans to burn fossil fuels.
This is why most alarmists are uninformed biologists.
FE sets out his case here.
The advantage of Tom’s paper is its relative simplicity. The disadvantage of Ferdinand’s case is its complexity. The problem with complexity is that a small error early on invalidates the whole thing. Does Ferdinand make errors? Dr. Roy Spencer thinks so. link
I am not sure Spencer really pointed out any errors.
You’re right Bob, it’s short and it’s very well known. Case closed. Isotope clearance is the best way to measure lifetime and the bomb tests provided this for carbon as well as e.g. tritium in the ocean. For carbon (dioxide) clearance half time is 16 years.
Thus mean residence time of CO2
= halflife / ln2
= 16 / 0.693
= 23 years.
Anyone who says anything different is trying to sell you something.
https://www.ncbi.nlm.nih.gov/pmc/articles/PMC2871409/
The carbon isotope analysis is hight questionable because the half-life of CO2 in the atmosphere is about 5 years, which means we have no idea, really, what it was like 50 or a hundred years ago. The assumption that we have been altering the isotopic composition is fraught with problems.
Furthermore, the increase rate of emissions in recent years has had no effect on the amazingly steady CO2 increase. No effect means we have no effect.
Harde refuted
https://www.soest.hawaii.edu/oceanography/faculty/zeebe_files/Publications/KoehlerGPC17.pdf
Kohler refuted
https://hhgpc0.wixsite.com/harde-2017-censored
And Harde 2019
And https://edberry.com/blog/climate/climate-physics/what-is-really-behind-the-increase-in-atmospheric-co2/
Yes, exactly… Humans have accounted for the many dramatic increases in atmospheric CO2 by having so many dinosaur barbecues using coal dug from the back of their caves. Humans are evil – at least if you were a dinosaur on the menu.
(/Extreme_Sarcasm_On)
Yeah I am a bit the same if it wasn’t the oil we put roads over massive areas, cut down huge areas of trees and generally had an adverse impact on the planet … no real news there.
No we aren’t putting it back like it was because we couldn’t support our current population and life style so get over your guilt trip.
In a couple of months the view out my windows will be one of verdant growth. I’m guessing that we have more critters in my low density urban environment per square acre than in the nearby forest that I used to drive through twice daily. The sole exception would be a marshy area with about a zillion spring peepers.
As far as I can tell we are as close to the Garden of Eden as we have been since the dawn of humanity.
The 13C/12C data shows that the increases in atmospheric CO2 has had a ratio (in δ13C terms) of -13 per mil (based on observations at multiple observatories and supported historically by the Law Dome ice core data). The δ13C of CO2 from fossil fuels is estimated by NOAA at -28 per mil. This proves that either some (or all) of the extra CO2 is not from fossil fuels or that some other process is simultaneously adding large amounts of 13C to the atmosphere thus reducing the actual rate of decline of the 13C/12C ratio in the atmosphere.
The warmist model (which acknowledges the above fact) is that the latter is the cause: their argument is that ocean ‘overturning’ of CO2 is replacing current atmospheric CO2 with ‘old’ CO2 which is had a higher 13C/12C ratio. It just happens that these two processes combine to maintain a constant δ13C for the incremental atmospheric CO2. Not impossible, but a model which relies on such a coincidence must be questionable.
It is also noteworthy that Keeling et al (2017) couldn’t match the δ13C observations with their sophisticated model without introducing a new variable: https://www.pnas.org/content/114/39/10361
2.5 Centuries. I guess the end of the world can’t be much longer now.
What you say is physically incorrect.
There are a dozen independent analyses that can be used to show that humans caused less than 5% of the recent rise in atmospheric CO2.
These study results are only possible if there is a constant large source low C13 source of carbon that is entering the biosphere.
We know this true because we have found a large sink of carbon dioxide in the ocean, the sinking of carbon particulate matter to the bottom of the ocean.
The Bern equation assumes zero biological material, particular organic carbon, is being sequestered in the ocean.
This recent observation that C14 is making to the deepest ocean with no delay is an observational fact that disproves the CAGW team created absurdly non-physical so-called Bern model of CO2 sinks and sources and resident times.
The Bern model assumes that ocean circulation (with hundreds of years delay) is the only method for deep sequestration of CO2 in the ocean.
The alleged long lifetime of 500 years for carbon diffusing to the deep ocean is of no relevance to the debate on the fate of anthropogenic CO2 and the “Greenhouse Effect”, because POC (particular organic carbon; carbon pool of about 1000 giga-tonnes; some 130% of the atmospheric carbon pool) can sink to the bottom of the ocean in less than a year (Toggweiler, 1990).
https://www.livescience.com/65466-bomb-carbon-deepest-ocean-trenches.html
Bomb C14 Found in Ocean Deepest Trenches
‘Bomb Carbon’ from Cold War Nuclear Tests Found in the Ocean’s Deepest Trenches
Bottom feeders
Organic matter in the amphipods’ guts held carbon-14, but the carbon-14 levels in the amphipods’ bodies were much higher. Over time, a diet rich in carbon-14 likely flooded the amphipods’ tissues with bomb carbon, the scientists concluded.
Ocean circulation alone would take centuries to carry bomb carbon to the deep sea. But thanks to the ocean food chain, bomb carbon arrived at the seafloor far sooner than expected, lead study author Ning Wang, a geochemist at the Chinese Academy of Sciences in Guangzhou, said in a statement.
This is more interesting that gee we have found the entire scientific basis of CAGW is incorrect.
CAGW the idea is based on the dead recycle theory that assumed the water and carbon dioxide that is 100 times more common on the surface of the earth than in the mantel was caused by…
…. a late thin veneer of water and methane from comets (ruled out in the last 30 years as viable option as our atmosphere is missing the heavy noble elements that are found in comets), that was hypothesized to have occurred, after our planet was hit by a Mars sized object.
The Mars size object collision, stripped the earth of its Venus like atmosphere and removed the molecule CH4 from the mantel.
Read the last sections of http://www.jamespowell.org/Stuff/Ourfault/Ourfault.html
As well:
Burning of large quantities of fossil fuels like coal, referred as the Suess effect, had significantly lowered the radiocarbon concentration of the atmospheric carbon reservoir. In contrast, nuclear weapons testing in the 1950s and 1960s dramatically increased the level of carbon 14 in the atmosphere. The phenomenon is often referred to as the bomb effect.
https://www.radiocarbon.com/carbon-dating-bomb-carbon.htm
Yes. Even if all of the annual rise observed at Mauna Loa were man made, for example, that is about 2 ppm. That would be equivalent to about 0.17 ppm/month. Seasonally, February/March does not show much of a trend (maximum is in May).
BTW, NOAA abuses the concept of significant figures. https://www.esrl.noaa.gov/gmd/ccgg/trends/monthly.html
However, daily variation observed is often 2 ppm or more, peak to peak. On top of that, even though the spectrometer is highly precise, this measurement variation would need to be considered also.
Even if all man made emissions ceased (corresponding to a 0.17 ppm drop) this would be a signal about an order of magnitude lower than peak to peak noise, and about equivalent to the standard deviation of daily averages over the month. Certainly, the drop in emissions is not 100%. The signal is smaller than the noise.
A better initial question might be, what is the actual emission reduction over this time period?
Estimates of each annual ‘global carbon budget’ are readily available but also easily manipulated IMO; it’s the end effect that alarmists try to divert attention away from viz. what effect emission reduction policies have on the atmospheric CO2 concentration.
And not only alarmist, believe it or not there are people getting very rich on CO2 reduction policies and would want to foster the belief that there is ‘gain’ from all the pain.
Scissor
Yes, I think that we will need a ‘bottom up’ analysis of CO2 emissions during these trying times of reduced air travel and reduced industrial output. The annual increase in the Mauna Loa measurements has been running about 40% of the calculated anthropogenic emissions. If that relationship changes significantly, then it would seem to me that there are a lot of assumptions that should be re-examined.
Even if there were one hundred years of evidence, nothing would convince Warmistas that humankind was not the cause of all CO2 increases as this is a deeply held religious belief and therefore immutable.
Isotope analysis attributes the rise in atmospheric CO2 to the burning of fossil fuels. What other species uses fossil fuels has an energy source?
Giving a load gun to a chimp is a reflection of the IQ of the person who handed it to him. Even worst it looks to me the chimp had enough IQ to know how it works.
I am sure it was a case of monkey see, monkey do…and I am not talking about the monkey!
Have you considered the possibility that the amount of CO2 that moves into the atmosphere from the ocean is affected by the amount of CO2 from other sources?
If CO2 from humans increases, CO2 from the ocean decreases since there is an equilibrium relationship between atmospheric and oceanic CO2. Each molecule that comes from humans is one that need not come from the ocean.
This explains how the isotope ration can be the result of human emissions but not the rise in atmospheric CO2.
Atmospheric CO2 levels are rising
Ocean CO2 levels are rising
Ocean pH levels are decreasing
Any off gassing is overwhelmed by absorption.
Jack,
Just to be clear – the ocean CO2 and pH levels that are shown in your graph are for SURFACE ocean waters.
What is your specific evidence (actual observations/measurements) for “Any off gassing is overwhelmed by absorption”? Thank you.
If the off gassing was exceeding uptaking, the pH lelvel would be increasing; the reverse is true.
Why does you graph cut-off at 2008 can’t you give a longer series?
Anyhow lets say I go with your graph and assume everything you say is true and we put another 1.5Trillion Tonnes of CO2 into the atmosphere by 2050 (using your figures).
Hard to work from your graph but that takes us to what something like 480-500ppm CO2 and ocean pH close to 8.03. I am even happy to use the IPCC numbers we increase 1.5 degree for the last 1.5Trillion tonnes so by 2050 we warm by another 1.5 degree.
Do you see the issue we have to find enough oil and it has to be the most economic energy source to use at current rate for next 30 years. Even if you did all that you get about the same amount of warming since 18th century. The only way you make a scary story is drag this all out another 50 years on the same projection.
Now does anyone seriously think the world in 2100 will remotely be like it is today?
That is basically what you are expecting people to buy and feel guilty about.
Something more current
So take the last 30 years on that graph 1998-2018 now project the numbers forward 30 years at that same rate and the numbers I gave before are pretty correct. I have used all your numbers and have not challenged a thing.
Post covid support for climate action will drop like a brick because people will have real and immediate problems to deal with and many of the inner city greens will be financially suffering.
So I guess my question to you is do you seriously think in a world now going to be recession for the next decade you are going to somehow convince them that is scary enough to do anything about?
1998 was the largest El Nino event of the previous 50 years. Nice cherry pick.
You pick any year you like then I just chose 30 years behind because we are going 30 years forward. I really don’t care what year you choose so you nominate the start year the numbers change very little. See right now I can’t work out if you are just a really dumb prat or a paid troll because all you seem to do is push stupid stats.
So I am a convert I accept all your stats … so where is the climate emergency?
You are asking me to change the entire economy and leave oil in the ground so convince me why?
I did not ask you to do anything mentioned in last two sentences.
30 years back from now. These are Roy Spencers stats.
1990 2 -0.20
2020 2 0.76
0.96 C increase.
https://www.nsstc.uah.edu/data/msu/v6.0/tlt/uahncdc_lt_6.0.txt
Great invent any numbers you like then … who cares you just wasted everyones time because it is all MEANINGLESS.
The last report a week ago from the US energy information agency eia.gov didn’t show a drop in gasoline consumption
That is surprising. My commute is wonderful and gas prices are plummeting.
I find that implausible. Traffic in the Seattle area has reverted 20 years. The ‘rush hours’ commutes are again at posted speed limits, rather than the ‘crawl that has been endemic in the last 5-10 years.
People aren’t commuting to work, but they are still driving.
They have to go to multiple stores because of shortages.
They are going to drive-thru’s instead of eating in.
All kinds of services are being done in drive-thru mode. I’ve read of Covid19 testing being done via drive-thru.
When you are doing things via drive-thru, you end up with a line, sometimes a long line, of cars, all of which have their engines running the whole time they are in the line.
Thank you for the post!!!: I am sufficiently interested.
I downloaded the data and plotted some of it in Excel. The data was a bit noisy in Feb… but the increase from year to year did not appear to be interrupted… The work you do is amazingly important.
Spencer’s own graph shows NO reduction in global CO2.
Almost all the comments below by both sides and anyone who actually bothered to check noted you aren’t going to see anything and the calculation makes it clear why.
As did the text, had you actually read it.
I would imagine the dropping gas prices had people topping off their tanks and using their vehicles a bit more. For me? I was looking forward to instructing a few students at Sonoma (Searspoint) Raceway last weekend.
The two students were bringing a Cobra kit car and Porsche 968,
But the real fun was that two friends wanted me to show them what their cars could do when flogged hard. One is a 2014 Porsche 911S, the other is a McLaren 570S LT. “Mario I want to see this car driven at the limits, can you take me for a ride on the track a few times in my car?”
So I would have been doing my part to feed the planet… at a net velocity of 0… since I’d eventually end at the end of each 20 minute session back where I started.
However, the event got cancelled by Gavin Newsom a couple days before the event!
Ugh… I will have to wait a few more months for track days to come back…
That sounds like a lot of fun! Maybe you can get back to that sometime soon.
I will come back!!!
Been doing it for 18 years now, and have a competition license. I get asked to compete with other race teams and in 2018 raced a stock car for the 25 hour race at Thunderhill Raceway. I have a 300hp (used to be 400hp) Miata I use to give demo rides at instruction events and that got me known for giving thrill rides and now I have a reputation of driving other people’s cars faster than the owners… including competition race car drivers. So I have much joy…
I never pay to drive anymore so that is a blessing! And I pay a small fee to race with other teams who have all the support so I can arrive and drive.
That sounds like even more fun! 🙂
If you’re every in the Bay Area let me know. I do events in Sonoma and Willows CA often. I can get you in for a ride around the track during either the advanced group or the Times Trials group. It won’t cost you anything.
Mario
For humans…us humanos;
Trying a flying without the means of an aircraft, it either will be a day dreaming or else a foolishness for not saying insane or wholly stoned.
🙂
cheers
“I already know that some believe the global CO2 increase is mostly natural will claim a continuing CO2 rise in the face of a decrease in economic activity supports their case. I have previously shown that a simple model of the CO2 variations since 1959 forced with anthropogenic emissions accurately explain the Mauna Loa observations (see Fig. 2 , explanation here). It will take considerable evidence to convince me that the long-term rise in not anthropogenic, and maybe the current “coronavirus experiment” will provide some contrarian evidence.”
“some believe the global CO2 increase is mostly natural” and others who show that the attribution of changes in atmospheric composition to fossil fuel emissions is statistically flawed.
The claim that to question the attribution of changes in atmospheric composition to fossil fuel emissions one must prove an alternate cause is a shifting of the burden of proof fallacy. What I find is that the attribution of changes in atmospheric composition to fossil fuel emissions is statistically flawed. The burden of proof is on those who claim this attribution.
Man is creating more CO2, CO2 levels are going up.
Isotope analysis indicates the new CO2 is from fossil fuels.
What other proof do you need?
“Isotope analysis indicates the new CO2 is from fossil fuels.”
No it doesn’t. It doesn’t rule it out either, but only if you invoke an additional separate process to ‘adjust’ the 13C in the atmosphere. See my comment above (March 23, 2020 at 3:47 am ).
I read that scientists can precisely know what part of the ~400 PPM is man-made by examining the isotope admixture of the CO2. Does anyone know if that is credible, and what the percent is?
I wish to make this side comment:
NOAA, and those raising the ‘catastrophic flag,’ base tremendous certainty on the Mauna Loa measurement. They consider it the foundation of their claim. Yet … it is one measurement, over 60 years. How can they turn around and dismiss the significance of a different measurement, namely the 900,000,000 TMIN/TMAX recordings by 40,000 weather stations around the world over 120+ years? All graphs of this near-billion dataset – and I have personally examined it on my computer – show no catastrophic warming. They show only nature’s natural sine curve, and a subtle indication of the downward Holocene trend.
I am speaking about the raw NOAA GHCN dataset which has received redactions, estimations, homogenizing, and station-blacklisting.
I’m just sayin’.
All of it.
http://www.jamespowell.org/Stuff/Ourfault/Ourfault.html
@Jack Dale
a) that link has elements of explaining the isotope thing, but then it totalizes, complete with shaming, that man is destroying the earth. I don’t read trash like that. I asked for what percent of the 400 is man-made and you jumped the shark to respond “all of it.” This disqualifies your response.
b) kindly respond to the other part of my post.
b) let me have access to your your computer to verify your data.
From Stefan Rahmstorf
http://www.realclimate.org/index.php/archives/2018/01/the-global-co2-rise-the-facts-exxon-and-the-favorite-denial-tricks/
According to CDIAC numbers which I have my computer, human activity has released 1.5 trillion tonnes of CO2 in the the atmosphere since 1751.
And we are probably going to release close to that again over the next 30 years
35.9 Gt * 30 = 1077Gt
Unless you are a true optimist and actually believe the world will be net zero by 2050
Good luck with that.
How much has come directly out of volcanoes in the same time period?
Volcanoes emit about 1% of the CO2 as human activity.
“Which emits more carbon dioxide (CO2): Earth’s volcanoes or human activities? Research findings indicate unequivocally that the answer to this frequently asked question is human activities. However, most people, including some Earth scientists working in fields outside volcanology, are surprised by this answer. The climate change debate has revived and reinforced the belief, widespread among climate skeptics, that volcanoes emit more CO2 than human activities [Gerlach, 2010; Plimer, 2009]. In fact, present‐day volcanoes emit relatively modest amounts of CO2, about as much annually as states like Florida, Michigan, and Ohio.”
https://agupubs.onlinelibrary.wiley.com/doi/full/10.1029/2011EO240001
and how was the out gassing of the oceans from warming?
The ocean is still uptaking more CO2 than is being off gassed. That can be seen in the decreasing pH level.
“I read that scientists can precisely know what part of the ~400 PPM is man-made by examining the isotope admixture of the CO2. Does anyone know if that is credible, and what the percent is?”
I recommend Berry’s new carbon cycle paper for a discussion that shows that argument to be erroneous.
https://edberry.com/blog/climate/climate-physics/human-co2-has-little-effect-on-the-carbon-cycle/
Other sources of information on this question are Salby’s videos and Harde 2017 and Harde 2019. Have you seen chaamjamal’s analysis of the effect of changes in emissions on atmospheric content? https://tambonthongchai.com/2018/12/19/co2responsiveness/ It is well worth a look. Just a visual inspection of emissions shows a rapid increase in rate at 2002 and a 3 year no growth period in 2012 to 2014. Dr. Spencer’s Mauna Loa graph has no visible inflections at these dates. So ask yourself what is decreasing the absorption of fossil fuel CO2 when emissions die and increasing them when emissions increase to keep the atmospheric growth constant.
Hello windlord sun
In my opinion, there are two problems with the C13 and C14 arguments. The first is that it does not discriminate between fossil carbon and geological carbon. This is the bog one. The other issue is statistics.
https://tambonthongchai.com/2019/04/28/13c/
https://tambonthongchai.com/2019/02/10/14c/
chaamjamal and DMA,
Thank you for those links. I will dig in tomorrow. This has to be a complex issue.
“They show only nature’s natural sine curve”
That’s right. The temperatures cool for a few decades and then they warm for a few decades and then they cool again for a few decades and then they warm again and the high point of each warm period is within a few tenths of a degree of each other.
There is nothing unprecedented going on. There is no unprecedented warming which means there is no CO2-caused climate change.
Yes. The USHCN curve displays two full cycles 1900-2019, and at the height of each, they are within about .7 Fahrenheit, with the second being slightly lower. That could just be wobble, but also could be consistent with down trend as the Holocene marches on.
MIlankovitch cycles would have us in a cooling phase. Solar cycles would have us in a cooling phase. We are warming – because we are emitting a known GHG.
“Our study unambiguously shows one-way causality between the total Greenhouse Gases and GMTA. Specifically, it is confirmed that the former, especially CO2, are the main causal drivers of the recent warming. A significant but smaller information flow comes from aerosol direct and indirect forcing and on short time periods, volcanic forcings. In contrast the causality contribution from natural forcings (solar irradiance and volcanic forcing) to the long term trend is not significant. The spatial explicit analysis reveals that the anthropogenic forcing fingerprint is significantly regionally varying in both hemispheres. On paleoclimate time scales, however, the cause-effect direction is reversed: temperature changes cause subsequent CO2/CH4 changes.”
https://www.nature.com/articles/srep21691
We have messed up long-term natural cycles.
We? No, you have messed up long-term natural cycles….are you sorry? Have you stopped emitting CO2? Have you planted a single tree? Did ancient man create CO2 and kill the dinosaurs?….and the mega-fauna? Ancient man was a bad person.
Jack Dale
We are not in a warming stage. Worldwide, temps have been headed down for 20 years. It is fascinating to watch you stonewall that fact over and over. You are a Cooling Denier.
Remedy: (i have already suggested it to you, but you can lead a WarmingAdvocate to water, but you can’t make him drink, since there might be a lot of koolaid in system) ….
Download both the GHCN and USHCN data. Be ready to parse a billion (nearly) daily measurements. Then graph it. You will see both the two-70-year-easing-cycles and the newest 20-year downslope.
There is no 20 year cooling.
From Roy Spencer’s UAH global temperature data
2000 2 -0.07
2020 2 0.76
That is 0.83C of warming.
https://www.nsstc.uah.edu/data/msu/v6.0/tlt/uahncdc_lt_6.0.txt
2000-01 weak La Nina
2018-19 weak El Nino
https://ggweather.com/enso/oni.htm
“The world’s five warmest years have all occurred since 2015 with nine of the 10 warmest years occurring since 2005”
“Ocean heat content, which describes the amount of heat stored in the upper-levels of the ocean, was the highest ever recorded.”
https://www.noaa.gov/news/2019-was-2nd-hottest-year-on-record-for-earth-say-noaa-nasa
“The Copernicus Climate Change Service (C3S) announces today that 2019 was the fifth in a series of exceptionally warm years and the second warmest year globally ever recorded. ”
https://climate.copernicus.eu/copernicus-2019-was-second-warmest-year-and-last-five-years-were-warmest-record
2019 was the coldest year for surface temps in history, apart from 2012. And temps have been plummeting since 2001.
Well gee, Jack, maybe NOAA should take instruction from me and download their own (massaged) data and have a high school student intern parse it into graphs. They will see this:
https://theearthintime.com
including both cooling trends, over 120 years and over the last 20 years.
NOAA are CoolingDeniers on their own data!
No matter what study you bow down to, if it claims abnormal warming, including catastrophic apocalyptic crisis warming, the burden is on you, Jack, and NOAA and whomever, to inform the world why it does not show up in one-billion direct measurements. [this is prior to the ripping into many Alarmist constructions deserve on their own terms.] I won’t bother to thrash the chain of inbred self-validating links you posted. The conclusions they make have all been denied so well, it is pitiful you link them. Yes, I said denied. By facts.
[I wish we had better trolls here, Anthony. Not that you should go out and invite them.]
This includes satellite temps of the trop/strat. They are meaningless on the subject “Is there abnormal warming” unless those trying to construct that their readings as AlarmWorthy can give the above explanation.
By citing Roy Spencer, all you do is bring attention to his destruction of the validity of models. So thanks for that.
You are using US data which is 1.9% of the earth. I am using global data. The G in AGW stands for Global.
Regardless of which GLOBAL data set is used, we are warming.
1) Th 1.9 is not only inaccurate, it is irrelevant. This argument has been debunked a hundred times. We know you have to throw it up there, even if you deny having seen all the deep debunks. It is debunked by my position statement in my last post.
2) the “G” in in NOAA’s GHCN stands for global. Half of the 1-billion readings are non-USA. There are 41,000 stations that have reported TMAX/TMIN recordings over 120 years. I do not have the GHCN graph posted on my website, but its evidence is even more damning for Alarmism.
Spencer’s data also shows the US (both 48 and 49) warming trend higher than the global trend.
https://www.nsstc.uah.edu/data/msu/v6.0/tlt/uahncdc_lt_6.0.txt
I guess the Europeans are in an the scam as well.
From Copernicus
The data also show that:
The five warmest years on record have all occurred in the last 5 years, with 2019 coming in as the second warmest and 2010-2019 being the warmest decade on record
2019 was almost 0.6 °C warmer than the 1981-2010 average
The average temperature of the last 5 years was between 1.1 and 1.2 °C higher than the pre-industrial level defined by the IPCC
Europe saw its warmest calendar year on record, marginally ahead of 2014, 2015 and 2018
Furthermore, according to satellite measurements of global atmospheric CO2 concentrations:
CO2 continued to rise in 2019, increasing by 2.3 ± 0.8 ppm
https://climate.copernicus.eu/copernicus-2019-was-second-warmest-year-and-last-five-years-were-warmest-record
Jack, it is not the warmest period earth has ever had….are you aware that fossils north of the arctic circle include trees and crocodiles? Jack, can you please inform us why from 1941 to 1979 the temp went down slightly while CO2 went up? Jack, climate is a very complex dynamic system that no one thoroughly understands…including you?
I now the earth has been warmer. Homo sapiens has not endured atmospheric CO2 level this high. I was hoping that we could maintain a climate suitable for human habitation and that we would not be the first species responsible for its own extinction.
The war and post war boom added significant industrial aerosols to the atmosphere; those have a cooling effect. the Clean Air Acts of the the 1970’s, designed to reduce smog, reduced those aerosols and warming resumed. The Rasool and and Schneider paper was predicated on continued industrial aerosol emissions. It also recognized the role of CO2 in warming. https://science.sciencemag.org/content/173/3992/138
Yes, the climate system is complex, like all complex systems, can be subject to perturbations.
Jack: “Homo sapiens has not endured atmospheric CO2 level this high.”
Oh yes, we have. Alternate proxy measurements of early Holocene show levels near 400. During the prior two interglacials, which were warmer than the Holocene, it is quite probable (deliberately couched language) that CO2 was high.
We have no measurements for CO2 levels prior to 1959, so any (flat, certain, arogant) claim you make like this is null.
The Vostok ice cores show no levels higher than 300 ppm for the 800,000 years prior to the mid 18th century.
a) ice core analysis is not a ‘measurement.’ Ice cores have a resolution of maybe 100 years, and that is extremely generous. Slush cannot see peaks such as multiple rises and falls between 200 ppm and 400 ppm.
b) much more powerful proxies exist, especially for the Holocene, as I stated.
c) you are evading my main skewer. that’s okay, I understand not wanting to bleed
The one measurement , over 60 years, is also located on an island with an active volcano.
CO2 levels are measured by hundreds of stations scattered across 66 countries which all report the same rising trend.
Yes, it might seem like a silly location at first, and atmospheric disturbances do contribute to random spikes and data that has to be thrown out, but there are prevailing winds and convective patterns that allow “pristine” air at Mauna Loa to be sampled quite regularly.
The notion that NOAA can measure CO2 to 0.01 ppm is laughable just like their reporting of temperatures to 0.01 degrees (K). Their improper use of statistics is really concerning. However, their basic methodology for measuring atmospheric CO2 seems to be sounds.
Yes, they do have to remove water from samples to measure CO2 accurately, especially by Infrared analysis. Think about that, water interferes with CO2 measurement in the IR. That fact is directly relevant to overlap of H2O/CO2 absorptions in the IR.
In any case, there are multiple other locations now. We should be somewhat confident in the CO2 trends that are observed.
winlord-sun wrote, “I read that scientists can precisely know what part of the ~400 PPM is man-made by examining the isotope admixture of the CO2. Does anyone know if that is credible, and what the percent is?”
That depends on exactly how you ask the question.
If the question is, “what percentage of the increase in CO2 levels, from about 280 ppmv two centuries ago, to about 412 ppmv now, is due to human activity?,” then the answer is all of it. (This is the interesting question.)
If the question is, “what percentage of the carbon atoms in CO2 in the atmosphere are from fossil fuels and cement manufacturing?” then the answer is not much of it. (This is the question that can be answered by isotope analysis.)
Those can both be true because carbon in the air (mostly in CO2) is continually being exchanged with carbon in other places (“reservoirs”), some of which are much larger than the atmospheric reservoir. One-for-one exchanges of carbon between the atmosphere and other reservoirs don’t change the level of CO2 in the atmosphere, but they do change the percentage of carbon molecules in the air which were released from fossil fuels and limestone.
Ferdinand Engelbeen has a thorough treatment of this topic, here:
http://www.ferdinand-engelbeen.be/klimaat/co2_origin.html
Thank you for this post. And if anybody is laying odds… I’d bet the dramatic overlapping hibernation of the world’s biggest economies (China is gearing back up now) will register as not even a blip on the Mona Laua CO2 monitor. Peak at 410 ppm by May, back to nature’s own low of 400 by October.
Shoot yourself in the foot time perhaps.
Surely surely this can be measured. Tipping it won’t!
I do not care what your model says, the vast majority of the rise of CO2 is driven by ocean outgassing. CO2 follows temperature, not the other way around, and we have been moving out of the little ice age for 150 years.
This 👍🏻. Ocean outgassing is real science.
astonerii wrote, “the vast majority of the rise of CO2 is driven by ocean outgassing.”
That’s wrong. The oceans are not (on net) outgassing CO2, they are absorbing it.
The net sum of nature’s CO2 sources and sinks is an average of about -5 to -6 PgC (and about half of that is absorption by the oceans). That is, nature is REMOVING about 2½ ppmv of CO2 from the atmosphere per year.
But mankind is adding about 5 ppmv of CO2 per year.
The result is that CO2 levels are rising about 2½ ppmv per year.
Best hope this generation has to slay the myth of the skydragon.
I don’t expect again in my lifetime to see a near-simultaneous forced hibernation of all the world’s fossil fuel economies. Though China is gearing back up, there will be at least a fiscal quarter (from say, December to March) of overlapping low productivity / low energy expenditures to demonstrate effects on CO2 residency in the atmosphere.
My guess is we’ll see 415 ppm by May and 410 by October: nature’s own apogee and nadir.
Roy,
But if you look at March daily CO2, you will se a downturn or plateau that is not present in March in recent years.
https://www.co2.earth/daily-co2
Question is, is this plateau real or is there a PC thumb on the scales?
If one is really devoted to proof that mankinds’ emissions are changing CO2, then some event has to be visible, given the claims of extremey high accuracy of measurement. Geoff S
Geoff,
The pause in growth of atmospheric CO2 is seen virtually every year at Mauna Loa during the Jan/Feb/March period (best seen using the monthly values as daily values show much greater scatter than other months during this period). You can see the same effect during March last year (weekly values dropping and large daily scatter) here: https://www.esrl.noaa.gov/gmd/ccgg/trends/weekly.html
The ‘pause’ is also clearly evident in the 13C/12C data and the O2/N2 data (though the pause in those cases is a deviation from a decreasing trend – opposite to CO2). There is a suggestion, but not a robust correlation, that the pause is least obvious during EL Niño years and hence may be linked in some way to the cause of the pause. I asked Scripps about this a few years ago, but they were rather unhelpful. They said that they were not aware of any published studies on this ‘pause’ (my main question) but since their models showed it, I would need to look into their models to find the cause!!
While you were leaning over with a magnifying glass to look for the minuscule impact of Coronavirus on the Mauna Loa CO2 data, I took the liberty of removing your wallet.
OK. I don’t care what anybody else says – That right there is funny!
Sure is funny. Last laugh saved tot me.
The main objects in my wallet were hungry moths. Geoff S
I am not a scientist, am not nearly as informed as other readers but work with numbers and shapes. In reading the Powell bit cited by Dale I concluded gobbledegook on it all (can anyone explain the first exhibit?) with the possible exception of exhibit 3, where I almost split an integer over the C14 decline curve. If that is accurate, then the C14 atmospheric decline is about 20% faster than C12 (half life about 26 years) and the C13 rate might be in the middle (makes sense due to isotopic weight).
So the logical thing, for anyone seriously inclined to make a career out of yelling about carbon in the atmosphere, is to present some compelling emission data and absorption data on C12 and C13, and to isolate the human caused components. In short, if we all died what would happen? Until then I don’t think you will win over my side.
One of these things is not like the other, one of these things just does not belong!
Really?
People need to heat their homes. I live with a view of Lakeshore Drive in Chicago, and yes, traffic is down.
Until we have the Z’Pocalypse, the economy struggles along. The only thing that is way down is fun, going out, having a nice restaurant meal and maybe a glass of wine. Restaurants will be devastated by this, and millions will be unemployed.
I checked into the statistics of Coronavirus. People with no other, or, Underlying, conditions, die at about 0.9%, around ten times worse than the diseases we call the “Flu.”
Destroying the economy, Creating millions in unemployment, putting 10,000 restaurants and taverns out of business, you tell me, a logical solution? And now the malaria drug Chloroquine has been shown to have some benefit to shorten the course and reduce fatalities.
Which is worse?
“Destroying the economy, Creating millions in unemployment, putting 10,000 restaurants and taverns out of business, you tell me, a logical solution? And now the malaria drug Chloroquine has been shown to have some benefit to shorten the course and reduce fatalities.”
Using the milaria drug in combination with antibiotics may be the game-changer we were looking for.
I heard Dr. Oz on tv this morning and he was saying that the French government was so impressed with the results of the study where 36 patients were given these drugs and within six days their bodies were cleared of the Wuhan virus (with viral loads decreasing each day), that they have authorized the general use of these drugs for all Wuhan virus patients in France. I expect this will be happening very quickly all over the world (India is doing the same).
Dr. Oz was so impressed with the French results (he talked to the French doctor who carried out the tests) that Dr. Oz is now starting a clinical trial at Columbia along with a trial to see if the drugs can serve to prevent a person from getting the Wuhan virus in the first place. And he said lots of other university medical centers were doing the same.
We will have a ton of information on this in just a few weeks and will probably be seeing anectdotal evidence every day.
If we can cure the Wuhan virus then we can go back to work. If we can prevent the Wuhan virus, then we can go back to work. If we can do either one, we can go back to work as soon as we can secure a large enough supply of these drugs to treat everyone. And it looks like Trump is very eager to get back to work and I imagine this drug breakthrough is going to allow us to do just that. Nothing is assured as of now, but things are looking a lot better.
We might have just dodged the bullet.
A doctor just came on the Sean Hannity radio show and said he had been treating hundreds of Wuhan virus patients with the malaria drug, hydroxychloroquine plus an antibiotic and 220mg of Zinc per dose, and he said he had a 100 percent cure rate. That’s on top of the 100 percent cure rate in the French trial. The doctor in this latest endeavort thanked President Ttump for his authorizing any US doctor to use these drugs. I think this doctor and another patient who has recovered using these drugs will be on Hannity’s show tonight.
It seems we want to get these drugs to patients before they go into the phase where the disease gets deep in their lungs because these drugs look like they can clear the body of the Wuhan virus, but if the disease gets to a certain stage then it causes the body’s immune system to overreact and this is what causes the real, perhaps permanent damage to the lungs. So we want to get them before they get here and that’s just what this doctor did. He held off treating them until they showed the first definite signs of the disease and then he would treat them and successfully, it looks like.
And there is this:
https://www.foxnews.com/health/florida-man-with-coronavirus-claims-malaria-drug-saved-life
I think we are going to be seeing a flood of these kinds of reports in the days to come.
Maybe we can all get back to work sooner rather than later.
“”A man has died and his wife is under critical care after the couple, both in their 60s, ingested chloroquine phosphate,” one of the anti-malaria drugs that President Trump has mentioned in recent days, according to Banner Health, the hospital system that treated both patients.
Why it matters: People who self-medicate risk serious side effects or death, and it’s why any messaging about chloroquine and the related hydroxychloroquine should emphasize that these drugs have not been approved to prevent or treat the new coronavirus.”
There is a reason drugs are tested.
Did they happen to mention what dose these people took?
Was the medicine they took hydroxychloroquine or some fake they bought on the internet? I saw today where the FDA took down a website that was selling a fake vaccine for the Wuhan virus.
I believe they were self medicating with a aquarium cleaning solution, instead of the appropriate drug. Will try to find the article and post it.
Mac
Tom
I posted on the thread about the new drugs that hydroxychloroquine sulfate is toxic at twice the typical daily dosage. It might be easy to overdose if someone is panicky and illogically concludes that if 1 gram is good, 2 grams is better.
“All things are poison, and nothing is without poison, the dosage alone makes it so a thing is not a poison.”
—Paracelsus
https://en.wikipedia.org/wiki/The_dose_makes_the_poison
It has now been approved by the FDA but again it comes with the warning for many it isn’t a cure. No way to know if it will get everything running any faster, you still have to have it pass thru the whole community and if you look at it’s use by your own description all you are going to do is stop a few people end in critical care.
https://www.foxnews.com/science/french-researchers-publish-antimalarial-and-antibiotics-combination-that-could-shorten-covid-19
That’s it !
“We believe that it is not ethical that this association should not be systematically included in therapeutic trials concerning the treatment of COVID-19 infection in France,”
Against that there are plenty of doctors who don’t want to use it for another batch of ethical reasons. Overnight an Arizona man died to the drug which was being pushed on the internet (including WUWT) and what worried me and I was accused of over-reacting
https://www.12news.com/article/news/health/coronavirus/man-dies-after-self-medication-to-prevent-covid-19/75-3c832083-c740-41c4-9360-286391e1d095
Two people in Nigeria have also been admitted overnight with poisoning.
All I can say is the idea that the drug is somehow being withheld or kept secret is just wrong how much more public do you want than President Trump discussing it live.
I am not on any particular side here I am sure if the studies are right it does have a roll to play but we need to let the Doctors and Drug authorities do their work. Encouraging people to self medicate is dangerous and part of why I wanted an early article taken down.
There is no idea for self medication as the memorandum talks about electrocardiogram surveillance because of the known posdible side effects.
That’s good then no issue with that, its the push on social media including here to self medicate that is dangerous.
The C isotope argument assumes hthat the C pull down is consistent. What if it isn’t?
Plants use various ways of fixing C – IIRC C3, C4 and Crassula acid. C3 discriminates against the heavier isotopes, the others much less. If there proportions of the fixing mechanisms have changed then the assumptions behind the isotope argument are wrong.
Consider the oceans, the controller of the atmosphere. Calcareous phytoplankton are C3, so they fix little if any 13 or 14C,and export C”quite efficiently to the deeps. (See the white cliffs of Dover.) Diatoms use a Crassula-acid-like fixing technique – more heavy C pull down – and are less efficient at exporting it to the deeps.
Consider an ocean where diatoms become dominant for longer during the spring bloom. Calcareous phytos have wait until the diatoms yield. Isotope proportions change to give a higher 12C signal but more CO2 overall is left unexported.
Consider an ocean enriched with dissolved silica by increased dustiness and soil erosion caused by forest and scrub clearance. More silica, more dominant diatoms. More light isotope C left in the atmosphere.
Consider that the central dogma of global warming is wrong.
JF
Can also do this using oil pollution as the driver. Feynman said ‘guess again.’ Climate science has hardly guessed at all.
I wonder when they will reanalyze the data and realize it needs to be “fixed”?
I’m no scientist and don’t pretend to be smart, enjoyed everyone’s comments, very interesting, thanks everyone. Just thinking,(that usually gets me in trouble), earth is a closed system, there is a finite amount of everything, burning fossil fuels is, well, from fossils, former plants and animals that once thrived. Burning fossil fuels releases stored Co2, into the atmosphere where it’s been before. Question is would present Co2 levels plus all fossil fuel Co2 be a greater amount than what has formerly been in earth’s atmosphere?
Cheers, I’m expecting much eye rolling, but it’s an honest question.
If the full figures for March 2020 do show a trend change at Mauna Loa, it would be interesting to look at any time shifts from Barrow to ML to Cape Grim to South Pole. If carbon isotopes in CO2 are also masured daily at these sites, we could end up with some numbers rich in information. Geoff S
p.s. What link gets me Barrow and South Pole daily, up to date CO2 observations?
This link appears to discuss carbon isotopes, but I haven’t made it there specifically yet:
https://www.esrl.noaa.gov/gmd/obop/brw/summary.html
PS Barrow has been renamed – Utqiaġvik
Thanks Phil,
Link has some relevant data but CO2 data ends in December 2018??? Geoff S
p.s. Thank you for the name spelling correction, but in this case I shall continue to push my own.
Roy,
I think this is a long shot. Human emissions have been driving CO2 up at about 2.4 ppm/year. A normal month’s contribution would be about 0.2 ppm. Check the scale on your axis. You are looking for a fluctuation in that 0.2 ppm.
Maybe after three or four months something will show.
For once I agree with Nick, from the graph 50ppm change in 25 years so 2ppm per year. No way you ever going to see that on that graph for a very long time.
the big change is poverty without Fossil fuels
Hi Nick,
Agreed about the expected? size of change in theory.
Do you have a link for Cape Grim daily CO2 that is up to date?
My layman searches do not seem to find anything more recent than end Feb 2020.
Also, a generic CSIRO site that gives me a screen that says the CSIRO site is not to be trusted.
It all gets too hard.
To the tune of : Deutschland, Deutschland uber alles (This is the “clean” version that we sang in the RAAF).
“Life presents a dismal picture
Dark and dreary as the womb,
Father’s got an anal stricture
Mother’s got a fallen womb.
Sister Sue has been aborted
For the forty-second time,
Brother Bill has been deported
For a homosexual crime.
Nurse has chronic menstruation,
Never laughs and never smiles,
Mine’s a dismal occupation
Cracking ice for Grandpa’s piles. Etc., etc.
Geoff,
The latest Cape Grim monthly CO2 data is here. That is probably what you found. I doubt they would post daily data.
It follows NH SST as if measured with that sort of precision.
Very good reason for the lack of correlation with emissions, and it’s got nothing to do with regarding from warming seas.
Nick Stokes, yes, I agree. I doubt we will see an effect. But who knows?
Hi Nick,
Agreed about the expected? size of change in theory.
Do you have a link for Cape Grim daily CO2 that is up to date?
My layman searches do not seem to find anything more recent than end Feb 2020.
Also, a generic CSIRO site that gives me a screen that says the CSIRO site is not to be trusted.
It all gets too hard.
To the tune of : Deutschland, Deutschland uber alles (This is the “clean” version that we sang in the RAAF).
“Life presents a dismal picture
Dark and dreary as the womb,
Father’s got an anal stricture
Mother’s got a fallen womb.
Sister Sue has been aborted
For the forty-second time,
Brother Bill has been deported
For a homosexual crime.
Nurse has chronic menstruation,
Never laughs and never smiles,
Mine’s a dismal occupation
Cracking ice for Grandpa’s piles. Etc., etc.
Geoff Sherrington
March 23, 2020 at 12:19 am
————–
We still refuse to consider, let alone understand the humanity and civility…. because we refuse history of us… keep refusing the warnings there…
We still keep refusing the proposition of Alexander the Great in our history;
Be good or bad, is no problem, but do not be ugly, even if you think that you may succeed due to ugliness… you still will very ugly and badly fail… with no clause of mercy of forgiveness… whatsoever.
Regardless of power or status…
cheers
The corona virus should have at least a 5% impact on emissions and if no downturn can be detected by the measurement stations then it would make the GHG theory rather wobbly.
GHG theory is already wobbly. Temps are NOT following in step with CO2.
“Our study unambiguously shows one-way causality between the total Greenhouse Gases and GMTA. Specifically, it is confirmed that the former, especially CO2, are the main causal drivers of the recent warming.”
https://www.nature.com/articles/srep21691
“Our study unambiguously shows one-way causality between the total Greenhouse Gases and GMTA.”
Yes, that’s what happens when the official temperature record is bastardized in order to make it conform to the rise in CO2 in the atmosphere. They are correct, their study does show unambiguously that the CO2 chart matches the bogus, bastardized, fraudulent Modern-era Hockey Stick global temperature chart.
Now, try matching CO2 rise to the *real* temperature profile of the Earth represented by the U.S. surface temperature chart where the 1930’s were just as warm as today. There won’t be any such match using the real global temperature profile. Of course, the alarmists knew this so that’s why they bastardized the global temperature record to make it look like CO2 and temperature are marching in lock-step. Actual temperature readings put the lie to this fraud.
The 1930’s warming was a North American phenomenon (it also affected Canada) . No one hides that.

“The 1930’s warming was a North American phenomenon (it also affected Canada”
Wrong. The Early Twentieth Century Warming (ETCW) was global. All you have to do is look at any raw (actual temperature readings) Tmax chart from anywhere in the world to see it was just as warm in the recent past as it is today.
Can you show an unmodified Tmax chart from anywhere that does not show the ETCW? I can’t find one.
Your insistence on raw data ignores the need account for factors such as TOBS. Have you seen the posts on temperature adjustments on Judith Curry’s blog?
NOAA has already adjusted the near-1-billion record dataset for TOBS, siteing issues, and their ‘claimed’ quality control. Adjusted, redacted, and blacklisted thousands of stations.
Still … the raw data shows no abnormal heating or cooling.
“Still … the raw data shows no abnormal heating or cooling.” Show me.
Ironically there was a time when Anthony Watts was calling for adjustments for UHI, which BEST discounted as a factor.
And the
“To which I would add a comment from Steve Mosher, the skeptic who published the Climategate letters.
Christopher Booker win’s the irony of the year award with his piece on adjustments to the temperature record. That’s quite a feat considering it’s only February. His complaint overlooks the clear historical fact that skeptics, above all others, have made the loudest case for the need to adjust the temperature series. Over the years, it’s been skeptics, who have made a vocal case for adjustments . More disturbing is the claim that these adjustments are somehow criminal. We dealt with these type of claims before and completely debunked them.”
https://andthentheresphysics.wordpress.com/2015/02/09/guest-post-skeptics-demand-adjustments/
Jack Dale (I am disgusted having to type that for clarity)
Your attack on the integrity of skeptics is deeply cynical and odious. I suggest you ask Mr. Watts and others why they challenged the integrity of sites. If you attempt to build a case that it was done for some nefarious reason, something other than genuine scientific motivation to get the measuring right, please post it, because that will increase your infamy.
Ask Mr. Watts “Did if ever occur to you in your worst nightmare that NOAA would remedy the siting issues by blacklisting sites (400+ in USHCN alone since MannHansenDay, 1989), redacting posts, and injecting “estimated” posts right into the raw dataset, thus damaging the trend?”
And I repeat: even graphing this altered data, NOAA shows a cooling trend over the recent decades.
I will wreck you day by “showing that” in my next post.
This post is not directed to the current visitor, a CoolingDenier. It is ammunition for others. I welcome validation of my analysis, and/or any challenges. Please download GHCN and parse/graph it yourself.
NOAA collected 72,598,534 global TMAX recordings since 2007, and have posted them in .dly files, made available to everyone. These dailies incorporate all their adjustments; they are not fully raw.
The data say things are cooling. Not a “pause” in warming. A cooling trend. Globally. Here is my graph of it:
I will say one thing to the CoolingDenier: if you think TOBS records somehow record the precise numerical anomaly associated with Time of Observation Bias, that claim reveals your deep ignorance.
For others, please see these documents, included with the GHCN download, for information about NOAA’s policy and procedures for flagging, omitting, estimating, and redacting (stamped ‘missing’), as well as the explanation of what a TOBS record is.
GHCND_documentation.pdf
Readme.txt
The earth is cooling.
I see you have dropped to the bottom of Graham’s hierarchy.
Dr Roy Spencer’s satellite data from 2007 to 2020 shows warming.
2007 2 0.19
2020 2 0.76
https://www.nsstc.uah.edu/data/msu/v6.0/tlt/uahncdc_lt_6.0.txt
“Your insistence on raw data ignores the need account for factors such as TOBS. Have you seen the posts on temperature adjustments on Judith Curry’s blog?”
Have you seen the posts on temperature adjustments on Tony Heller’s blog?
https://realclimatescience.com/2020/02/zombie-climate-science/#respond
Tony shows you how the Data Manipulators manipulate the data to create a false picture of reality.
The only place where today’s temperatures are unprecedently high is in the computer-manipulated global temperature record. All the actual temperature readings made by human beings shows that it was just as warm in the recent past as it is today. There is no unprecedented warmth today which means that CO2 is not the control knob of the Earth’s atmosphere.
Judith Curry’s blog posts on temperature adjustments are the result of Heller’s claims.
She has called his analysis both “problematic” and “bogus”.
https://judithcurry.com/2015/02/22/understanding-time-of-observation-bias/
https://judithcurry.com/2014/07/07/understanding-adjustments-to-temperature-data/
https://judithcurry.com/2015/02/09/berkeley-earth-raw-versus-adjusted-temperature-data/
The name CoolingDenier fits, so wear it. Your attempt to ridicule whistle-blowers on siting issues was off the bottom of that hierarchy. Besides, you have been so thoroughly refuted here, the rest of us are at the top of that scale.
You have not touched my argument, that Earth is in its normal heating/cooling natural cycle, including the fact we are on the downslope right now.
Meanwhile, after another Jack avoidance display, the NOAA embarrassment of alarmist rhetoric refuted by their own manipulated graphs glares forth, and Jack does not fare well under such exposure.
And…satellites cannot measure surface temperature. Nor is there a 120-year continuity history for satellite measurement. Anyone (calling out Roy Spencer as the antithesis of this) who makes an inference that a troposphere measurement of a few years trumps a billion direct measurements of surface temperature is pitifully weak.
Here is Dr. Spencer’s 40-second calm explanation that (even his) satellite findings do not justify abnormal warming.
https://www.youtube.com/watch?v=sebdTtmIW5Q
With a display of NOAA’s data showing cooling since 2007 I am not shouting “Ice Age Coming,” etc. I’m saying (and NOAA cannot avoid saying):
The earth is rocking its natural cycles. There is no climate emergency.
Is Spencer’s data wrong? Is he in on the conspiracy?
Is there much study / comparisons of the sea levels and thermal expansion (assuming the expansion as a proxy for temp) and the change CO2 levels in the atmosphere (via out-gassing of the CO2)?
The unbelievable London Guardian newspaper has on its weather page a reading from Mauna Loa every day and the remark “Safe Level 350ppm”!! So we have here the potential to blow AGW out of the water. If I was Greta Thunberg I would be sweating big drops.
Roy wrote, “(The Pinatubo and El Chichon volcano eruptions actually caused a reduction in global CO2, probably due to post-eruption vegetation effects from an increase in diffuse sunlight penetration of forest canopies).”
Interesting!
Two other possible causes or contributors to that effect are:
● perhaps because particulates ejected by the eruption cooled the planet, which temporarily increased CO2 absorption by the oceans (because CO2 and other gases dissolve more readily in cooler water), and/or
● perhaps because iron and other minerals in the volcanic ash fertilized the ocean and thereby increased CO2 uptake by ocean biota (Sarmiento, 1993).
The effect of El Chichon (April, 1982) was slight, but the effect of Pinatubo was obvious:

I was going to say the same. Temporary cooling of oceans and the increased uptake of CO2 due to Henry’s law was the cause of CO2 decrease after Pinatubo eruption.
Can anyone see the dip in CO2 from the financial crash in 2008? Just lost in the noise.
JeffC
An alternative hypothesis to consider is that there is no correlation between atmospheric CO2 and the economic well being of the world because anthropogenic CO2 is not driving the rise in atmospheric CO2. Confounding the relationship is that the change in annual atmospheric CO2 is only about 40% of the estimated anthropogenic CO2 emissions. Speaking of “noise,” the anthropogenic CO2 production is a small fraction of the total Carbon Cycle, and it is not well characterized in detail.
In my lifetime the weather has been unpredictably predictable. Our weather and climate ‘medics’ have been forever scrabbling around for better data and a higher degree of resolution of that data just like other professions who deal in things that change. Some extreme weather events happen as they always have done and some panic ensues just as it always will. And then a ‘genius’ comes along and claims we are murdering ourselves slowly and surely because things we have naturally learned to do over time through scientific endeavour are somehow of a scale that is damaging our planet. The genius offers, as evidence, proof that a rise in CO2 is pushing temperatures up on an unprecedented scale. This genius is later found to have cooked the books but instead of being ridiculed and banished, those who have huge reasons to persist with this idea that we are killing ourselves, wish to protect the potential enrichment they have noticed in their own lifestyles. Meanwhile the planet ticks over sighs another ‘Whatever next?’ A battle ensues between those who wish to protect science and those who wish to protect their ill got lifestyles. Honesty moves a safer distance away from them.
Is human sourced carbon dioxide increasing? Of course it is since the population is increasing. Is it damaging the planet? Nobody seems to have a winning theory or clue about a) how that would work; b) how you could see it working; c) why the planet has cleaned up much bigger messes than this many times before. Nature doesn’t appear to registering this event as at all important and is very much business as usual.
How is it that in the twenty first century we seem to be going backwards?
“as long as the issue is of sufficient interest.”
This is of vital interest, because the whole basis of the “carbon budget” is based upon the idea that we can only emit so much CO2 before disaster awaits. Annual changes in Mauna Loa CO2 do not follow annual changes in in emissions. Annual changes in temperature do not follow annual changes in Mauna Loa CO2. Dead theory.
Professor Jamal Munshi
https://www.academia.edu/33779445/RESPONSIVENESS_OF_ATMOSPHERIC_CO2_TO_FOSSIL_FUEL_EMISSIONS_UPDATED
“The IPCC carbon budget concludes that changes in atmospheric CO2 are driven by fossil fuel emissions on a year by year basis. A testable implication of the validity of this carbon budget is that changes in atmospheric CO2 should be correlated with fossil fuel emissions at an annual time scale net of long term trends. A test of this relationship with in situ CO2 data from Mauna Loa 1958-2016 and flask CO2 data from twenty three stations around the world 1967-2015 is presented.
The test fails to show that annual changes in atmospheric CO2 levels can be attributed to annual emissions. The finding is consistent with prior studies that found no evidence to relate the rate of warming to emissions and they imply that the IPCC carbon budget is flawed possibly because of insufficient attention to uncertainty, excessive reliance on net flows, and the use of circular reasoning that subsumes a role for fossil fuel emissions in the observed increase in atmospheric CO2.”
See http://www.realclimate.org/index.php/archives/2020/03/further-perspectives-on-pandemics-and-climate-change/ to see how the alarmists are linking the two problems. I read that blog but I say little as I know I’d get smacked if I did.
Oh, regarding the notes at the bottom of the reply screen- one says “Notify me of follow-up comments by email” and the other says, “Notify me of new posts by email”. Not sure what’s the difference. What I’d like is to have an option that would only let me know if somebody replies to one of my comments. Once I checked one of these- and got dozens of other comments from a particular thread – not comments responding to my comment.
I noticed that also. I don’t check the “Notify” block, I just check back a few days later to see if anyone posted any followup comments,
If I look at the weekly data here
ftp://aftp.cmdl.noaa.gov/products/trends/co2/co2_weekly_mlo.txt
I see in the produced graph
http://camargue-flaamenco.de/Upload/CO2weekly.png
an lower peak (greeen line)
sorry
http://camargue-flamenco.de/Upload/CO2weekly.png
seems I have probs with mey keyboard,
In addition zoomed in the data 03/18 – 03/20
htttp://camargue-flamenco.de/Upload/CO20318-0320.png
Better detail view of what happend last month ’til march 15th
I really have kb probs: :–(
http://camargue-flamenco.de/Upload/CO20318-0320.png
I have seen satellite mapping of Asia showing atmospheric NO….. and northern China went down and now is recovering….sorry, no link. I assume it is manufacturing related and CO2 should be similar.
When the next UAH monthly temperature update is released, if it shows a reduction in the positive “anomaly”, it will be distorted by warmists as more proof of the direct link between CO2 emissions and atmospheric temperature, even if total atmospheric CO2 has not gone down.
Coronavirus could provide an unprecedented opportunity to establish once and for all the fraction of CO2 rise (eg at Mauna Loa) that is human caused.
If it is, then the steady rise in CO2 should be checked – there should be a discontinuity in the CO2 rise.
If CO2 continues to rises without the slightest change, this argues that the CO2 is coming from somewhere else. Such as ocean out gassing from warming.
The discontinuity to look for will be small. But with modern precise instruments, it should be clearly measurable.
A Popper alert to scare the alarmists 😁
If the CO2 is from outgassing we should see an increase in the ocean pH level.
Dale
You said, “If the CO2 is from outgassing we should see an increase in the ocean pH level.” The unstated assumption is that there is a one-to-one correspondence. That is, all the anthropogenic CO2 is going into Hawaiian surface waters. It is estimated that more than half of the CO2 goes into the oceans. However, the bulk is apparently dissolved in high latitude waters, sinks, and is not available for sampling. What is happening in Hawaii (NOAA graph) is not representative of all of the oceans. Upwelling and outgassing is strongest along the Equator and on the western shores of the continents. One might say that Hawaii is essentially anecdotal evidence.
seems you can see it here the is a discontinuity in the rise – I’ll follow the data and update the graph, here based on 3/18 ’til 3/20 15th – weekly data.
Excerpt: March 22nd, 2020 by Roy W. Spencer, Ph. D.
Roy Spencer, ….. I not only believe that the “steady & consistent” long-term rise (1958-2020) in atmospheric CO2 is a function of the continuing Interglacial Warming that restarted at the end of the LIA, …….. but I also believe the unquestionable and factual science that supports the aforesaid.
And Mr. Spencer, …… how can you possibly claim that “anthropogenic emissions accurately explain the Mauna Loa observations” ….. when there is NO, NONE, ZERO, ZILCH ……. “human signature” to be found anywhere within the 62 years of the Mauna Loa data. There are El Niño signatures, La Nina signatures, volcanic signatures …….. but no “anthropogenic” human signature(s).
To wit, actual factual data extracted from the Mauna Loa Record
1979 – 1994 YTD CO2 — “Max” ppm @ mid-May (5) … “Min” ppm @ end of Sept (9)
SD = summertime decrease May(5)-Sept(9) ….. WI = wintertime increase Sept(9)-May(5)
year mth Max ppm …………. mth Min ppm .. SD ….. WI …. yearly increase
1979 _ 6 _ 339.20 .. El Niño ___ 9 … 333.93 … – 5.27 … 7.54 …. + …..
1980 _ 5 _ 341.47 ……………… 10 … 336.05 …. -5.42 … 6.96 …. +2.27
1981 _ 5 _ 343.01……………… 9 … 336.92 …. -6.96 … 7.75…. +1.54
1982 _ 5 _ 344.67.. El Niño ….. 9 … 338.32 …. -6.35 … 7.64 …. +1.66 El Chichón
1983 _ 5 _ 345.96 ……………… 9 … 340.17 …. -5.79 … 7.38 …. +1.29
1984 _ 5 _ 347.55 …………….. 9 … 341.35 …. -6.20 … 7.57 … +1.59
1985 _ 5 _ 348.92 …………… 10 … 343.08 …. -5.84 … 7.45 … +1.37
1986 _ 5 _ 350.53 …………… 10 … 344.47 ……………………. +1.61
1987 _ 5 _ 352.14 ……………. 9 … 346.52 ……………………. +1.61
1988 _ 5 _ 354.18 ……………. 9 … 349.03 ……………………..+2.04
1989 _ 5 _ 355.89 .. La Nina .. 9 … 350.02……………………../ +1.71
1990 _ 5 _ 357.29 …………… 9 … 351.28 ..…………………… +1.40
1991 _ 5 _ 359.09 …………… 9 … 352.30 …………………….. +1.80
1992 _ 5 _ 359.55 .. El Niño .. 9 … 352.93 …. -7.25 … 7.26 …. +0.46 Pinatubo
1993 _ 5 _ 360.19 …………… 9 … 354.10 ……………………. +0.64
1994 _ 5 _ 361.68 …………… 9 … 355.63 ….………………… +1.49
All 62 years of the Mauna Loa CO2 ppm data portrays basically the same trend as noted above …… with the Keeling Curve Graph explicitly portraying the bi-yearly (seasonal) “sawtooth” cycling, including the “yearly increase” in CO2 ppm.
Iffen anthropogenic CO2 was causing a measurable effect on the MLR or the KCG …. then there should be a readily recognizable steady and consistent INCREASE in both the “wintertime increase” (WI) and the “yearly increase” in CO2 ppm …… to account for the increase in world population.
Dr. Spencer states: “It will take considerable evidence to convince me that the long-term rise in (CO2 is) not anthropogenic. ”
Now Roy S, …… is the exponential increase in world population during the past 80 years, ….. from 2.3 billion to 7.7 billion people, ….. be “considerable evidence that is satisfactory to your liking?
If so, …… then, to wit:
year — world popul. – % incr. — May CO2 ppm – % incr. — avg ppm increase/year
1940 – 2,300,000,000 est. ___ ____ 300 ppm est.
1950 – 2,556,000,053 – 11.1% ____ 310 ppm – 3.3% —— 1.0 ppm/year
[March 03, 1958 …… Mauna Loa — 315.71 ppm]
1960 – 3,039,451,023 – 18.9% ____ 320.03 ppm – 3.2% —— 1.0 ppm/year
1970 – 3,706,618,163 – 21.9% ____ 328.07 ppm – 2.5% —— 0.8 ppm/year
1980 – 4,453,831,714 – 20.1% ____ 341.48 ppm – 4.0% —– 1.3 ppm/year
1990 – 5,278,639,789 – 18.5% ____ 357.32 ppm – 4.6% —– 1.5 ppm/year
2000 – 6,082,966,429 – 15.2% ____ 371.58 ppm – 3.9% —– 1.4 ppm/year
2010 – 6,809,972,000 – 11.9% ____ 393.00 ppm – 5.7% —— 2.1 ppm/year
2019 – 7,714,576,923 – 11.7% ____ 414.66 ppm – 5.5% —— 2.1 ppm/year
Source CO2 ppm: ftp://aftp.cmdl.noaa.gov/products/trends/co2/co2_mm_mlo.txt
Based on the above statistics, to wit:
Fact #1 – in the past 79 years – world population has increased 235% (5.4 billion people) – atmospheric CO2 has increased 37.3% (112 ppm)
Fact #2 – human generated CO2 releases have been exponentially increasing every year for the past 79 years (as defined by the population increase of 5.4 billion people).
Fact #3 – the burning of fossil fuels by humans has been exponentially increasing every year for the past 79 years. (as defined by the population increase of 5.4 billion people).
Fact #4 – a biyearly or seasonal cycling of an average 6 ppm of atmospheric CO2 has been steadily and consistently occurring each and every year for the past 61 years (as defined by the Mauna Loa Record and Keeling Curve Graph).
Fact #5 – atmospheric CO2 has been steadily and consistently increasing at an average yearly rate of 1 to 2 ppm per year for each and every year for the past 61 years (as defined by the Mauna Loa Record and Keeling Curve Graph).
Conclusions:
Given the above statistics, it appears to me to be quite obvious that for the past 79 years (or the 61 years of the Mauna Loa Record) there is absolutely no direct association or correlation between:
#1 – increases in atmospheric CO2 ppm and world population increases:
#2 – the biyearly or seasonal cycling of an average 6 ppm of atmospheric CO2 and world population increases;
#3 – the biyearly or seasonal cycling of an average 6 ppm of atmospheric CO2 and the exponential yearly increase in fossil fuel burning;
#4 – the average yearly increase in atmospheric CO2 of 1 to 2 ppm and the exponential increase in fossil fuel burning;
#5 – there is absolutely, positively no, per se, “human (anthropogenic) signature” to be found anywhere within the 61 year old Mauna Loa Atmospheric CO2 Record.
#6 – this composite graph of 1979-2013 uah satellite global lower atmosphere temperatures and yearly May max CO2 accumulations is literal proof that anthropogenic causes, ….. green growing/decomposing NH biomass …… and/or near surface air temperatures have little to no effect whatsoever on atmospheric CO2 ppm quantities.
And ps, Roy, …… it is biologically impossible for the NH “wintertime” microbial decomposition of dead biomass to cause the biyearly (seasonal) increase of average 6 ppm in atmospheric CO2 as defined by the MLR and/or KCG. And likewise, the “green growing” biomass in the NH is not responsible for the biyearly (seasonal) ‘summertime” decrease of average 6 ppm in atmospheric CO2 as defined by the MLR and/or KCG.
Cheers, Sam C
The human signature is the Suess effect.
The human signature is the Guess effect.
there fixed it for you
@ Jack Dale
“The human signature is the Suess effect.”
Jack D, ….. here is the “junk science” you are citing, to wit:
But now, Jack D, …… research “facts” tell the correct story, to wit:
Impressive argument, Samuel
I’ve always been suspicious of the extremely smooth linearity of the Mauna Loa Keeling curve.
What kind of signature is a straight line?
I thank you for your kind response, Phil.
“the extremely smooth linearity of the Mauna Loa Keeling curve.”
Phil S, if your above statement was intended to be satire, ….. then it went “SWOOOOSH” right over my head.
But then, maybe, anyone with dyslexia that looks at this KC Graph probably can’t see the bi-yearly (seasonal) cycling that is denoted in “red” and can only see the “black” line that denotes the “average”, or to be more exact, the “black” line denotes the “average yearly increase” as a result of the ocean waters warming-up from the cold of the LIA.
It could still be caused by the effects of deforestation/land-use change. A significant extra addition to atmospheric CO2 input caused by the concomitant large scale destruction of carbon sinks.
The deciding evidence lies in the Δ14C measurements. We need to see an update to the Levine2013 paper with measurements from Jungfraujoch and the other site, whose name temporarily escapes me.
That was almost the exact point where atmospheric 14C should have fallen below the level observed before the atmospheric nuclear tests.
In short, if the extra CO2 is coming from “cold” fossil fuel sources then the 14C level will continue to fall below the pre-1945 levels at roughly 3% per annum. If the extra CO2 is coming from more recent carbon compounds (i.e. trees, soil, etc) then it will not be “cold” and the 14C levels will remain close to the pre-war levels. (Measurements and geo-biochemical assertions based on Δ13C measurements simply aren’t good enough.)
While I haven’t looked hard for an update to the Levine 2013 paper for a couple of years now, I’ll bet dimes for dollars that if was a clear-cut case in favor of the prevailing “consensus” then we might have a heard a lot about it.
I would be most grateful for anyone with the data making it public. Real scientists really do like to see the data, even if it proves them wrong. And the people doing the measurements appeared to be genuine scientists and I doubt that the projects were stopped at such a critical moment.
Excerpted from above commentary by Roy S:
But, ….. but, ….. but, …. there was an El Niño in progress at the same time those two volcanoes were “blowing their top”, …….and El Niño are noted for causing increases in atmospheric CO2, ……. see my above post.
Dr. Spencer we do have a precedence for this global shut down the years of 2014-2015-2016 That is a 3 years of baseline of manmade CO2 (no increase)
In the years 2014 though 2016 man made output of CO2 remained flat (using a standard base line) and actually declined during 2015 and 2016 This information is supplied by the Global Energy and CO2 Status report released in March of 2019 by the International Energy Agency (your tax dollars at work).
The CO2 detectors on Mauna Loa observatory of those years shows no corresponding leveling off (pause) in the rise in CO2. (in fact between 2015 and 2016 the rate of rise actually accelerated)
For the year 2013 CO2 was measured at 396.52 ppm
For the year 2014 CO2 was measured at 398.65 ppm
For the year 2015 CO2 was measured at 400.83 ppm
For the year 2016 CO2 was measured at 404.24 ppm
If man were causing the increase in CO2 wouldn’t a decline in output show a pause in the CO2 readings at Mauna Loa?
I am guessing that man made CO2 production dropped during the global recession of 2008 thru 2012 as well, with no concurrent drop in “MEASURED” CO2
https://www.iea.org/reports/global-energy-co2-status-report-2019
The volume of atmospheric CO2 measured at Mauna Loa is the well mixed residual, given SST and atmospheric circulation patterns for that year. Talk of Mauna Loa – atmospheric CO2 and the carbon cycle must include what the image in the link details. CO2 moves upward through the atmosphere and out past the 100km altitude. The following chart is largely ignored. Look at the seasonal movements, they are obvious even with only six data points per year.
Regards
http://saber.gats-inc.com/images/wn_0315_2.png
http://saber.gats-inc.com/news.php
Nice graph, Martin.
And “YES”, …… “the seasonal movements” (of CO2 ppm quantities) explicitly defines the “season” warming and cooling of the ocean waters in the Southern Hemisphere. 😊
As the waters “warm”, the atmospheric CO2 increases. As the waters “cool”, the atmospheric CO2 decreases. Henry’s Law, ya know.
Roy, you wrote
1. Also seen is the strong seasonal cycle as the vegetation in the Northern Hemisphere goes through its normal seasonal variations in growth and decay
2. The Pinatubo and El Chichon volcano eruptions actually caused a reduction in global CO2, probably due to post-eruption vegetation effects from an increase in diffuse sunlight penetration of forest canopies
That is your interpretation or assumption.
An alternative interpretation is based on the fact that the solubility of CO2 in the ocean decreases with increase in the ocean temperature. Based on this fact, the seasonal cycle in atmospheric CO2 is due to the seasonal cycle in ocean heat content with some delay. Similarly, the reduction in atmospheric CO2 after the eruptions of Pinatubo and El Chichon were due to the cooling of the ocean that absorbed more CO2 from the atmosphere.
I was also thinking of the effect of the reduction in human emission of CO2 due to the economic downturn as a result of COVID19 on the observed atmospheric CO2 concentration. Thanks for writing this very interesting article.
My expectation is even if human emission of CO2 were reduced to zero, the atmospheric CO2 concentration would continue to increase because the increase in atmospheric CO2 is caused by the warming of the deep ocean because of heat flow from the warmer mixed ocean layer to the colder deeper ocean since mid 19th century. This is based on the 2nd Principle of Thermodynamics that states “heat must flow downhill on the temperature scale” (Holman, 1981, p. 2)
Girma – March 23, 2020 at 12:43 pm
I agree, Girma, …… but with the one “noted” exception.
IMLO, it is NOT ….. the warming of the deep ocean water, ….. but simply the “continued” warming of the ocean surface layer …… from the “cold” of the Little Ice Age.
It was much “warmer” during the Medieval Warm Period, but we have no way of knowing what the actual atmospheric CO2 ppm was.
Samuel, how do you then explain the secular heat storage of the ocean during global warming and the release of this energy from ocean during global cooling?
“ the secular heat storage of the ocean ”
Girma, ….. did you per chance mean to say …. “circular heat storage” ….. as in reference to the Thermohaline Circulation?
If so, then learn more about it here: https://en.wikipedia.org/wiki/Thermohaline_circulation
Anyway, Girma, when the Sun, per se, crosses the equator, it “marks” the changing of the equinoxes from the “start of Spring-Summer” in the hemisphere the Sun is moving toward ….. or the ”start of Fall-Winter” in the hemisphere the Sun is moving away from. And the ocean “surface waters” react accordingly via “warming and melting ice” and “cooling and freezing ice”.
And when the ocean SURFACE waters (in their respective hemisphere) “cool down” (wintertime) they absorb copious amounts of atmospheric CO2. And when the ocean SURFACE waters (in their respective hemisphere) “warm up” (summertime) they emit copious amounts of atmospheric CO2.
And the ocean surface water in the Southern Hemisphere is the “control knob” for atmospheric CO2 simply because ……. the Northern Hemisphere is 60% land and 40% water, whereas the Southern Hemisphere is 20% land and 80% water.
Hope the above answers your question.
Samuel, my main point is that on average the mixed ocean layer is warmer than deeper ocean during the global warming since mid-19th century. As a result, because of the 2nd principle of thermodynamics that states “heat must flow downhill the temperature scale” there is a secular heat flow from the warmer mixed ocean layer to the colder deeper ocean.
During global cooling, the deeper ocean becomes warmer than the colder mixed ocean layer and heat flows from the deeper ocean to the mixed ocean layer to the atmosphere and to space. This mechanism explains the oscillation in the global mean temperature from the medieval warm period to the little ice age and to the modern global warming.
Willis:
I would have thought that the most obvious cause would be the surface cooling leading to more absorption from cooler sea water. The opposite to out-gassing.
Occam and all that.
Mucho apologies for the false attribution, I’d skipped from a Willis post and quoted Dr Spencer.
I still think Dr. Spencer is make too much of this. There is a clear relationship between dCO2 and SST on short to medium term. Attempting to “correct” for ENSO will just mask the obvious.
If Mt.P affects your ENSO metrics, like El Nino 3.4 SST, then you are already removing what you should be studying.
“ There is a clear relationship between dCO2 and SST on short to medium term. ”
“YUP”, …… the seasonal “cycling” of atmospheric CO2 ppm as defined by the MLR and/or KCG has been pretty much “steady & consistent” for the past 62 years ……. and there is ABSOLUTEY nothing that is or ever has been “steady & consistent” about human activities, near-surface air temperatures or weekly/monthly/yearly weather.
It is not a time lag, it is a differentiation that you need to look at: d/dt(CO2) vs SST. Or diff both a second time:
https://climategrog.wordpress.com/gauss_rm_fft/
https://climategrog.wordpress.com/d2dt2_co2_ddt_sst-2/
A naive time lag with be the quadrature of the dominant cycle ( annual already removed ) , 9mo lag from roughly 3 year cycles.
Forget CO2, what has the shutdown in China and reduced flying done to temperatures. Surely there has been reduced SO2 and contrails.
Both Italy and China have shown dramatic declines in NOx emissions.
https://www.space.com/coronavirus-pollution-emissions-drop-china-italy-satellite-views.html
About the US Economy Pause and the Wuhan virus:
If these drug treatments for the Wuhan virus work out and the US can go back to work full-time, then I think our economy will do just what Trump says it will do and bounce back in a V-shape.
Assuming the government arranges to makeup for the lost wages that folks have lost over these past weeks of idleness, the US economy should rebound and start functioning much like it was doing a couple of months ago, before the Wuhan virus showed up, when the economy was booming.
The US economy is dominated by domestic spending, with 75 percent of US Gross Domestic Product generated within the United States. The other 25 percent comes from foreign trade, with the bulk of that taking place between Canada and Mexico, with China being the third largest trading partner of the US.
So most of our economy is generated internally, and about half of the rest is generated between the US and Canada and Mexico, and I think if the government lifts the restrictions on movement, then people are going to go out and spend just like they did two months ago.
No doubt there have been some disruptions to the economy and we will have to adapt to some things, but if we can get back up and running in a short period of time then I think we will continue on down the road to prosperity, just like we were doing before the Wuhan virus hit.
It all depends on if the hydroxychloroquine/antibiotic combination or one of the other promising drugs will effectively control the Wuhan virus. The hydroxychloroquine/antibiotic path would be the easiest since it is cheap and we can ramp up production very quickly (which is happening even as I write).
So we have to wait on the medical clinical trials but I think if we keep getting reports that 100 percent of patients are being cured of the Wuhan virus, than I don’t think business or the public is going to want to wait too long.
They will be putting the politicians under pressure to get us moving, and from the way Trump was acting, it looks like he is eager to get things moving because he is seeing these medical results. Trump is “Chomping at the Bit”! As are the rest of us.
If “things get back to normal” before the the virus is wiped out the health care system will be overburdened and with more people sick, the economy will be in worse shape.
In Canada we are being given far more conservative estimates for the production of cures and vaccines. Ironic, eh?
Nope FDA approved it Tom, they had clinical history on the drug.
Yes, the malaria drug is approved for human use, but the FDA has not approved it specifically for use on the Wuhan virus. President Trump has authorized all US doctors to use these drugs on a “compassionate use” basis, so basically any doctor can prescribe hydroxychloroquine to their patients, if the doctor thinks it is warranted.
Meanwhile, numerous clinical trials are underway, including the biggest one of them all, the New York epidemic. Trump said New York will recieve a delivery of hydroxychloroquine tomorrow morning.
So, over the next 10 days we may see a dramatic reduction in the number of people infected in New York. New York might not need all those hospital beds and respirators like they were thinking.
I really hope you are right. I guess pragmatically even if it doesn’t work at least it stops the confusion and we get a clear yes/no answer going forward so the trial is a good thing.
“Yes, the malaria drug is approved for human use, but the FDA has not approved it specifically for use on the Wuhan virus. ”
Tom Abbott, …… what the hell makes the difference?
No one died because of that “malaria drug”, …….. did they?
Yes.
https://www.forbes.com/sites/tarahaelle/2020/03/23/man-dead-from-taking-chloroquine-after-trump-touts-drug-for-coronavirus/#6d1104f472e9
@ Jack Dale
“Yes. (people died)”
Shur nuff, Jack, …… stupid people do stupid things, to wit:
“Tom Abbott, …… what the hell makes the difference?
No one died because of that “malaria drug”, …….. did they?”
Samuel, I think you misunderstand my position. I’m all for using these malaria drugs, the more the better. I was just stating the legal technical issues as I understand them.
I apologize, Tom A, ….. I jumped the gun thinking about the FDA refusing a dying patient access to a “new” untested drug …… claiming it might kill them if they take it.
Worthwhile reading on chloroquine.
https://www.acsh.org/news/2020/03/20/chloroquine-coronavirus-not-so-fast-14650
Why is this worthwhile?
Chloroquine and Remdesivir appear evenly matched in virus inhibition graphs, although Chloroquine’s inhibitory effects seem to exceed those of Remdesivir at higher doses.
Blooms’ list of side effects for Chloroquine seem extensive, perhaps reflecting its hundreds of years of use. This side effects list should be particularly useful when doctors prescribe it, since, apparently, it will be used “off label”, and can only be given by doctors who know their patients’ conditions and medical histories.
No such list of side effects is provided for the drug Remdesivir in his parallel article, “Can Gilead’s Remdesivir Tame The Coronavirus?” although he clearly favors a “YES!” answer to his own question and touts its effectiveness and safety over Chloroquine’s.
The author does, howver, discloses his IRA holdings of Gilead in a footnote to the article.
Without putting too fine a point on this, Trump haters hate anything that bears the Trump imprimatur, including a reasonably safe drug with a long history that might help put an end to this lock-down crisis.
Some news:
“Top COVID-19 aspirants chloroquine, AbbVie’s Kaletra and a flu drug disappoint in clinical tests”
https://www.fiercepharma.com/pharma-asia/top-covid-19-aspirants-chloroquine-abbvie-s-kaletra-and-a-flu-drug-disappoint-clinical
China tests corona vaccine on first patients
“Above all, it’s one thing: a race with the United States.”
China had a headstart of a couple of months.
If the hydroxychloroquine/antibiotic combination proves effective against the Wuhan virus, then the U.S. population can go back to work full-time just as soon as there is enough of these drugs to treat every person in the USA.
Then, we can go to work, and if someone catches the disease, they can go to the doctor and get a five-day treatment of drugs which should clear the virus out of their body, so they will only have to stay away from work for a short period of time and when they return, they will be immune to any further effects from the Wuhan virus.
We can in effect attain 80 percent or higher herd immunity to this virus by doing this.
I listened to Trump’s news conference tonight and I would say this nation is going back to work within the month. Trump says he will decide the future path after his 15-day pause is up next week, and I think if the drug tests look good, then he is going to say let’s go back to work, we have this virus under control. Not eradicated yet, but well on the way, and it can’t hurt us now like it has in the past.
I think even if there are problems that develop with these treatments, Trump is going to get us going, using different methods that don’t depend on these drugs.
We are going back to work in weeks, not months, imo.
If the US is going back to work in weeks, Canada will build a wall.
You can just dig a big trench for the oil to run out of the tar sands, you aren’t going to use it anyhow. Then you just need a pile of feathers for anyone who gets thru the trench.
Rather mysterious the Mauna Lao station seems to have stopped giving its daily updates!!!
https://www.co2.earth/daily-co2
Do you think they know this is starting to expose the CO2 scam and are beginning to fiddle the raw data?
Why all of a sudden is the daily data unavailable????
yes I noticed that too. 21 and 22nd and 23rd unavailable and the previous dates show an increase in ppm
The Mauna Loa analyzer is currently down. No new data will be available until further notice.”
very suspicious
Value for March 25th has been posted, so hopefully the analyzer at Mauna Loa will be OK from now on. Value is around 1ppm higher than the last reported value on the 20th, but we need to wait to see if that holds up.
Apparently CO2 emissions are down.
https://www.severe-weather.eu/global-weather/covid-19-global-co2-slowdown-climate-fa/
I doubt anyone would argue that CO2 emissions will have dropped. The link suggests that atmospheric growth of CO2 at Mauna Loa has stalled. As I pointed out earlier to Geoff Sherrington, this is completely normal for this time of year. We need to wait and see what happens during April/May.
Last year the rate of growth kicked up at end March/early April towards its annual peak in May:
https://www.esrl.noaa.gov/gmd/ccgg/trends/weekly.html
I argue that and I have shown earlier above – the graph march 2018 – march 2020
again for you, latest date was march 15th
here
Krishna,
I was unable to view your earlier graphs, but I could see your latest one, so thanks for posting.
I was also a bit brief in my last comment and may not have been as clear as I should have been. I shall try to clarify my view and the reasons for it. First, I believe that most people, myself included, accept that CO2 emissions must have dropped recently due to the shutting down of industry (especially in China). Do you agree with that?
Secondly, and the point of Dr Spencer’s post, was to try to see if we can identify a reduction in the rate of growth of atmospheric CO2 at Mauna Loa, which could be a consequence of the reduced emissions. Geoff Sherrington and the link provided by Jack Dale both noted that atmospheric CO2 had been essentially flat (no growth) over the last few days/weeks at Mauna Loa.
As I mentioned to Geoff, I observed this characteristic a few years ago, and even asked Scripps what they thought was the cause. Using monthly data, it shows up as a reduction in growth rate at this time of year (Jan/Feb/Mar) and appears every year except for being (much) less clear in some El Niño years, which corresponds with the fact that we see higher growth during such years (less of a ‘pause’). If you look at this plot:
https://www.esrl.noaa.gov/gmd/ccgg/trends/
you will see the reduction in growth rate in early 2017, 2018 and 2019. In early 2016, there is a very slight reduction in growth rate, barely visible, that being an El Niño year.
If you look at the weekly plot at the same site (use “Last 1 Year” tab) you will see that last year the weekly values for March were actually dropping during the month. This year, we see the weekly rates being below the February monthly average from mid-Feb to mid-March. We also see that around this time of year there is much greater scatter in the daily data than at other times.
Does that help?
Jim,
I was also a bit brief in my last comment and may not have been as clear as I should have been. I shall try to clarify my view and the reasons for it. First, I believe that most people, myself included, accept that CO2 emissions must have dropped recently due to the shutting down of industry (especially in China). Do you agree with that?
Thats exactly the reason why I postet my graph, what’s missing are the coming weeks, if the values continuee to flatten as they seem to bee.
If there are new data, I’ll add the to my sheet.
Data from here
PS
you see, I postet the graph of the weekly data 3/18-3/20, so, why a tab on last year, you have the full graph, can’t fully follow your thoughts
If CO2 rates of increase do show a decline from their normal high point, they might be on the order of 5%. We should look carefully at the satellite data from MODIS showing the greening effect of plant mass.
The world is literally a greener place than it was 20 years ago…
Taken all together, the greening of the planet over the last two decades represents an increase in leaf area on plants and trees equivalent to the area covered by all the Amazon rainforests. There are now more than two million square miles of extra green leaf area per year, compared to the early 2000s – a 5% increase.
https://www.nasa.gov/feature/ames/human-activity-in-china-and-india-dominates-the-greening-of-earth-nasa-study-shows
Did you read what you posted? The greening is not associated with CO2, it is human activity.
“China’s outsized contribution to the global greening trend comes in large part (42%) from programs to conserve and expand forests. These were developed in an effort to reduce the effects of soil erosion, air pollution and climate change. Another 32% there – and 82% of the greening seen in India – comes from intensive cultivation of food crops.”
Jack,
I’m here to learn. Just so I’m clear… you’re saying there is no association between the terrestrial biomass and atmospheric CO2 levels. I hope you can clarify this.
There has always been an association between the terrestrial biomass and atmospheric CO2 levels. It is part of the natural carbon cycle which was in balance until we dumped 1.5 trillion tonnes of anthropogenic CO2 into the atmosphere by burning fossil fuels. Prior to the industrial revolution CO2 levels fluctuated between 180 and 300 ppm for at least 800,000 years.
There is no natural “”balance” in carbon cycle as you believe.
Without human activity, CO2, on longer scales is declining, stored in carbon, in plants, in oceans…
What do you believe, why in earth history the earlier high CO2 decreased over the time.
So, and now, here are the humans adding CO2 and plants start growing more, question of search of a new balance.
So is nature, time to understand it.
PS
In nature, nothing is in a balance, never ever :perid
Did you read what you posted? The greening is not associated with CO2, it is human activity.
Yes, we all read, I think, but you Jack have to read correctly:
Now, with the MODIS data that lets us understand the phenomenon at really small scales, we see that humans are also contributing.”
So, what wouldt you tells ??
Jack, your numbers are so precise…never below 180 and never above 300? Was that Mauna Loa station measuring all that time? Jack, you have a “man made CO2 global warming” Hammer….and you see a CO2 nail everywhere…and Hammer Time! Jack, we gotta have the plants for O2 and the plants gotta have CO2…at least 150 ppm or else ….Jack, tell us….what is the ideal temp of planet earth and what is the ideal CO2?
The 180 -300 ppm data is from the 800,000 year Vostok ice core data. That range is probably the Goldilocks one. We never got to to the 150 ppm mark in that time period. No one is trying to rid the atmosphere of CO2.
For economic development 13C seems about right. Different plant species are suited to different temperatures.
“Here we unify these seemingly contradictory results by accounting for non-linearity at the macro scale. We show that overall economic productivity is non-linear in temperature for all countries, with productivity peaking at an annual average temperature of 13 °C and declining strongly at higher temperatures. The relationship is globally generalizable, unchanged since 1960, and apparent for agricultural and non-agricultural activity in both rich and poor countries.”
https://www.nature.com/articles/nature15725
Jack, there are published graphs of CO2 and temp going back 40 million years….don’t ask me how accurate…but the graphs show no correlation between CO2 and temp…they show no permanent climate cycles….they do show a general decline in CO2 from thousands of ppm…apparently, Mother Nature wants to rid the atmosphere of CO2….Mother keeps putting CO2 in water…and rocks…and plant material…I believe we are very lucky that man came along and thwarted Mother’s plot to rid the world of atmospheric CO2. Have a nice day.
800,000 years of natural cycles that suddenly go off the scale. Check the correlation between CO2 and temperature. This was the Earth in which homo sapiens evolved and our food crops were domesticated.
http://ossfoundation.us/projects/environment/global-warming/myths/images/natural-cycle/Forcing-Temp_1.9wm2.png
Yes, bad homo sapiens started that agriculture…when was that….8000 years ago? Jack wants to starve our friends – the plants- and I want them to flourish with at least 1000 ppm CO2…come on folks…we can do it…..1000ppm CO2 by 2099. I just planted a tomato plant and some basil…love those plants…..and love that O2 from them…thank you plants everywhere…and Jack, keep cool…cooler temps ahead…Grand Solar Minimum. Have a nice day.
At 550 ppm Co2 the nutritional value of food crops is compromised.
https://www.nature.com/articles/nature13179
Increased CO2 results in increased predation by pests.
https://www.ncbi.nlm.nih.gov/pubmed/18375762
https://www.annualreviews.org/doi/abs/10.1146/annurev-ento-120811-153544
jack dale
you do realize that paper on CO2 at 550 ppm’s and crops in “nature” magazine was retracted…..
you probable should have Retraction Watch on your reading list.
Can you provide a link to the retraction notice please?
My search of Retraction Watch yielded:
“Your search – Impact of anthropogenic CO2 emissions on global human nutrition site:retractionwatch.com – did not match any documents.
Suggestions:
Make sure that all words are spelled correctly.
Try different keywords.
Try more general keywords.
Try fewer keywords.”
When Zharkova’s paper was retracted the URL showed:
“RETRACTED ARTICLE: Oscillations of the baseline of solar magnetic field and solar irradiance on a millennial timescale”
This is what the URL for Smith and Meyers shows. No retraction notice.
“Impact of anthropogenic CO2 emissions on global human nutrition”
There was a correction, no retraction.
“Correction to: Nature https://doi.org/10.1038/nature13179, published online 07 May 2014.
In this Letter, we ought to have cited four relevant references. The first two1,2, published after submission of the first version of our manuscript, report a cultivar-dependent reduction in wheat grain quality under elevated carbon dioxide (CO2) in an Australian Grains Free-Air Carbon dioxide Enrichment (AGFACE) experiment. A subset of these results was reported in two papers published in 2012 (refs. 3,4). Although our work was independent of these papers, we regret not citing them to highlight their relevance. The original Letter has not been corrected.”
The correction supported their conclusions.
Science says there will be no global cooling.
“Any reduction in global mean near-surface temperature due to a future decline in solar activity is likely to be a small fraction of projected anthropogenic warming. ”
https://www.nature.com/articles/ncomms8535
“Here we use a coupled climate model to explore the effect of a 21st‐century grand minimum on future global temperatures, finding a moderate temperature offset of no more than −0.3°C in the year 2100 relative to a scenario with solar activity similar to recent decades. This temperature decrease is much smaller than the warming expected from anthropogenic greenhouse gas emissions by the end of the century.”
https://agupubs.onlinelibrary.wiley.com/doi/full/10.1029/2010GL042710
https://climate.nasa.gov/blog/2953/there-is-no-impending-mini-ice-age/
Jack, you and your models have never been able to get it close to right. Yet you post the garbage on this site. Nice try. Models are not reality… and when the record of unreality is wrong, and you continue to follow them, you become (fill in the blank).
GCM are quite accurate. Some science for you.
“Early climate models successfully predicted global warming
Climate models published between 1970 and 2007 provided accurate forecasts of subsequently observed global surface warming. This finding shows the value of using global observations to vet climate models as the planet warms.”
https://www.nature.com/articles/d41586-020-00243-w?
You are fooled at how they perform back testing which is that when they know the answer already they tune a model to reproduce what they already know. That is not prediction. That is a curve fitting exercise. That is why they have all been wrong. ALL OF THEM at predicting anything that happens in the future. You are not very science literate and confuse politics with science.
“Before applying their method, they found that 10 projections were consistent with observations.”
So 10 out of 17 were “consistent” (that would be about 65% agreed) then the applied their method, to make their models agree more.
“Moreover, on the basis of GMST forecasts alone, it is hard to predict, for example: to what extent sea level will rise; how ocean acidification caused by uptake of atmospheric CO2 will influence marine ecosystems; and the frequency and magnitude of future fires, droughts and floods.”
I don’t know how you missed that in the “research”
I did see that. I also understand the difference between “projection” and “prediction”.
Did you see the correction rather than the retraction of Smith and Myers?
Nature listed the paper with a letter of “concern”.
double speak for “Things are wrong in this paper and we are thinking of reacting it.”
I am somewhat impressed that you found the letter of concern. I will give you kudos for that, sorry a lot of people don’t do just a few more clicks on their computer to get to the truth of science or sudo science.
Where is the “letter of concern”? Please provide a link.
The correction was the addition of references that supported their conclusion. The correction was made by the authors of the study.
There is no indication of ” “Things are wrong in this paper and we are thinking of reacting (sic) it.”
I found a correction, not a letter of concern.
BTW – what is “sudo science”?
Dale
You quoted, “Early climate models successfully predicted global warming
Climate models published between 1970 and 2007 provided accurate forecasts of subsequently observed global surface warming.”
For another take on the claim:
https://wattsupwiththat.com/2018/06/30/analysis-of-james-hansens-1988-prediction-of-global-temperatures-for-the-last-30-years/
Hausfather looked at 17 models.
Your singular assessment of one paper might well be regarded as cherry-picking.
Jack Dale
Yes, a single paper could be considered Cherry Picking were it not for the fact that the alarmist community praises the Hansen results and it is similar to the other 16 papers that Hausfather looked at. The modelers operate with blinders and loose definitions of what constitutes skillful results. It is a case of no one in the modeling community being willing to acknowledge that “the king has no clothes.”
I’ll pile onto that:
The alarmist community considers the Keeling rise, which is the only direct measurement of CO2 of any length (only 60 years) to be rock solid indisputable foundational substantiation of their entire project. They fall back on it as though it were The Axiom of Existence.
On the other hand, they dismiss the authority of nearly One Billion Direct Measurements of surface temperature around the world, which display no abnormal warming or cooling.
Which is it, warming advocates? Do extensive direct measurements reveal the truth or not?
Sudo science is a program that you can input data, but others determine the out come, no matter what you input.
I suspect you mean pseudoscience.
“Overall, we rate Watts Up with That a strong pseudoscience and conspiracy website based on the promotion of consistent human influenced climate denialism propaganda.”
https://mediabiasfactcheck.com/watts-up-with-that/
https://en.wikipedia.org/wiki/Sudo
I say (type) what I mean and mean what I say (type).
climate scientist can input any kind of data and it still come up warming.
Yur link contains at least one big error:
“~factcheck”
😀
mediabiasfactcheck a source for information????
“The Columbia Journalism Review describes Media Bias/Fact Check as an amateur attempt at categorizing media bias and Van Zandt as an “armchair media analyst.”[2] The Poynter Institute notes, “Media Bias/Fact Check is a widely cited source for news stories and even studies about misinformation, despite the fact that its method is in no way scientific”
Thats from wikipedia so make of it what you will.
Overall, Jack Dale is rated as a left wing political activist who supports the pseudoscience of Mann and Hansen and others….he lives in Canada where Comrade Trudeau may build a wall to keep Canadians from fleeing …will Comrade Trudeau go for the Cuban model or the Venezuelan model? Comrade Jack denies climate cycles…the Little Ice Age…the Roman Warming Period…the Dark Ages Cooling…the Medieval Warming Period…why is Comrade Jack a Denier of Climate Cycles? Maybe the coming Grand Solar Minimum will convince him? No, he is a Denier.
Actually we are building a wall to contain Americans who will be leaving to try to take advantage of our universal health care after Trump restarts the economy and the outbreak around Easter.
There will be no cooling.
NASA says so. https://climate.nasa.gov/blog/2953/there-is-no-impending-mini-ice-age/
Science says so.
“Any reduction in global mean near-surface temperature due to a future decline in solar activity is likely to be a small fraction of projected anthropogenic warming. ” https://www.nature.com/articles/ncomms8535
“Here we use a coupled climate model to explore the effect of a 21st‐century grand minimum on future global temperatures, finding a moderate temperature offset of no more than −0.3°C in the year 2100 relative to a scenario with solar activity similar to recent decades. This temperature decrease is much smaller than the warming expected from anthropogenic greenhouse gas emissions by the end of the century.”
https://agupubs.onlinelibrary.wiley.com/doi/full/10.1029/2010GL042710
However, for those who dismiss science, I am selling glacier insurance as sideline to my pet care service who believe in the rapture. Both are cash in advance.
“There will be no cooling.”
You’ve already been corrected on that by me and many others.
It is currently cooling.
So, you are denying.
It is not cooling, nor will it cool.
You are as bad as Don Easterbrook, Syun Akasofu, Habibullo Abdussamatov, Joe D’Aleo, and Nicola Scafetta; all of whom predicted cooling that never happened.
It is warming.
1) never heard of them;
2) I don’t run screaming in panic to other authorities to either refute other’s claims or support mine;
2a) I collect data, parse it, and examine it for the organic sine wave trend that is always evident;
2b) you never do anything else but go running out the room like that.
3) It is cooling now, the downslope of the 35-year 4F cycle;
4) it is cooling now, the downslope consisting of two larger cycles over 140 years;
5) it is cooling now, the downslope of the Holocene since the Younger Dryas;
6) it is cooling now, the downslope of the fiery creation of the sun and earth 4.5 billion years ago.
There is no abnormal warming of the earth.
https://news.yahoo.com/in-the-coronavirus-pandemic-carbon-emissions-have-fallen-but-climate-change-remains-an-existential-threat-140002670.html