Catastrophic shock to US agriculture would deplete reserves, including those of other countries
Frontiers
The American Dust Bowl of the 1930s – captured by the novels of John Steinbeck – was an environmental and socio-economic disaster that worsened the Great Depression.
The Dust Bowl was an extreme event. But due to climate change, massive crop failures are more likely to happen again in the future. New research in Frontiers in Sustainable Food Systems aimed to answer what these impacts may look like.
The Dust Bowl was centered on the Great Plains of the USA, where decades of unsustainable deep plowing had displaced native, moisture-retaining grasses. An atypical La Niña then brought intense droughts, high temperatures, and strong winds which blew away the topsoil in the form of large-scale dust storms.
Apart from its direct impact on people (around 7,000 deaths and two million homeless), the Dust Bowl had a catastrophic effect on crops where wheat and maize production in the USA plummeted by 36% and 48% during the 1930s.
Currently, the Intergovernmental Panel on Climate Change predicts that in another three to four decades that most of the USA will have further warmed by 1.5-2 °C. This compounds issues that already exist today, where global food security is under pressure from the increased frequency of extreme weather events.
“We wanted to forecast how a multi-year production decline in a major exporting country, similar to that which occurred during the Dust Bowl, would affect modern food supplies globally via international trade,” says first author Dr Alison Heslin, a postdoctoral researcher at the Center for Climate Systems Research of Columbia University and NASA’s Goddard Institute for Space Studies.
“In today’s system of global food trade, disruptions are not bound by borders. Shocks to production are expected to affect trade partners who depend on imports for their domestic food supply.”
To assess the possible impacts of a second dust bowl, the authors first developed two alternative computer simulations of the worldwide trade in wheat. They then delivered a shock to these model systems in the form of a four-year-long Dust Bowl-like anomaly, restricted to the USA.
Under one simulation, countries first use their reserves and then divide the absorbed shock between imports and exports, propagating it in one direction by increasing imports and in another by decreasing exports.
Under the more complicated second model, the USA first reduces only its exports, propagating the shock to all receiving trade partners, after which all countries with a shortage respond by increasing their imports.
Their results predict a severity similar to that of the original event, estimated from historical data. The results show that the USA would fully exhaust 94% of its reserves over the first four years of a Dust Bowl-liked agricultural shock.
They also show that without exception, all countries to which the USA exports wheat would decrease their reserves, even though they didn’t themselves suffer crop failure.
“We focused on a subset of the possible impacts, specifically changes in trade, drawing down strategic reserves and decreases in consumption,” says co-author Dr Jessica Gephart, Assistant Professor at the Department of Environmental Science of the American University in Washington DC.
“We found that global wheat trade contracts and shifts toward other wheat exporters, and that wheat reserves around the world decline, in many cases to zero. This suggests that the impacts would not only raise prices for US consumers but would also raise prices far beyond the US borders,” says Gephart.
Key impacts of another four-year dust bowl could include an initial 31% loss of global wheat stocks, and by the end of the four years, between 36-52 countries could have used up over 75% of their starting reserves. The 10 countries with the highest initial reserves (China, USA, India, Iran, Canada, Russia, Morocco, Australia, Egypt, Algeria) would see their reserves decline by 15-22 % relative to the starting points.
However, a silver lining is that due to the high initial starting point of global reserves, most supply shocks, even in countries without reserves, could be addressed through trade flow adjustments without reducing consumption.
“Our results remind us that mitigating climate risks requires accounting for not only the direct effects of climate change, like local extreme weather events, but also the climate impacts which travel through our interconnected system of global trade.”
“In the context of food security, we show that accessing food reserves can, for a time, buffer populations from trade-induced supply shortages but as reserves deplete, people are at risk of food shortages,” says Heslin.
###
Notes to Editors
Please link to the original research article in your reporting: https://www.frontiersin.org/articles/10.3389/fsufs.2020.00026/full
This article by Dr Jessica Gephart appears to be nothing more than pure alarmist pseudo-scientific modelled extrapolations of Global Warming / Climate Change. It could mark a new low-quality level.
Well said, nicholas.
Regards,
Bob
In America the only things in severe decline are Common Sense and Critical Thought.
Yes, blatant scaremongering. The conditions during the ’30s (mass-influx of farmers plowing & eliminating ground cover) aren’t going to be repeated. The real problem would be a sudden cold period that would kill the prairie grass en masse & cause dust storms, like what occurred during the Younger Dryas.
At that time, farming practice was to till alternating halves of your land to black soil to incorporate the trace elements in the straw back into the soil, the only fertilizer readily available. This resulted in huge dust storms and valuable topsoil being blown away. By the 1950’s farms were often 1/3 tilled to black fallow “summerfallow”, 1/3 “Stubble” which was crop grown on land that had not not laid fallow the previous year, and 1/3 crop on land that had laid fallow the previous year and had higher yield. Of course, across the continent, this methodology varied quite a bit depending on local area normal rainfall, ie “climate”. The economical availability of fertilizer made from natural gas becoming common use in the 1960’s resulted in present day farming practice that allows the straw to stay on surface where it holds moisture, stops soil from blowing away, and still eventually becomes part of the topsoil, and results in high yield. Probably the “climate” was secondary to “farming practices” as a cause of “the dirty Thirties” as far as crop production. My source for this info…my father and grandfather’s farming experience on the same farm since 1922, where the model T frame converted to horse drawn in the 30’s still sits in the trees.
Thanks for the info, DMacKenzie. Yes, it was hot & dry in that area in the ’30s, but I’d bet the same conditions had occurred there several times before & the prairie grass had kept the soil intact enough to avoid a “dust-bowl”. However, the Maryland Chesapeake Bay area shows 3 feet of “loess” deposited there from the US central plains during the Younger Dryas, a very cold/dry period. Now, THOSE were dust storms.
The article does not address the fact that it is globalization and the ability to move food stocks around the world that have alleviated famine.
The only famines that occur now are purpose built by humans.
Of course, you need all those nasty hydrocarbons to move all that food around the world to where it needs to be.
They could have at least acknowledged that
THE REAL CLIMATE CRISIS IS NOT GLOBAL WARMING, IT IS COOLING, AND IT MAY HAVE ALREADY STARTED
By Allan M.R. MacRae and Joseph D’Aleo, October 27, 2019
https://wattsupwiththat.com/2019/10/27/the-real-climate-crisis-is-not-global-warming-it-is-cooling-and-it-may-have-already-started/
The real crisis is neither global warming nor a common cold virus. It’s the MSM.
Amen!
And sea ice has increased….it is the “canary in the coal mine”, warmunists have told us so for 30 years !
http://ocean.dmi.dk/arctic/icecover.uk.php
It is also ignorant to suggest it only happened in US:
Canada: https://www.cbc.ca/history/EPISCONTENTSE1EP13CH1PA2LE.html
Australia: https://www.smh.com.au/national/drought-conditions-worse-than-1930s-20091126-jtey.html
South Africa: https://stevengoddard.wordpress.com/2011/08/10/1933-severe-drought-in-south-africa-2/
World dirty 30s anyone?
I can’t believe that NASA still exists and to do this. If there ever was one, it’s the true bureaucratic equivalent of a blob. Giving this money to farmers would make agriculture better.
I find nothing in the study where the authors try to calculate the probabilities that a new dust bowl will happen. They just make the assumption that the probability of it happening is 100% – due to climate change of course.
Without knowing the probabilities of occurrence there is no way to judge possible mitigation strategies for implementation.
In other words, this study is pretty much useless for guidance by policy makers and/or the agriculture industry.
Well, and did they release their simpleton model? Modeling and simulation only gives a decent result if the model is correctly constucted. Fast computers have made people stupid. What does she know about all the variables in farming? These people think reality is a special case of their simulation.
Obviously that’s why so many people died during the medieval warm period, and thrived during the Little Ice Age. Makes perfect sense.
Warmists always get the wrong end of the stick.
Yes, but why do they poke out both their eyes with it?
The 1930s dust bowl WAS caused by climate change. There is a clear 35-year sine curve through 4F, and the 30s was at the top of the prior hill. Prior to the one we are sliding down now, that is, which in turn is the downslope of the hill Mann and Hansen rode up to glory.
Climate changed, and the world (not just the Great Plains of the USA) got hot. Now it is cooling.
Here’s the graph:
http://theearthintime.com
Temperature is cyclical, not linear.
I won’t defrag the rest of this piece, as it only consists of alarmist propaganda based on models that do not see the 20s-30s hill, and which are failing now, on the downslope of it.
Thanks for that link. I have an almost exact replica on a business card I created in the early 2000’s…the recent cooling fits exactly where it should be. If you go back and scan the NYTimes headlines for the last 150 years, you will see the repeated claims of global warming and coming ice ages every 35 or so years…
Those headlines can be found by searching – it has been years since I did it last.
windlord-sun:
Excellent plots, simple is good as is a large data set.
Born early in the 60’s I recall sledding in deep snow in the east TN and having to make up snow days before summer recess. By the 70’s I recall rumor of ice age coming but (the clever propaganist?) managed to plant the seed: CO2 will offset the coming chill. By the mid-80’s dust appeared on the Appalachian Trail along the NC/TN border at elev 6000 ft. Snow DRIFTS in north GA in 1993! By 1999, dead rhododendrons up in the Smokey Mtns…then came Y2K and the and Gore lost the election…at the top of the cycle he began his crusade to destroy the American energy business.
That said, your temp plot fits neatly with my life weather experiences…if you made all that up you did a darn good job!!
Well before your post I had already noticed that my generation was born near the bottom of the cycle and that the clever propagandist may tailor the MSM weather fear blitz accordingly…but Al got out of phase and now they are desperate to complete the destruction of the American economy before even the average TV viewer begins to notice that there is nothing wrong with the weather. Perhaps the Coronasarus is direct evidence of this desperation.
All that said, I plot data for a mtn town in western NC. I see an increase in precip & CO2 over my life time which I sense is indicative of a cooling trend. This sense as been strengthened by reading Jim Steele’s “Landscapes & Cycles” book which has tied everything neatly together for me both as a hiker and as a process engineer…seeing a fir tree recently at the southern extreme of its range and at low fringe of its altitude band…on a SW slope…that germinated this century…how can this be…
So, the “higher lows” in your US min temp plot fits well with more of the GHG H20 in the atm….perhaps the ventilating oceans are not only increasing atm H2O but CO2 as well…this would seem to explain the reason CO2 is said to increase before cooling spells…..even before humans got a hold of fire.
Plots of precipitation data would be interesting to see over laid on your temperature plots.
@meiggs
I agree about the desperation evident as both reality and the climate models refuse to cooperate! They are losing it, and calling louder than ever for authoritarian coerced ‘solutions.’
NOAA does issue PREC records for the stations, as well as SNOW. So that overlay could be accomplished. It is far down on my list of ToDo, however.
“I plot data for a mtn town in western NC. I see an increase in precip & CO2”
1) you are measuring CO2? What does your graph over time look like?
2) are your recordings part of GHCN?
windlord-sun:
I am not a programmer nor statistician, my numbers are from the WWW and I recognize they may be problematic. But when I get into heated discussions with alarmists I like to ask them if they’ve ever read any books about weather? Looked at any data? Ever lived and worked outdoors 24/7 for months on end off & on over the years? Ever got to know the real world? That’s usually when they get emotional, call me names, and then never speak to me again. So be it.
Meanwhile, I get “average” annual temperature and precip numbers from NOAA following links. I think I also got spots from NOAA & Silso and got CO2 from the sealevel link below.
I’ve plotted precip, ave temp, spots and CO2 on one overlay. I’ve tried to snip it and post on wuwt but no luck.
Precip, Asheville, NC
yr 1869:
38 inches precip
Ave temp 53F
CO2 (poly trend) ~290 ppm
spots (poly) ~110
yr 2019:
57 inches precip
Ave temp 58F
CO2 (poly) ~410 ppm
spots (poly) ~20
Not very scientific but tree rings that I’ve seen in the area with my own eyes (cutting fire wood) corroborate the dry spell indicated in the late 1800’s. And I’ve watched the rain here for the past 15 yrs, trend based on moldy back packing gear is wetter…and seems to match the numbers.
https://w2.weather.gov/climate/index.php?wfo=gsp
https://www.weather.gov/media/gsp/Climate/AVL/newAVLmonthlyPobs_htm.pdf
http://www.sidc.be/silso/datafiles#total
https://www.swpc.noaa.gov/products/solar-cycle-progression
https://sealevel.info/co2.html?co2scale=2
https://www.swpc.noaa.gov/products/solar-cycle-progression
“Climate changed, and the world (not just the Great Plains of the USA) got hot.”
Good point. These reseachers ought to check out the weather and the agriculutural output of the other nations of the Earth during the 1930’s. It wasn’t just the United States that was experiencing extreme weather during the 1930’s. It was a global heat wave. Look at any Tmax chart from any region on Earth. Or look at any newspaper from the era.
Hi Tom,
If I had time I’d parse the PERC and SNOW records of GHCN to attempt to validate by NOAA’s .dly data the precipitation curves around the world in the 1930s. I don’t have time. Anyone else?
In the meantime, both our host Mr. Watts and Tony Heller have chimed in on the fact that the 1930s drought was world-wide. [yes, exacerbated in the US DustBowl by plowing and land use mistakes]
This WUWT article … scroll down the comments to get links if you want to go deep on the world-wide claim.
https://wattsupwiththat.wordpress.com/2015/05/04/study-warm-oceans-caused-hottest-dust-bowl-years-in-193436/
@windlord-sum: I respectfully disagree. Good scholarship (nicely summarized in “The Worst Hard Time”) makes it clear that the Dust Bowl was not a climatic event. None of the productive agricultural land of the plains (such as produced the Joad family) was involved. Rather, the dust bowl resulted from bringing marginal, virgin plains west of the 100 meridian under cultivation after an abnormally wet period (and the abnormally high price for wheat following the post-World War I price slump) made that region appear tenable for wheat farming (erroneously, as it turned out). When that region reverted to its mean rainfall and those farms failed, there was nothing left to keep the denuded soil in place and massive wind erosion resulted.
The Dust Bowl was caused primarily by absolute ignorance of how to farm appropriately in the New World, you should go and read ‘Trees as Crops’ by Professor Russell Smith, who will tell all you Americans what you did to destroy millions upon millions of hectares of land.
If you want another dust bowl, plough deep, let topsoil get blown away, do not have strong rooting structures on sloping ground and generally think that you are able to do whatever you want, whenever you want, wherever you want without nature coming back to bite you.
The dust bowl was humans causing nature to do things, not nature doing it on its own.
So the 1930s dust bowl was caused by CO2 emissions I presume.
The opposite.
The 1930’s were hotter and dryer than now.
This is true even though the temperature record has been falsified to show current temperature as the hottest evuh.
The reason there is no dust bowl now is that CO2 increase in air has strengthened the ability of plants 🌱 to thrive in dry conditions, by increasing the efficiency of photosynthesis and decreasing stomata water loss associated with photosynthesis.
Dust bowls, recent (1930’s) and further back (last glacial maximum) are caused by CO2 starvation.
Trying to prevent dust bowls by decreasing CO2 is like trying to save a drowning person by pushing them deeper underwater.
Warmists always get the wrong end of the stick. 😎
It was natural — the next one, if there is one, guaranteed un-natural.
Hopefully, extensive modern irrigation will help some, and modern transportation will help more.
Show me an impending Dust Bowl (which happened before CO2 causation was plausible) in this data:
https://www.giss.nasa.gov/research/briefs/delgenio_02/
This is why GISS ‘homogenise’ the data – to remove embarrassing facts that contradict their narrative. They aren’t the only ones – the UK MET Office and AU BOM do the same.
Poor farming practices aggrevated the effect of the low rainfall.
Improved practices such as minimal cultivation have since reduced the effect of dry conditions, although in some areas two years accumulated rainfall are needed to grow one year’s crop.
The one problem with minimal cultivation techniques is that they are very dependant on the use of Roundup, aka glyphosate, to kill weeds and volunteer plants.
If the use of glyphosate is banned then farmers will have to revert to ploughing and cultivations for weed control with their attendant risks.
This reads like the old “desertification of the southwest” alarm that was hot for a while but then it died out. This this time around it is being interpreted in terms of agriculture and agricultural economics and also spiced up with the invocation of the Dust Bowl.
Maybe it is the lead up to COP26 phenomenon. In the past the the approach to what were considered important COPs always created a flurry of bad news that needed urgent climate action
https://tambonthongchai.com/2018/11/22/agwdrought/
When I went to the local supermarket Monday, senior discount day, they were out of oat-based cereal. So I bought cornflakes. I put blueberries and yogurt on it and ate some, no problem, looks like I will survive. I’m guessing the WSA, under the Dust Bowl scenario described above, will also survive. Almost time for a drink.
Try some Byrrh, wards of the Coronasarus.
Models haven’t done well at showing what is, yet. I guess that leaves us with what if.
Maybe farming will stop in certain regions, but grant farming will never stop.
Simulated data = simulated science
For anyone interested in one of the apocalyptic cascades is Archibald’s book “Twilight of Abundance: Why Life in the 21st Century Will Be Nasty, Brutish, and Short” available at Amazon, etc.
Disruptions caused by nature in the food supply chains do not need assistance from the global warming “sustainable” crowd unless they desire mass famine. And if famines do occur, the Wu-Wu will seem like the good times.
It was painful for the farmers on the Great Plains. Some years, they couldn’t grow a crop and it was so dry that they had to watch their topsoil blow away with the wind. The years they did get a good crop, the prices were so low they didn’t make money anyway. Say what?
The Dirty Thirties didn’t have that much effect on the world wide supply of wheat or on wheat prices. link
Biggest problem with their model is that the world doesn’t depend on the US for wheat anymore. Russia, Ukraine, Canada, Australia are huge world suppliers and the US has shifted to corn and soybean production.
Canada has also shifted. Wheat accounts for only around 1/3 of field crops. link
China is the world’s top wheat producing country, followed by India, Russia, the United States and France.
“The Dust Bowl was an extreme event. But due to climate change, massive crop failures are more likely to happen again in the future.”
What climate change? Most of the US is *cooling*!
“Currently, the Intergovernmental Panel on Climate Change predicts that in another three to four decades that most of the USA will have further warmed by 1.5-2 °C.”
Are these people insane? This is AVERAGE temperature! It has nothing to tell us abut maximum temperature which is what really impacts the harvest of grain crops. This is nothing more than the typical psuedo-science we are seeing more and more from our supposedly educated academia – they can’t even understand that an average can go up by the minimums going up just as easily as by the maximums going up! Did these so-called scientists fail 8th grade math?
“To assess the possible impacts of a second dust bowl”
First you must assume that there will be a second dust bowl. This would require that agriculture is still using the practices common during the 20’s and 30’s. Again, sheer idiocy. Agriculture has progressed significantly since then. It would also require that rainfall *decrease* to the levels of the 20’s and 30’s. There is absolutely no evidence that this is going to happen in the US. In fact, too much rain is becoming more of a problem in the central US than is too little rain!
The authors of this study live on the east coast or in foreign countries. It is obvious they have little, if any, actual experience with the current weather trends in the central US let alone actual knowledge of agriculture practices. Not a single one has any degree in agriculture or an associated field. This entire study is nothing but propaganda from climate alarmists. They may as well have studied what would happen to central US agriculture if a dinosaur-killing meteor were to hit Kansas City!
There was a study, published in the last couple of years, on Great Plains drought. If memory serves, the main source of data was lake deposits going back several thousand years. As in California, it found that extended, very dry periods had occurred rather often. While the dust problem may have had much to blame on agricultural practices, the dust bowl years drought appeared to be a ‘minor’ episode in the longer term climate.
“We wanted to forecast how a multi-year production decline in a major exporting country, similar to that which occurred during the Dust Bowl, would affect modern food supplies globally via international trade.”
Start with your desired conclusion. Climate science.
Ignore the empirical results of the ethanol experiment. Although that was diversion of production to wasteful purposes, not a loss of total production, the same effects. Plus destruction of “native” ground cover to plant acreage that was non-economic for useful purposes.
Fortunately, in the real world, elevated CO2 makes crops more more productive, more water-efficient, and more drought-resilient, thereby reducing the risks to food security associated with droughts. See:
https://wattsupwiththat.com/2019/01/21/co2-and-crops-nas-vs-science/
E.g., wheat:
Fitzgerald, G. J. et al (2016). Elevated atmospheric [CO2] can dramatically increase wheat yields in semi-arid environments and buffer against heat waves. Glob Change Biol, 22: 2269-2284. doi:10.1111/gcb.13263
Here’s how U.S. wheat yields have been trending:
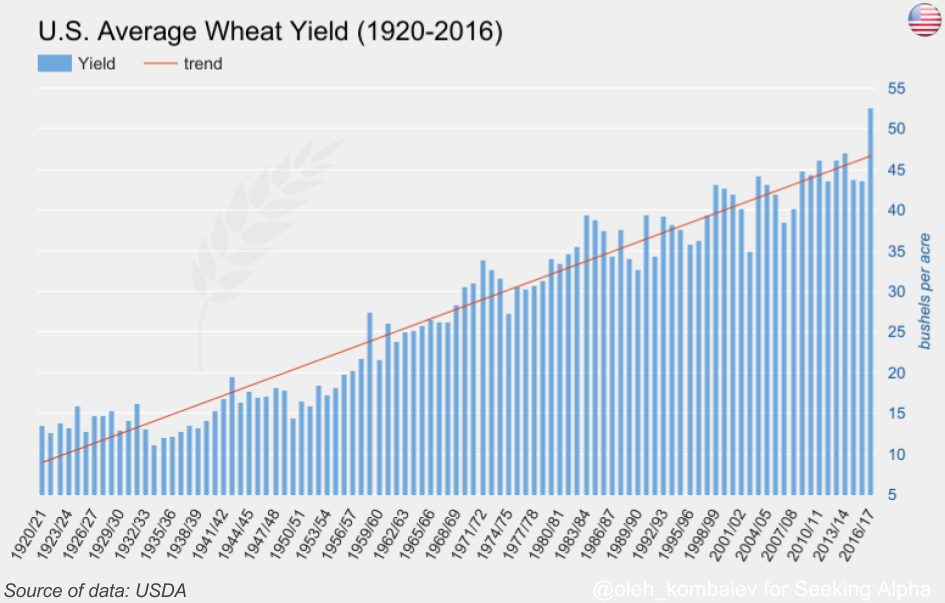
Claims that a couple of degrees of warming would be catastrophic for such crops are absolute crackpottery. Look how the climate/growing zones compare to the range over which wheat is cultivated:
Wheat range:
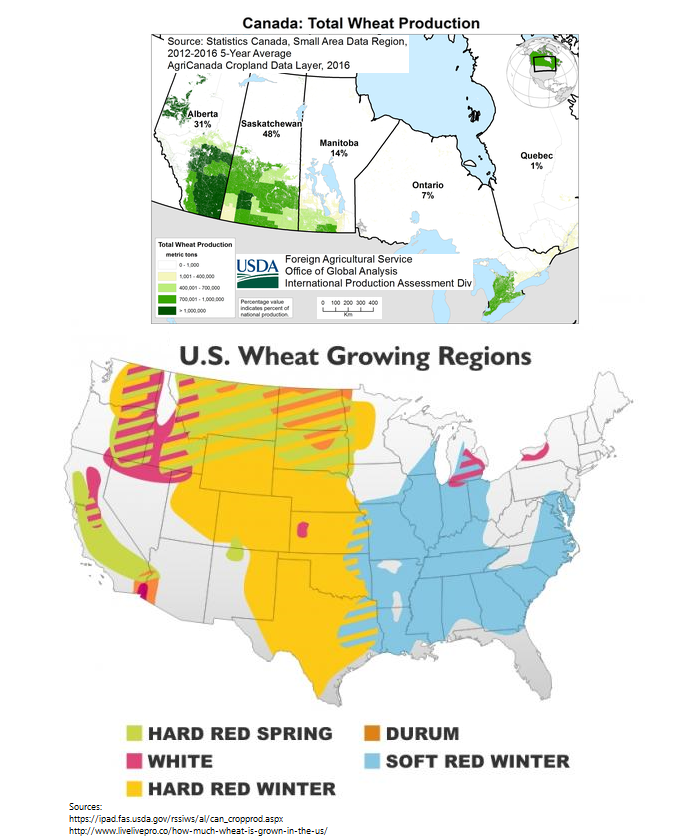
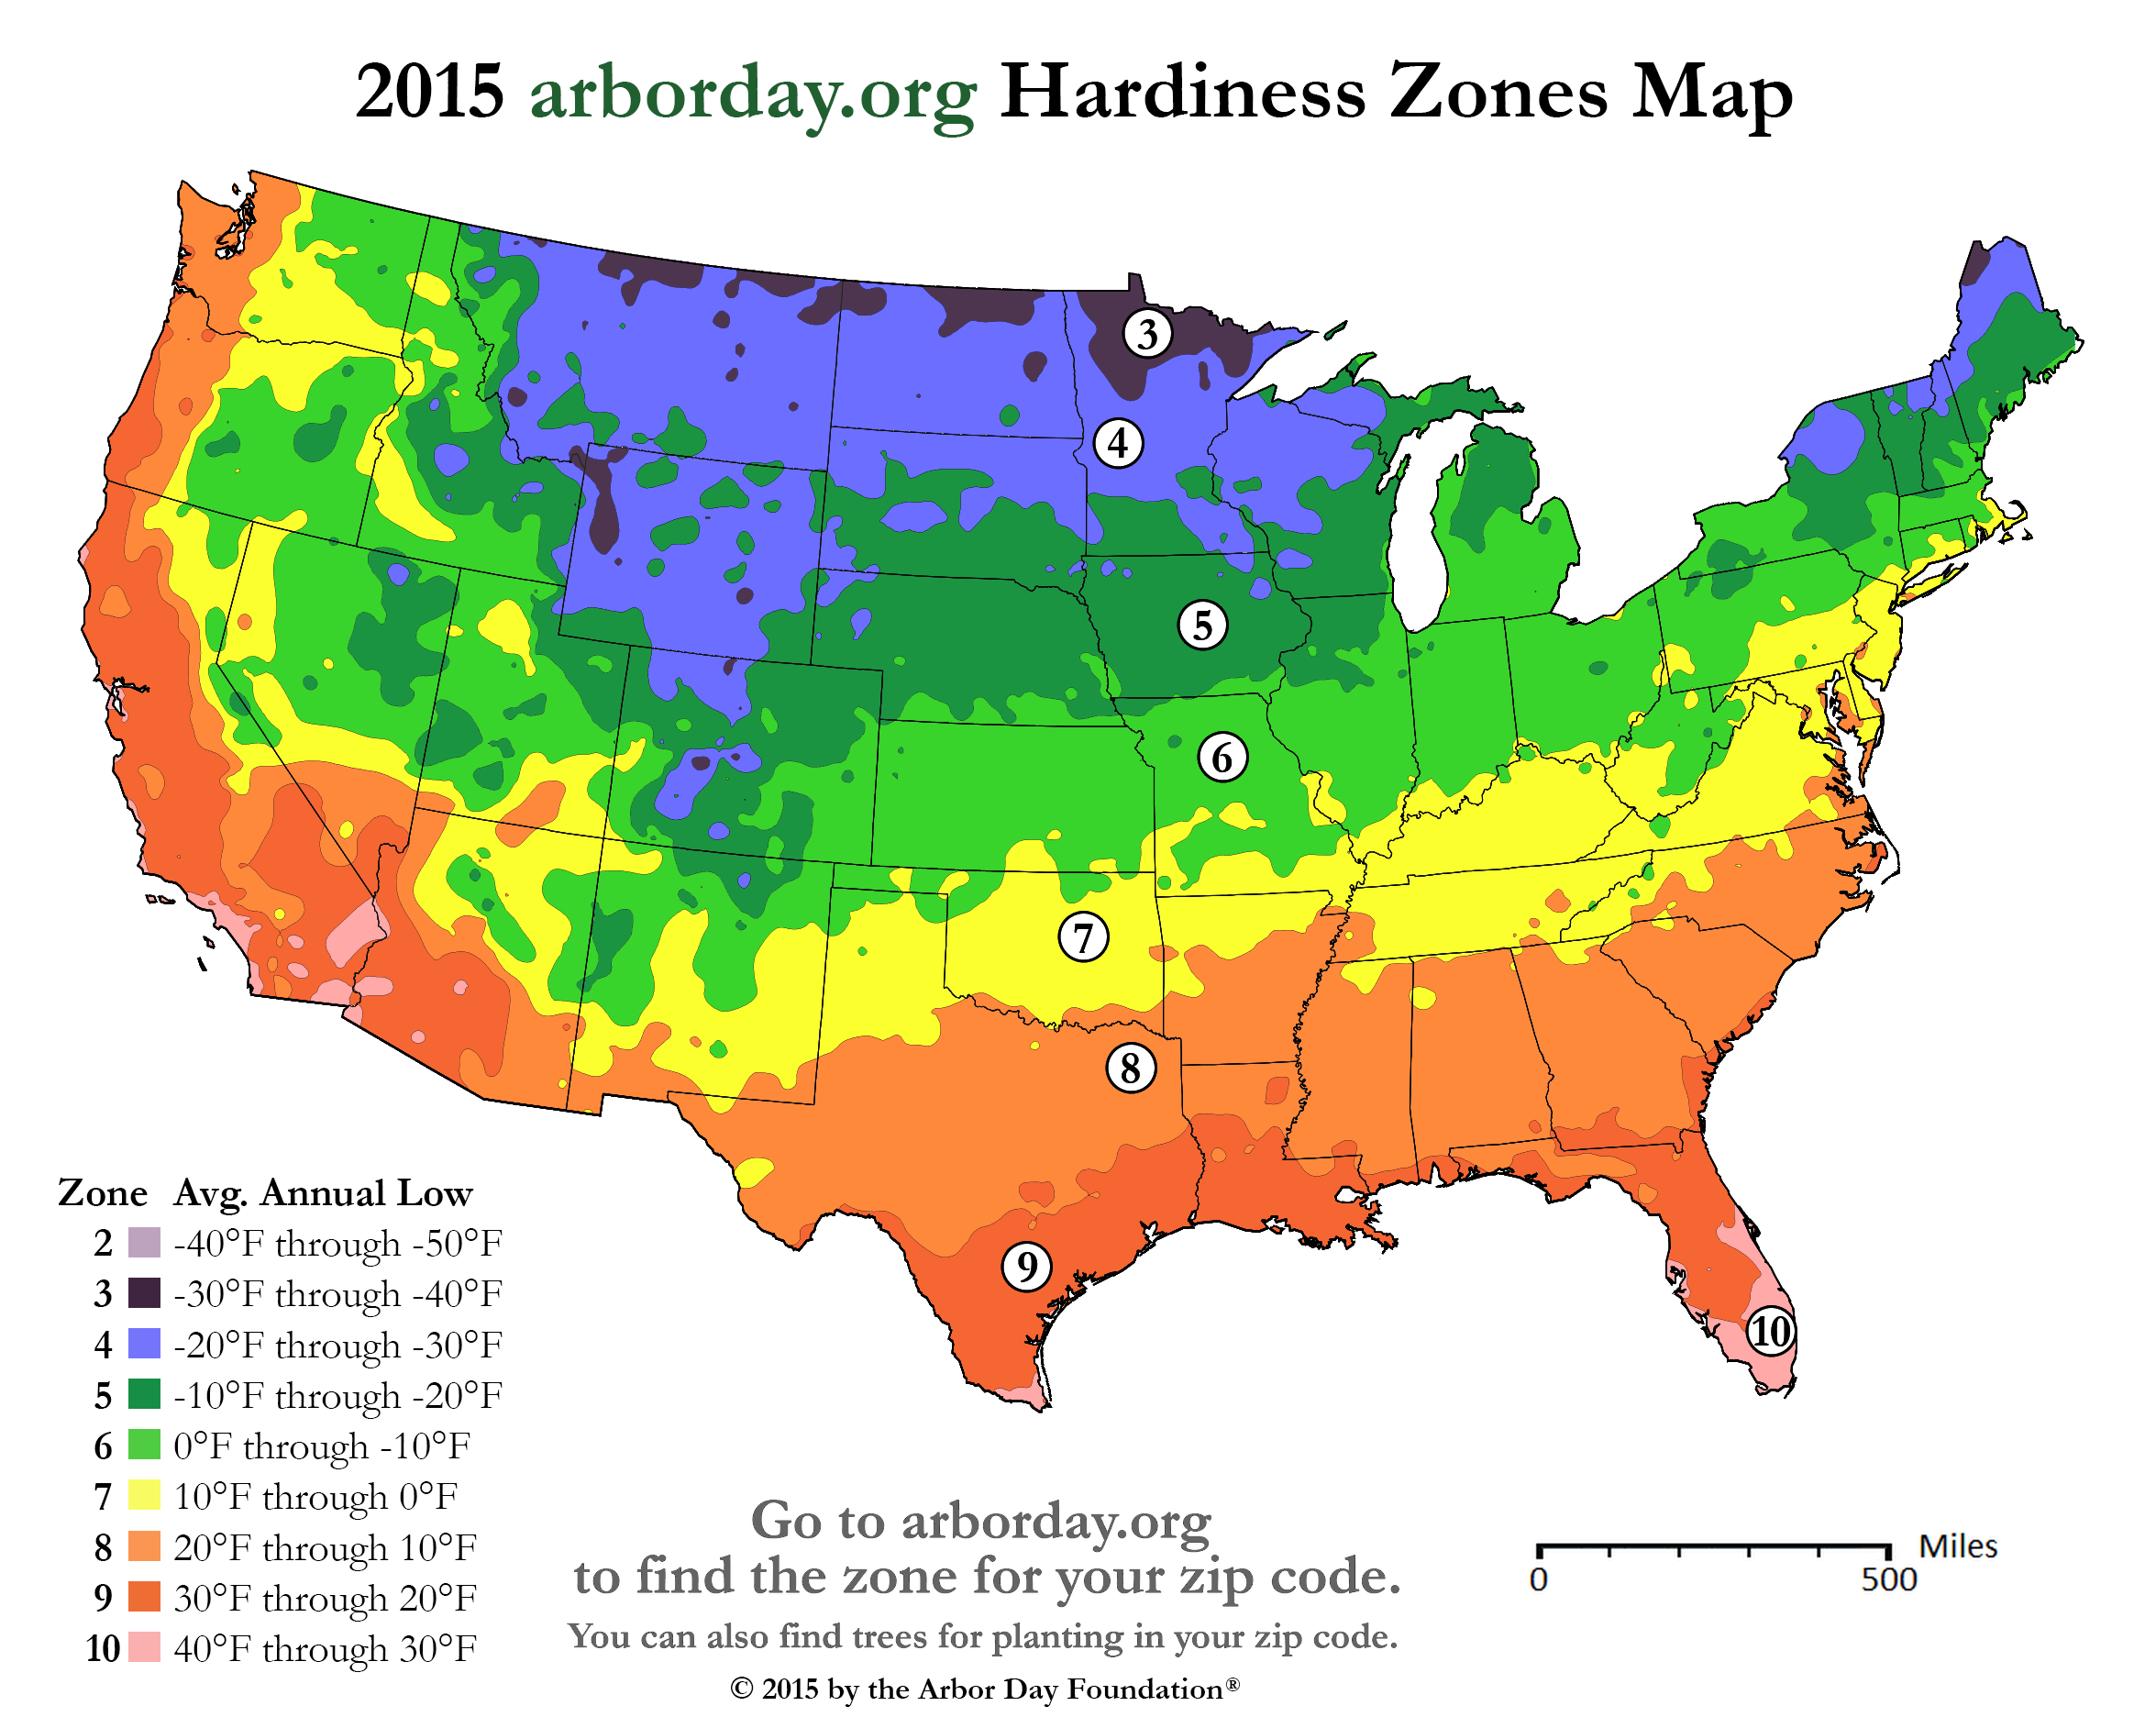
Growing zones:
ALL C3 crops, and the most important C4 crops, all show strong improvement in yields from increases in CO2.
Plus, both C3 and C4 show improvements in water efficiency, as measured by reductions in leaf stomatal conductance and canopy evapotranspiration, from increases in CO2.
What’s more, for most crops, adjusting for the tiny temperature differences anticipated is trivial. E.g., where I live, 2°F of warming could be fully compensated for by planting one week earlier in springtime.
The studies which find negative effects from warming temperatures do so by failing to make such adjustments (i.e., by assuming that farmers are as idiotic as some climate scientists).
So true. Read a book by a “progressive” or a “futurist” and see humans portrayed as non-sentient entities which cannot adapt to changing conditions. They love to take two points on a graph and extend the line to infinity.
Now, they do the same thing with computer models.
@ Dave Burton comment of:
“ (i.e., by assuming that farmers are as idiotic as some climate scientists).”
It was in mid-May of one year when a “climate scientist” farmer approached his neighboring older farmer and asked if he could borrow the old farmer’s “corn picker” on September the 10th.
The old farmer said he guessed so, ……. but asked why did he want to borrow it on September the 10th?
The “climate scientist” told the old farmer that he had just planted 10 acres of “86 day corn” ….. and September the 10th.is the day it will be ready to pick. 😊
Growing zones:

Funny — Wash DC generates so much hot air that it has its own isolated warmer zone.
To put the Dust Bowl in perspective read “Living a Lifetime of Climate Change” at http://rangefire.us/.
Forget a dust bowl. No one’s leaving home or going outside. I don’t even know if farmers are allowed to buy seeds–the seeds might have coronaviruses. We will starve ourselves, like the obedient little fools we are. Climate is now irrelevant.
one of the sellout things in Aus are all the seedling veg plants and seeds
some people got a bit smarter
capsicums here went from 6.99 to 10.99 a kilo from one delivery to the next
oranges locally are 7.99 a kilo thats about 4 or 5 fruit
all the while or farmer fed speaker is saying plenty of veg etc not to worry
might be plenty but its going to city and being very profitably gouged.
and this is just 2 weeks into stupid mode for the unprepped masses.
Farmers already practice social distancing – by being farmers!
Talked to my farm tenant yesterday. Got fertilizer down on the wheat before the rains came.
He said everybody is working hard (as usual). Farming is tied to the calendar and the weather. You do what you can between those two controlling variables.
He said the only difference this year is the kids are home from school!
Farmers already practice social distancing
Except during the Saturday-nite square-dance. 😉
…the increased frequency of extreme weather events.
Huh?…
Warmists always get the wrong end of the stick. 😎😎
I would give more credence to these studies if they also looked at the effect of switching from bio-fuel back to food crops. I suspect that would more than compensate for any drop in production.
Higher than current atmospheric concentrations of carbon dioxide lead to greater growth and more efficient water usage in plants. This is the opposite of the dustbowl theory and more like a fruitbowl.
Alarmists, on the whole, are wilfully ignorant of agricultural and horticultural production.
To get a perspective on the Dust Bowl read “Living A Lifetime Of Climate Change” at http://rangefire.us/.
I much prefer the book “Sod and Stubble,” by someone who was literally “on the ground” as it were.
Midwest farmers were not only destroyed by the Dust Bowl – domestic supply outstripped domestic demand for years before, and continued to do so even in the depths of the Dust Bowl. Prices were depressed, profit margins were extremely thin before the weather changes – and with the reduction in production volume, the small farmer just could not make it work. (This was also the start of the trend to the corporate megafarms of today.)
First things first. We have to survive this plague before we can starve.
The coronavirus plague will be a “cakewalk” compared to the plague of hungry intercity residents advancing onto the suburbs and rural homeowners to carry away everything that’s not nailed down.
“Capitalism is where bread waits at the store for you to show up and buy it. Socialism is where you wait at the store for the bread to show up so you can buy it.”
The Governor of California ordered everyone to stay home, ……..thus no one will be baking bread or delivering it to the stores …… so don’t worry about it.
There is a book called “The Worst Hard Time” by Timothy Egan about the dust bowl. VERY informative.
Right now it is free on Amazon if you are a prime member. What a steal.
The dust bowl was a direct result of US policy in WW I. Russia before the war was a major exporter of wheat to Western Europe. When war broke out, Western Europe faced starvation. Most people don’t know that Western Europe cannot feed itself, then or now. (The German decision to invade Russia in WW II was in part based on this reality. Western Europe could no longer import food by sea because of the British blockade.) Wilson decided that America would take up the slack, and offered guaranteed prices for wheat. This lead to a boom in production, with speculators buying up land, plowing the sod under, and growing wheat. They made a lot of money. Then, the war ended, the heat and drought came, and the price guarantees ended. The speculators left the land, which was abandoned to the elements. No ground cover planted. Washington D.C didn’t really get excited until dust storms from the Great Plains reached D.C. and dimmed the sun.
Also note that Russia, while under the Bolsheviks, had about 60 years of bad weather, and never was a major exporter of wheat during their rule. Talk about climate change impacting food production.
If anyone wants to see an example of NOAA data inconsistent with their rhetoric go to the NOAA site below. Set the period for 1900 to the present, select July and set for “Maximum Temperature Anomalies”. You will see the high temperatures were higher in the 1930’s than recently.
Then set for “Minimum Temperature Anomalies” and the lows are much lower in the 1930’s than present. This is a very clear representation on how urbanization effects night time lows, thus artificially creating higher average temperatures.
In the early 1930’s, CO2 concentrations had increased by ~30ppm over pre-industrial levels. Today they are ~135ppm higher. Why then did we have higher high temperatures if it’s all bout CO2?
It is this distorted average temperature record that is used as a basis for computer models. Is it any wonder they are so far off from empirical satellite measurements.
https://www.ncdc.noaa.gov/temp-and-precip/national-temperature-index/time-series?datasets%5B%5D=uscrn&datasets%5B%5D=climdiv&datasets%5B%5D=cmbushcn¶meter=anom-tmin&time_scale=3mo&begyear=1900&endyear=2020&month=7
“In the early 1930’s, CO2 concentrations had increased by ~30ppm over pre-industrial levels. Today they are ~135ppm higher. Why then did we have higher high temperatures if it’s all bout CO2?”
Good question. The answer is it is not all about CO2. It was just as warm in the 1930’s as it is today, yet the CO2 content of the atmosphere has increased. So we have a CO2 increase, but no temperature increase since the 1930’s.
CO2 seems to be tagging along for the ride, instead of being behind the wheel.
Btw, those “temperatures” in that link you provide are bastardized versions of the real temperatures.
If you want the real temperatures, you have to look at a Tmax chart that has not been modified. If it says “anomaly”, it’s been modified. What you want is the so-called “raw” data. The “raw” data is the actual temperature reading. I suppose the computer data manipulators call it “raw” to give the impression that somehow the “raw” data needs to be improved by their computers.
The Data Manipulators “improvements” lead to the bogus, bastadized, fraudulent Modern-era Hockey Stick global surface temperature chart, which leads to all the insanity that makes up modern, alarmist climate science.
Without this fake Hockey Stick temperature profile, the promoters of CAGW (Catastrophic Anthropogenic Global Warming) would have nothing to point to as “evidence”. It’s all they have, and it’s all a Big Lie.
All the unmodified Tmax charts from around the world show the same temperature profile,i.e., that it was just as warm in the Early Twentieth Century as it is today.
None of the unmodified Tmax charts from around the world resemble the bogus, fraudulent Hockey Stick chart. The fraudulent Hockey Stick chart is the only thing purporting to show a correlation between CO2 and temperature increases. Throw away the Hockey Stick and there is no CAGW crisis.
Fully aware that I was using their “bastardized” data, but the fact that the average high temperatures in the 1930’s are higher than any in the last decade, even using the homogenized data, just reinforces how obvious the UHI effect is distorting temperature records.
Last time I heard, they had gone through 13 homogenizing exercises. A few more iterations and we can wipe the Dust Bowl from our historical records.
What’s even worse than their data manipulation is that much of NASA/NOAA dialog is opinion and presumptive claims that they don’t link to data. Debate someone with data and they will quote NASA/NOAA rhetoric and question how you would ever consider challenging the men that got us to the moon.
I just wish that Congress or this Administration would require more rigorous quality standards to these agencies analytical practices and prevent them from presenting science and information from other sources that did not work to these rigorous standards (e.g. the secret science of Mr. Mann, the “97% of scientist” quotes, or much of the IPCC’s assessments).
Michael Mann has regularly informed us that temperatures today are higher than in the 1930’s. Why are we not seeing a Dust Bowl at the moment?
Because Michael Mann is not telling us the facts.
I live in part of the former Dust Bowl and our weather couldn’t be nicer. If this is CAGW, give me more of it!
There is no comparison between now and the Dust Bowl of the 1930’s. Not even close. In fact, there is no comparison between the severe weather we had in the 1950’s and today’s weather.
Today’s weather is a blessing for this area. If anything we are getting too much moisture over the last couple of years, but living in Oklahoma, it is hard to say we are ever getting too much mositure. 🙂 We are usually drought-prone.
no till /ground till are a lot different then older plow type farming.
no ground cover left created the dust bowl.
farmers today don’t dig a hole and drop a seed but practice efficient water/irrigation usage as well as sustainable ground prep.
they do this to allow continuing use of the resources.
Roundup-Ready GMO crops help. They enable weed control without tilling.
Of course, the same people who pretend to be environmentally sensitive do their best to bring back the dust bowl, by refusing to eat GMO food, just like they do their best to “brown” the Earth by restricting CO2 emissions.
From “1930s Dust Bowl: Government Policy + Climate + Farming Methods:”
“Lofty ideals ran aground upon the climatic realities of the arid region west of the 100th meridian where precipitation was too little and too inconsistent to support traditional farming, especially on plots as small as 160 acres. Although this had been understood at least since 1878, larger homesteads—John Wesley Powell proposed homesteading units of 2,560 acres (4 square miles)—were less politically beneficial because fewer people would have settled in the region to be represented in Congress; large homesteads were counter to the free land reformist view that small farms would serve as an antidote to land control by large interests.
“Ultimately, 160 acres proved simply too small to be a viable farm in this more arid (or semiarid) region, especially considering that the Homestead Act did not help poor people raise the capital necessary to survive, let alone succeed. ”
https://agfax.com/2019/10/25/1930s-dust-bowl-combination-of-gov-policy-climate-farming-methods/
Had the weather and climatic conditions not been very hot and dry for a decade, would there have been a dust bowl? Timothy Egan’s book makes many very good points but to concluded that the dust bowl was a direct result of government policies is a stretch. Yes, government policies made things drastically much worse. If sound government polices are not made there will undoubtedly be catastrophic consequences, likely much greater than anything we have ever experienced, regardless of the weather conditions.
Over here in the United States, we tend to associate droughts with warm periods, but that’s a local prejudice.
1. In part, we tend to think that because of the local seasonal correlation: in much of the USA, droughts occur mostly during summertime. However, in much of the rest of the world, including India, Bangladesh, and the Sahel, summertime is monsoon season, and it’s winters which are dry.
2. We also tend to associate droughts with warm periods because on the American Great Plains the 1930s warm period coincided with the Dust Bowl (drought). However, in general, globally, droughts are not positively correlated with warm periods. In fact, during the Roman Warm Period two millennia ago, arid North Africa was the breadbasket of the Roman Empire.
The one indisputable drought-related impact of manmade climate change is very positive: higher CO2 levels help mitigate damage to plants by droughts.
Overall, the increase in atmospheric CO2 level from just under 0.03% (at the beginning of the 20th century) to just over 0.04% (now) has increased crop yields by an average of about 20%, by “CO2 fertilization.” That’s one of the factors which have helped eliminate major famines. But higher CO2 levels are even more beneficial when crops are under drought stress, because elevated CO2 makes plants more water-efficient and drought-resilient, by improving stomatal conductance relative to transpiration. That’s especially important for preventing famine, because droughts used to be a major cause of catastrophic famines. In fact, the global drought & famine of 1876-78 killed about 3.7% of world population; for comparison, WWII killed about 2.7% of world population, and the 1918 flu pandemic killed about 2% of world population.
Refs: Donohue, et al, 2014, Chun, et al, 2010, Fitzgerald, et al, 2016, https://sealevel.info/learnmore.html#droughts and many others.
Pictures: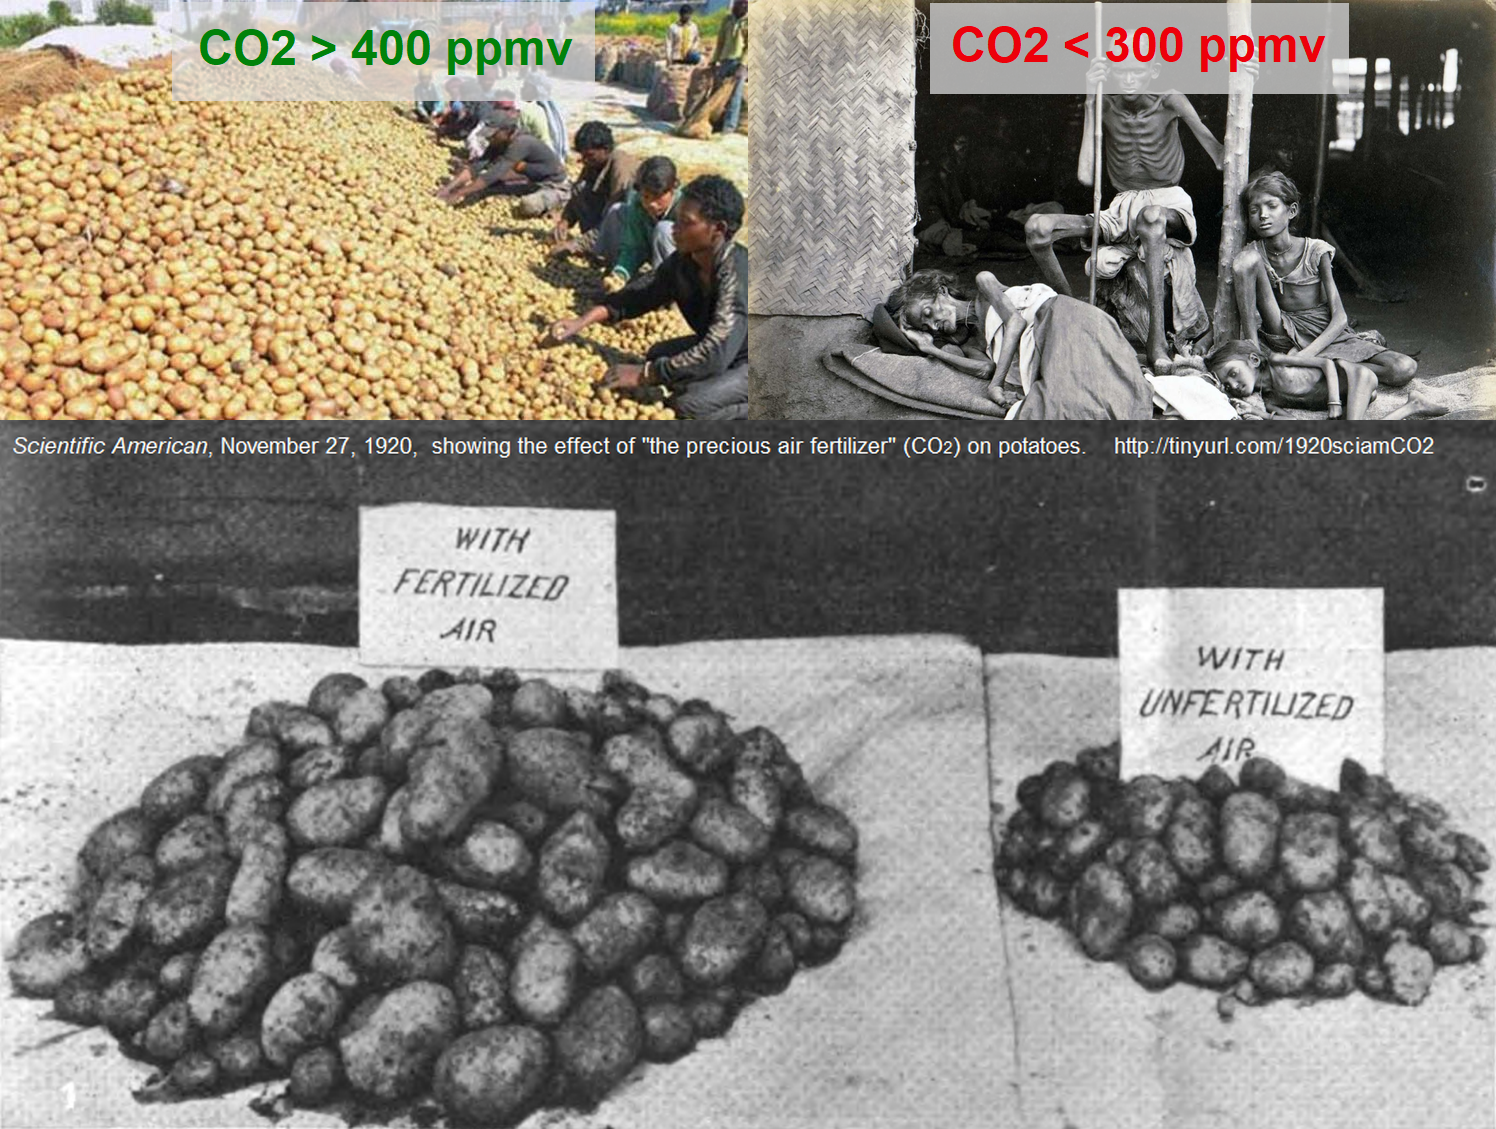
As CO2 levels have risen, global drought incidence and severity have not increased. If anything, they’ve decreased very slightly.
Graphs: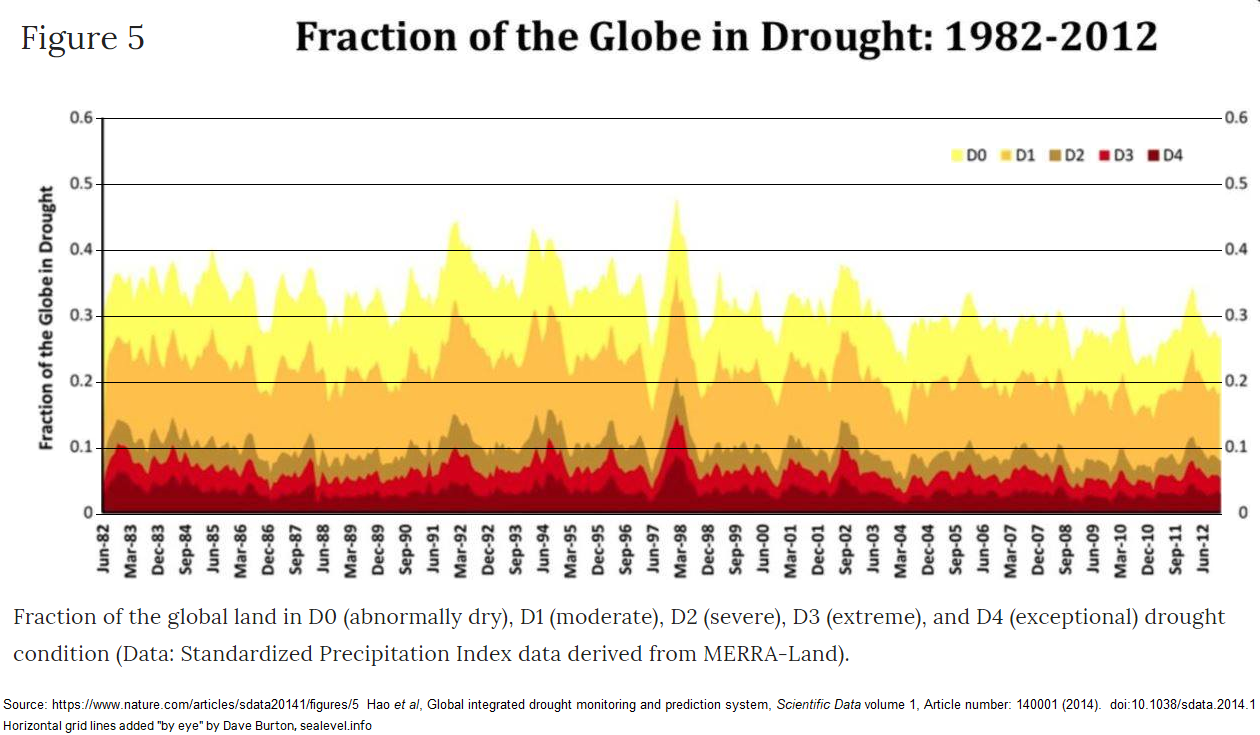 and
and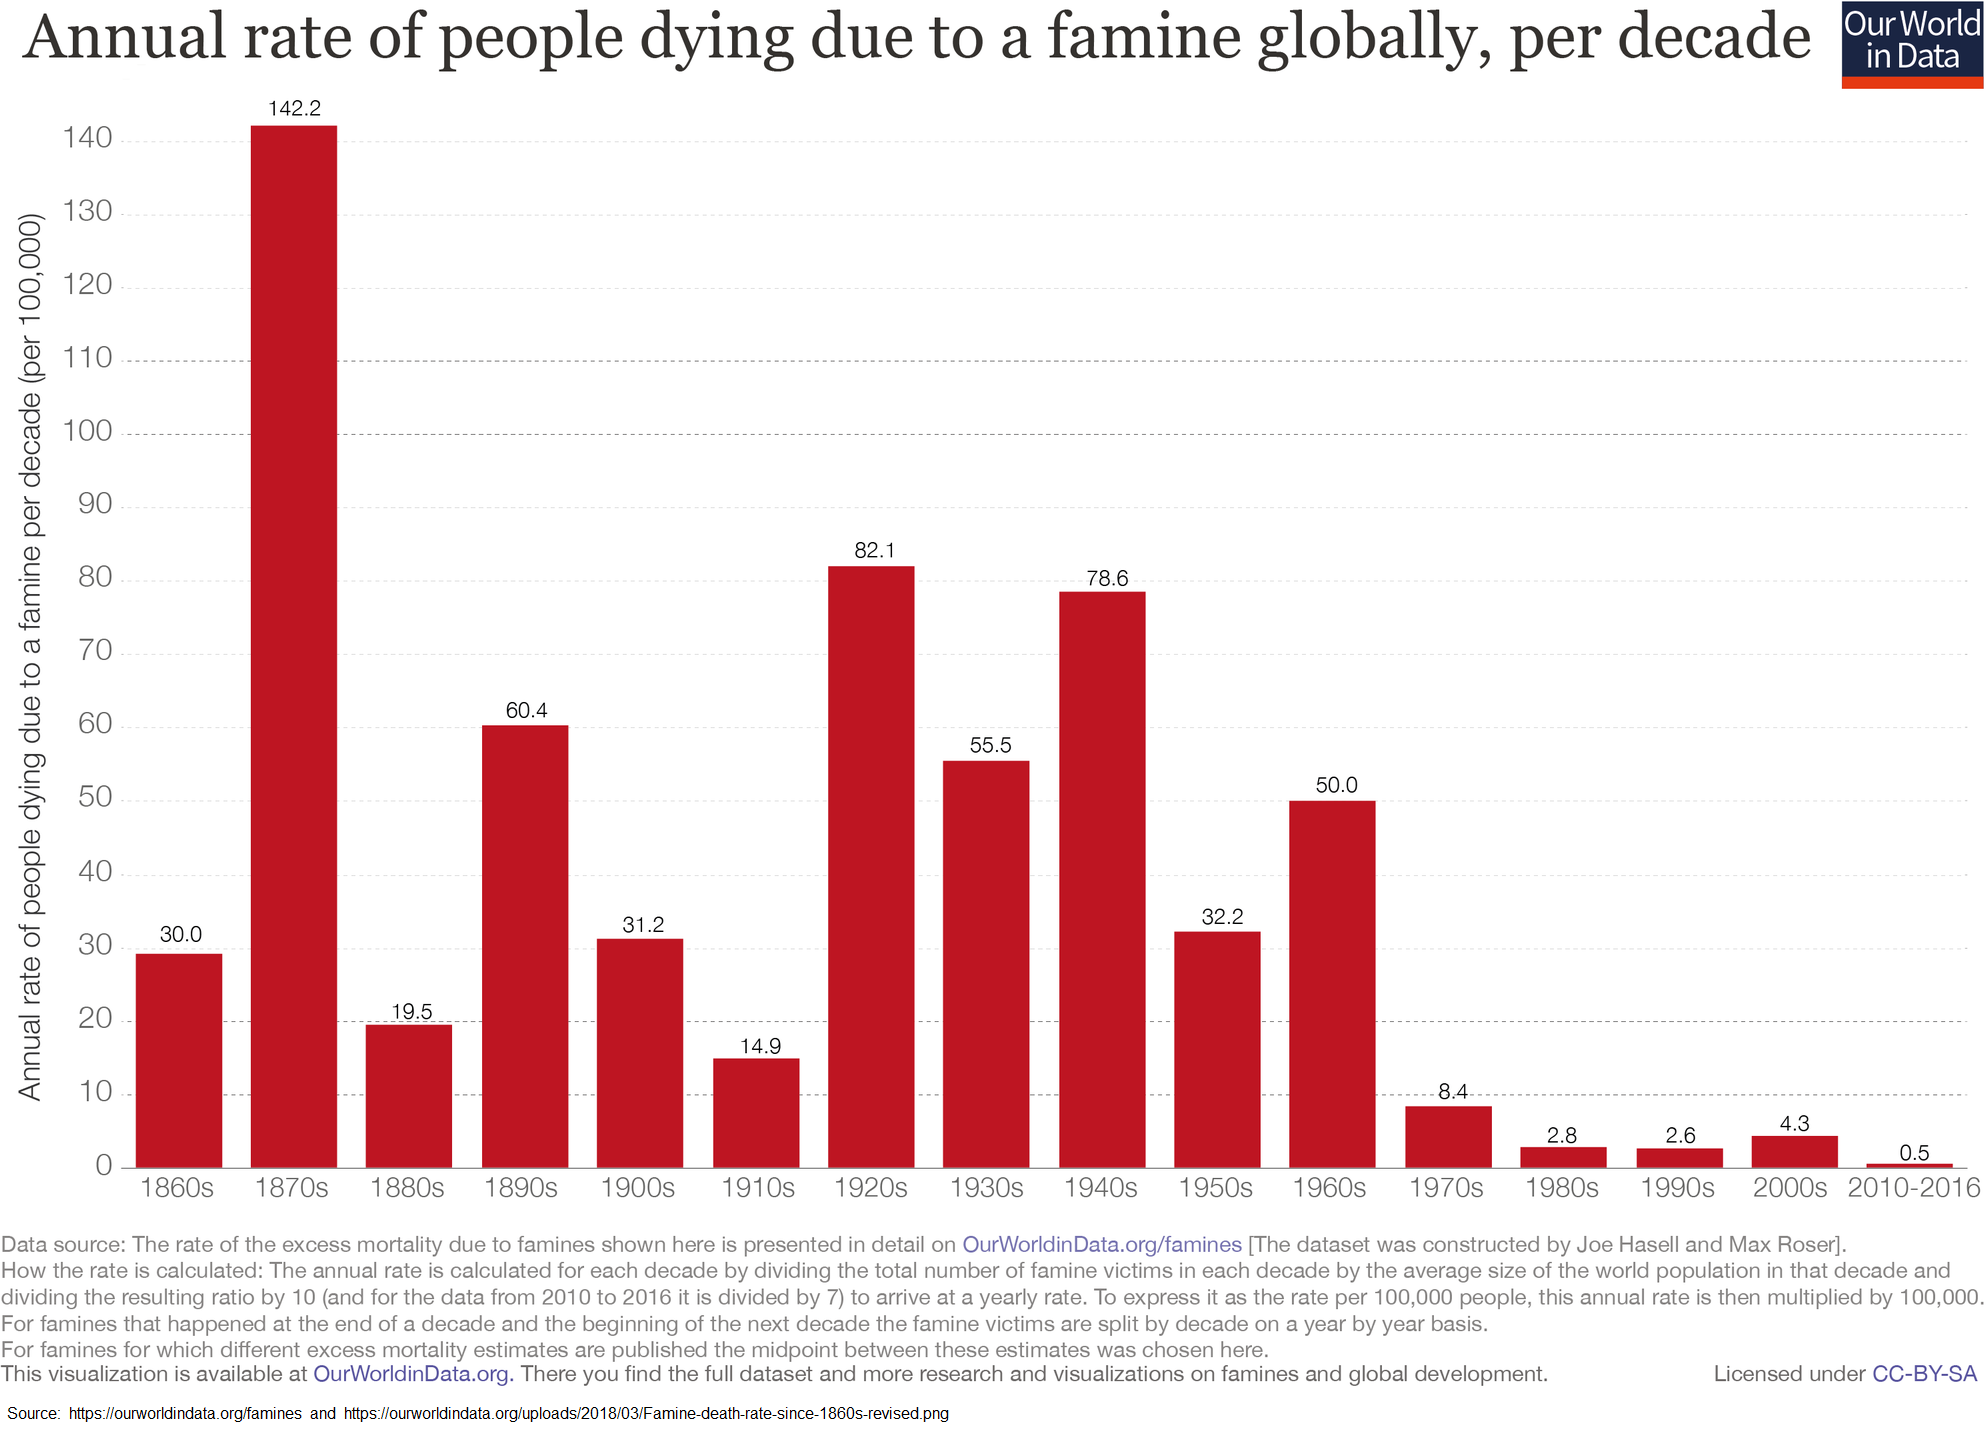
NASA Video: https://www.youtube.com/watch?v=zOwHT8yS1XI
Thanks for sharing this impressive information. I find it difficult to understand why would we want try and manage the climate when there is no empirical evidence of the possibility. However, we do have technology and capability to manage many other things necessary for human survival. Changing human behavior may be one the greatest opportunities. Just in America alone we waste enough food to feed another population of our size.
EurekA! The evolution of a novel social contagion, which can be mitigated through social distancing.
This is when I stopped reading. There is NO trend indicated in the data that supports this statement, AIUI, laying a trend line on the data produces a line that appears to slope downward, not upward, but that slope is not statistically significant. And not only are we not seeing such a trend in the current data, there is no proof or support for such a trend in the future, even if the world warms that 1.5-2.0°C the article’s author carelessly threw out there! Which brings up another issue, the IPCC only predicts a 1.5-2.0°C rise from preindustrial levels hinting that the baseline is a level not seen since 1850, and the world has already warmed 1.0°C from there, further warming should be only 0.5°C from there. But I digress. So while the headline statement may be correct, given the egregious errors in their background assumptions, I have no faith in the results of their “study”. Which likely relies entirely upon computer models again (did anybody make it that far?), continuing the horrendous trend in science of taking the output of a dodgy computer model and using that as input “data” for another dodgy computer model. That ain’t science.
Agricultural practices since the 1930s have advanced more than in the previous 10,000 years. This article starts with a false conclusion and spirals in from there:
> But due to climate change, massive crop failures are more likely to happen again in the future.
Absolutely flies in the face of crop yield data.

Another 1.5 degrees in three decades? When it took 150 years to go 1.5 degrees?
Sure. Ok.