
Guest post by Michael Kile,
Have you ever wondered how to play the Climate Game, or game the climate? If so, look no further than a remote research station on the northern tip of the Antarctic Peninsula, a submarine-shaped office tower on Geneva’s Avenue de la Paix and an international media pack determined to ramp a single yet-to-be-confirmed measurement into another bogus international climate scare.
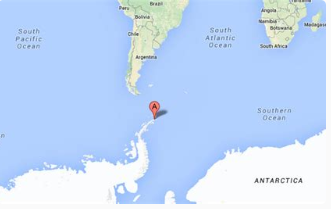
The research station is the Argentine base, Esperanza, coordinates: 63°23′51″S 56°59′52″W. It claimed to have set a new record temperature of 18.3°C on 6 February this year, beating the previous record of 17.5°C on 24 March 2015, according to a tweet (below) from Servicio Meteorológico Nacional (SMN), Argentina’s national meteorological service.

It was déjà vu all over again for the alarmist MSM.
BBC: “Scientists warn that global warming is causing so much melting at the South Pole, it will eventually disintegrate – causing the global sea level to rise by at least three metres (10ft) over centuries.” Antarctica logs highest temperature on record of 18.3C, February 7, 2020)
NY Times: “Antarctica, the coldest, windiest and driest continent on Earth, set a record high temperature on Thursday, underscoring global warming”. It went on to claim: “the high temperature is in keeping with the earth’s overall warming trend, which is in large part caused by emissions of greenhouse gases”.
The Guardian was on the same page. Antarctica, it said, was “one of the fastest warming places on earth, heating by almost 3°C [5.4°F] over the past 50 years” despite recent research suggesting a cooling trend since the year 2000, contradicting the carbon dioxide-driven global warming scare. (Media’s horribly dishonest Antarctica warming propaganda, WUWT, February 9, 2020)
Five years earlier, on April 1, 2015, it reported on the previous record under the headline: “Antarctica records unprecedented high temperatures – two temperature readings register ominous new potential measurements of accelerating climate change.” “What was incontestable,” the paper’s journalist concluded, “were the unprecedentedly high temperature readings on the Antarctic ice mass.”
Yet mean monthly temperatures at Esperanza range from −10.5 °C (13.1 °F) in July, the coldest month, to 1.4 °C (34.5 °F) in January, the warmest month. During summer (December–February), the average high is between 3.7 and 4.3 °C (38.7 and 39.7 °F) while the average low is between −2.0 and −1.2 °C (28.4 and 29.8 °F). In winter, mean temperatures are around −6.0 °C (21.2 °F). So what is going on here?
The Examiner’s Thomas Richard ridiculed the Pavlovian alarmism:
To put this in perspective, it would be the equivalent of taking a temperature measurement in Reykjavík, Iceland, and proclaiming that this measurement is indicative of the temperature of the Arctic region, or worse, Tasiilaq (Ammassalik), Greenland. It’s a ridiculous statement and utterly useless. It is well known that West Antarctica is heavily influenced by underground volcanic activity, and hidden beneath its icy exterior is a myriad of active rift systems. Did Antarctica really have its warmest day on record? (March 31, 2015)
The glass, steel and aluminium tower adjacent Geneva’s Jardin Botaniques is the global headquarters of the World Meteorological Organisation. According to a local travel agency, Geneva Live Tourism, the building is “respectful of the environment,” and its “grandiose allure with the double façade seeming to dominate the surrounding space”. Reference
WMO is the beating heart of Big Climate. It is the UN’s “expert agency and voice regarding the state and behaviour of the Earth’s atmosphere, its interaction with the oceans, its climate and the resulting distribution of water resources.”
WMO issued a media release on the Esperanza result on February 7. It was a qualified announcement – New record for Antarctic continent reported – for the “likely legitimate record” was subject to formal verification.
A committee for WMO’s World Weather and Climate Extremes Archive (WWCEA) will now verify whether this indeed is a new record for the Antarctic continent, which is defined as the main continental landmass.
Dr Randall Cerveny, a professor of geographical sciences at Arizona State University, has been the WWCEA Rapporteur – or gatekeeper – since its formation 14 years ago. “Everything we have seen thus far indicates a likely legitimate record but we will of course begin a formal evaluation of the record once we have full data from SMN and on the meteorological conditions surrounding the event.”
Crucially, he also made this comment: “the record appears to be likely associated (in the short term) with what we call a regional “foehn” event over the area: a rapid warming of air coming down a slope/mountain.”
What is a foehn event? According to WUWT blogger, Jim Steele,
foehn events cause rapid extreme temperature jumps simply due to changes in the air pressure as winds descend from a mountain top. During the 2015 foehn event, Esperanza’s daily temperature jumped from 0°C [32°F] 2 days before, to a record setting 17.5°C [63.5°F]. Elsewhere, Antarctic foehn winds are common and have been extensively studied, often raising maximum temperatures by 10+°C [18+°F] above normal. WUWT post, February 9, 2020
In other words, it was just local weather, not a consequence of so-called dangerous anthropogenic global warming, aka “climate change”.
“Verification was important”, Cerveny said. “It helps to build up a picture of the weather and climate in one of Earth’s final frontiers.”
The WMO media release noted that: “the Antarctic, like the Arctic, is poorly covered in terms of weather observations and forecasts, even though both play an important role in driving climate and ocean patterns and in sea level rise.”
Despite a lack of data, WMO could not resist the opportunity to trumpet a warming warning. Included in the release were ominous comments on the Pine Island and Thwaites glaciers. The latter, allegedly, is “one of the largest contributors to global sea level rise from the West Antarctic Ice Sheet”. There was no mention of its precise “contribution”.
That, dear reader, is another story, one about why the BBC failed to mention the many active volcanoes underneath this region, yet found space to jest about “snotsicles”. Spending £38 million of US/UK government funding to “prove” we are in a “climate emergency” has never been such fun.
Scientists fear the Thwaites Glacier could be beginning a process of catastrophic collapse. There is more than three metres of potential sea level rise in the ice of West Antarctica, enough to swamp many of the great cities of the world and drive hundreds of millions of people from their homes. Snotsicles and snowdrifts: extreme climate science, BBC, January 29, 2020
In any case, speculating about the threat of global sea-level rise, despite the region’s prevailing temperature profiles, is surely a fool’s game.
The Antarctic Peninsula (the northwest tip near to South America) is among the fastest warming regions of the planet, almost 3°C over the last 50 years. The amount of ice lost annually from the Antarctic ice sheet increased at least six-fold between 1979 and 2017. Most of the ice loss takes place by melting of the ice shelves from below, due to incursions of relatively warm ocean water, especially in west Antarctica and to a lesser extent along the peninsula and in east Antarctica.
We will need more than the IPCC’s brave 2C warming guesstimate to melt the massive southern polar ice block.
Spanning 14 million km2 (roughly twice the size of Australia), the Antarctic’s average annual temperature ranges from about −10°C on the Antarctic coast to −60°C at the highest parts of the interior. Its immense ice sheet is up to 4.8km thick and contains 90% of the world’s fresh water, enough to raise sea level by around 60 metres were it all to melt.
There is another important issue here too: geographical semantics. The WMO release conflates the Antarctic Peninsula with the continental Antarctic ice sheet.
Little surprise, then, most of the MSM missed the fact that the Antarctic Peninsula is not the Antarctic continent or “region”. The former refers to the narrow northwest tip nearest to South America. As for the latter, the WMO – controversially – defines it as “everywhere south of 60 degrees latitude”. (See Antarctica map)
WMO also defines the Antarctic continent as “the main continental landmass”. In 2017, however, when it announced a new highest Antarctic high temperature it stated that: “new verified Record Extremes now exist for the Antarctic Region’s highest temperature (corresponding to all lands/ice south of 60deg;S), the Antarctic Region’s highest temperature (continent, including the mainland and adjoining islands), and the Antarctic Region’s highest temperature (plateau > 2500 meters).”
Yet the Esperanza Base is actually outside the Antarctic Circle, which currently runs 66°33′48.0″ south of the Equator. It is misleading – some might say mischievous – to imply that “record” temperature measurements on the Antarctic Peninsula – less than 5 per cent of the continent especially those taken on islands at its northern extremity, are meaningful for Antarctica itself, as the WMO does here by including this sentence in its February 7 media release: “the record for the Antarctic region – that is, everywhere south of 60 degrees latitude – is 19.8C, taken on Signy Island in January 1982.”
The British Antarctic Survey (BAS) Signy Research Station at Factory Cove, Borge Bay, Signy Island, is also outside the Antarctic Circle. Located at Lat. 60°43’0″S, Long. 45°36’0″W in the South Orkney Islands group, it is 1300 km from the Falkland Islands, 900 km from South Georgia, 600 km from the Antarctic Peninsula, and 3250 km from the South Pole.
According to the BAS website (here), meteorological records at this summer-only site “were kept by professional meteorologists from 1947 to 1969 and by station volunteers from 1969 to 1995.” How much confidence can we have, then, in the 19.8C reading of January 30, 1982 – a record maximum for any station south of 60°S – especially when the month is prone to significant variation, including “sudden falls in temperature”, down to -7°C?
Whatever the case, a recent detailed analysis of meteorological conditions prevailing at the time – prompted by Dr Cerveny and the WMO Committee on Antarctic Temperature Extremes – confirms that it too was due to foehn (or fohn) warming:
At the time of the record temperature exceptionally warm air was being advected southwards towards the South Orkney Islands from the subtropical South Atlantic…. Since conditions conducive to föhn occur relatively frequently, föhn warming may have a significant influence on the local climate and ecology of Signy Island. (Atmospheric Science Letters, November 29, 2017)
As mentioned earlier, WMO’s WWCEA committee rightly is not prepared to declare a new record for Esperanza without further investigation, at this stage referring only to a potential new Antarctic (continent) high temperature:
The Argentine research base, Esperanza, on the northern tip of the Antarctic Peninsula, set a new record temperature of 18.3°C on 6 February 2020, potentially beating the former record of 17.5°C on 24 March 2015. (WMO official Press Release.
WWCEAC would “now verify whether this indeed is a new record for the Antarctic continent, which is defined as the main continental landmass.” It has not done so yet, so we await the Rapporteur’s “decision and relevant documentation” to be posted on this site (here).
Dr. Cerveny, incidentally, proposed creating WMO’s global archive for verifying, certifying and storing world weather extremes in 2006. As Rapporteur he has called an “ad hoc extremes committee” to “provide an expert and unbiased recommendation” on whether the new extreme qualifies for the archive.
This process is easier said than done, for if “the truth be told, world record extremes are mistakenly created all the time.” Will Esperanza turn out to be one of them? If so, don’t expect this MSM headline: “Fat finger pricks climate bubble”.
For example a “fat finger” error such as hand digitizing a 28.0°C as 82.0 would create a world record observation that every quality control system would say was invalid. Additionally, instrumentation problems can generate a report far in excess of the meteorological conditions. But sometimes a combination of fairly extreme meteorological conditions with minor instrumentation problems, such as calibration errors, can necessitate considerable detective work to determine whether a new world record observation was indeed valid or not. Since weather records are often used as indicators that the Earth’s climate is changing and/or becoming more extreme, confirmation of new weather extreme records should be recognized as a high priority in the meteorology community. Reference
An alert blogger, Nicholas McGinley, made the following post at WUWT on February 9, 2020 at 7:07 pm :
I am having a hard time verifying this report from Esperanza station.
The thermometer data from the last five days did not show anything close to what is being reported, when I looked earlier this evening.
But now I checked again, and the numbers have changed completely.
Here is a Tweet I posted with the two graphs side by side:
https://twitter.com/NickMcGinley1/status/1226703191695351808?s=20
It has become nearly impossible to trust anything these days.
Besides for all of that…when a short term blip is announced as if it is a representation of the entire state of the planet, while in Alaska a two month trend of temps is showing the coldest period ever recorded in that entire state, something is not at all right.
Dr Cerveny and WMO’s WWCEA committee presumably will sort it all out soon. Watch this space.
After all, it did so when a Czech Republic automatic weather station on Davies Dome in the northern part of Ulu Peninsula, James Ross Island, recorded a temperature of 17.9°C (64.2°F) on 23 March 2015, “a day before the current WMO accepted record of 17.5°C (63.5°F) was observed at Esperanza Base (Argentina) in the same general location in the Antarctic Region”.
The committee adjusted the Davies Dome observation down to 17.0°C ± 0.2°C (62.6°F ± 0.4°F) and declared it to be “the « second highest » temperature recorded in the Antarctic Region (continent only).”
The recommendation follows a detailed discussion by the committee of the probability that the station experienced solar radiation bias on the temperature-recording instrument at the time of the record observation. In simple terms, the committee suggested that the temperature sensor at Davies Dome was heated to around 0.9°C (1.6°F) above the true air temperature by a combination of high solar radiation (coming both directly from the sun and also reflected from the underlying ice surface) and low wind speed. (Second-highest Antarctic (continent) temperature verified WMO, no date)
Establishing a “true air temperature” in Antarctica – however the continent is defined – clearly can be a challenge. If one automatic weather station reading can be reduced – “adjusted downwards” – after a “detailed discussion” due to the probability of “solar radiation bias”, then what is the reliability of other station readings?
One item that ought to be on the committee’s agenda is a ten-minute video uploaded on February 9, 2020: Climate Alarmists fleeing to Antarctica. As author Tony Heller demonstrates, with winter and the (temporary) collapse of Arctic melting hysteria, climate alarmists have flown south to the other pole. Let’s hope none of them ended up at Esperanza Base and the Thwaites Glacier.
This article was published in Australia at Quadrant Online on February 18, 2020
Michael Kile 18 February 2020
A map of Esperanza’s location is helpful:
Esperanza: Hope – I wonder what they are hoping for?
Greg Woods February 18, 2020 at 9:14 am
Esperanza: Hope – I wonder what they are hoping for?
– They hope for fleeing Spanish poverty –
https://www.google.com/search?q=spain+poverty+rate&oq=Spain+pover&aqs=chrome.
Good posting, Michael. The Esperanza station is located on a strangely bare sector of the western peninsula near its northern terminus, in other words, the northernmost land of Antarctica. Just SE of the camp are retreating ice cliffs around 5 meters high, it appears that some factor las locally melted a zone now occupied by Esperanza. Just to the south of the camp, crossing some ice fields, is an obvious cinder cone volcanic field. Some of the cones even have circular ice melted moats around them. Yesterday the local newspaper (online, http://www.losandes.com.ar) stated that the temperature had just gone over 20 deg C at Esperanza. We should wait for a forensic examination of this whole deal before starting the 10 year doomsday clock.
The bare rock is probably due to föhn and rain/snow shadow. There are several similar areas on the eastern side of the peninsula.
And while there are several active or recently active volcanoes around the northern Peninsula none is eally close to Esperanza:
tty, go to the conical island located 40 km SW of Esperanza, at 63 deg 40 min 29.94 sec S and 57 deg 42min 20.26sec W. The conical island rises directly 300 meters above sea level at angle of repose, and it has a younger crater on the NE coast. The strange thing is the annular melted zone surrounding the island, I saw nothing like this around any of the other islands nearby. Looks like a cinder cone to me, but not for sure.
NH places on about the same northern latitude as Esperanza is south.
Helsinki, Finland
Oslo, Norway
Shetland Islands, UK.
St Petersburg Russia
Anchorage, Alaska
Hudson Bay
The most southern tip of Greenland
Trondheim would likely be most accurate..
The figures that leap off the page here are the average summer and average winter temperatures at Esperanza.
Between 3.7 C and 4.3 C in Summer and between -2C and – 1.2C in Winter.
And no one at the WMO thought it was rather curious that a “record reading” of 18.3 C suddenly emerged.
Can we make sure that there is follow through on the WMO “ investigation” into the tentative finding on the record and the ‘foehn’ event.
Which reminds me, OT, how is Michael Mann’s Appeal against the Judgement by Default given by the British Columbia Superior Court in favour of Dr. Tim Ball going.
Sometimes these things fall through the cracks.
https://upload.wikimedia.org/wikipedia/commons/c/c0/Antarctica.svg
In this map (and all maps created since Al Gore made Larsen “B” a star in his movie) the Antarctic Peninsula is rendered as devoid of ice shelves Larsen “A” and Larsen “B”.
But this unredacted* satellite image from March 23, 2013 shows intact, fully formed, and well landed, ice shelves Larsen “A” and “B” (*- you rarely see a photo well placed to feature the Peninsula in a comprehensible way, or when you do it’s close cropped to hide the ‘sea ice’. Straight photoshop jobbed to remove information.)
Larsen “A” is Ice Station Esperanza’s front porch, so to speak. I mean if you want to go through the minutia, hour by hour temperature records of Esperanza, you can prove conclusively that their foehn wind event lasted two or three hours tops at an odd point in the day, but if you want to beat down the climatura, I mean really beat them with an ugly reality bat so they don’t get up again, LARSEN “A” &”B”.
That’s climate. That’s using their most famous bovine excrement artist against them. That’s a message that will stick to the public’s ribs.
You are confusing “fast ice” with “ice shelf”. They look much alike from above, but are very different things.
“Fast ice” is ordinary sea ice that has frozen into a continuous ice cover. It consists of ice up to a few meters thick. It mostly (but not always) breaks up each summer.
An ice shelf is floating glacier ice that has come from glaciers ashore. It is typically about 200 meters thick. It is normally stable over fairly long intervals (decades to millenia).
There is a rare intermediate variety, where fast ice has lasted for a very long time and has grown to become tens of meters thick. It is sometime called “paleocrystic” ice. This is found in a few places in the Arctic, but not in the Antarctic as far as I know.
No. I’m not really all that confused. “Fast ice” is shorthand for “landfast” ice, or shore-fast ice. It means sea ice that is “fastened” to the coastline, so there is no wiggle room between “Fast ice” and “Ice shelf”. It’s the same thing.
There is a difference between “Pack ice” and “Fast ice”. It’s that line demarking the ice that’s floating on the ocean, and the ice that is attached to the coast like a shelf.
(Highlighted in this picture)
“there is no wiggle room between “Fast ice” and “Ice shelf”. It’s the same thing.”
It is not, as I have already explained. This time I will cite Wikipedia (which is in this case correct, except that there is to my knowledge no ice shelf in the Russian Arctic):
“An ice shelf is a large floating platform of ice that forms where a glacier or ice sheet flows down to a coastline and onto the ocean surface. Ice shelves are only found in Antarctica, Greenland, Canada, and the Russian Arctic. The boundary between the floating ice shelf and the anchor ice (resting on bedrock) that feeds it is called the grounding line. The thickness of ice shelves can range from about 100 m (330 ft) to 1,000 m (3,300 ft).
In contrast, sea ice is formed on water, is much thinner (typically less than 3 m (9.8 ft)), and forms throughout the Arctic Ocean. It also is found in the Southern Ocean around the continent of Antarctica.”
By the way, by your definition the Great Lakes are covered by ice shelves in cold winters.
Russian Arctic Shelf ice:
https://www.tandfonline.com/doi/pdf/10.1080/15230430.2001.12003424
BR
MFKBoulder
That is a rather marginal case. An ice shelf is normally contiguous, but what we have in the Matusevich fjord seems to be a number of large tabular icebergs that are trapped by a shallow sill at the fjord mouth. Look at figure 3.
Now it’s sea ice, adding to the “fast ice”, “pack ice”, “sea ice”, kabuki.
Anyhow, here’s another satellite image of the Antarctic Peninsula (this from 2011) clearly showing the multi-year, 1000 ~ meter high, Larsen “A”, and Larsen “B” Ice Shelves, “miraculously” reconstituted.
And here you can see them miraculously gone again, just two weeks ago:
https://worldview.earthdata.nasa.gov/?v=-2767990.833337191,1220914.1072622172,-2068598.833337191,1557298.1072622172&p=antarctic&t=2020-02-07-T17%3A02%3A01Z
Nonsense. I see you’re still struggling with the “pack ice” vs “fast ice” definitions, so I’m going to help you out. Same picture you just posted with the Larsen ice shelves outlined and labeled.
http://disq.us/p/27fb7ox
Man. Look at all that ice. In the middle of summer, and there’s no way the Weddell Sea is passable.
The trick is to look for polynyas. The katabatic winds (nice word “katabatic”) blow the pack ice away from the ice shelves. That’s how you tell the difference.
Nice picture. Thanks for hunting it down.
Link does not work.
Try this one.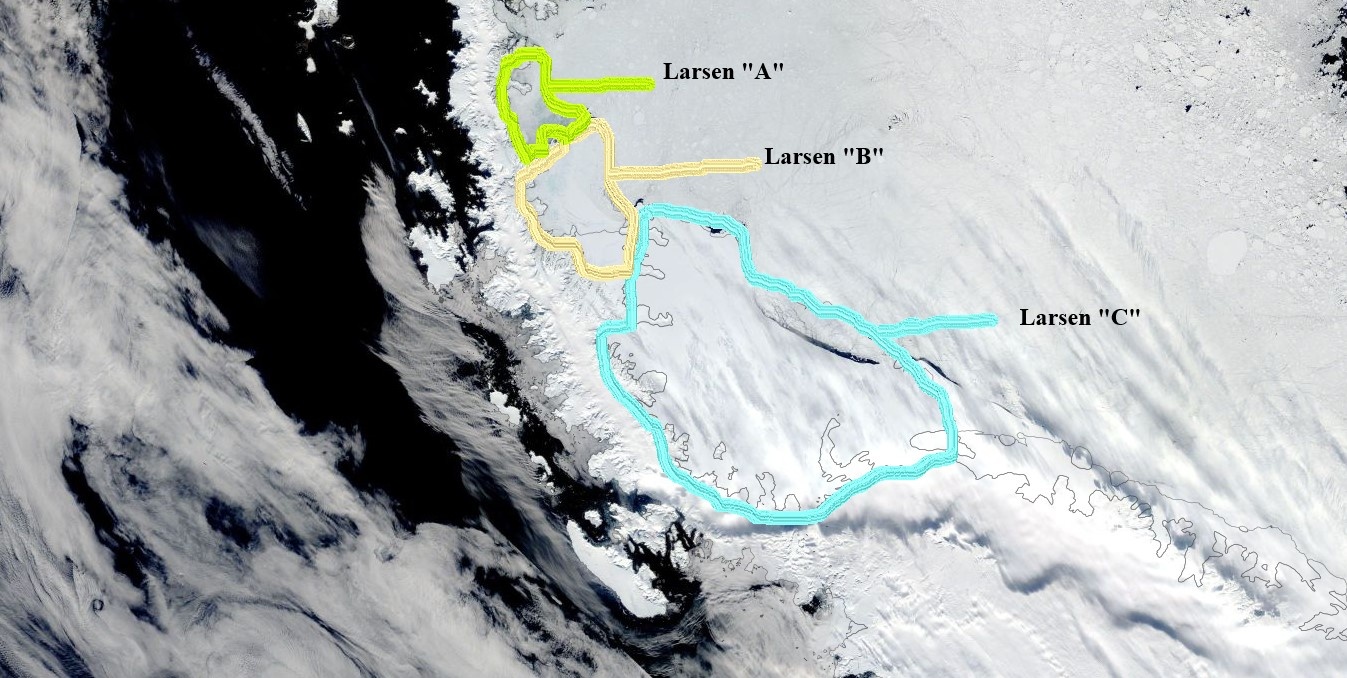
Great post. Thanks. Would like share some of my Antarctica Posts that are directly relevant to this very extensive post on wuwt.
1. Esperanza
https://tambonthongchai.com/2020/02/08/antarctica-hottest-ever/
2. Thwaites Glacier
https://tambonthongchai.com/2020/02/09/antarctica-threatens-florida/
3. Pine Island Glacier
https://tambonthongchai.com/2010/06/23/282/
Brother you go in deep. Any one of those three would make a worthy addition to the WUWT front page.
Well done.
P.S. What do you think of Larsen A and B being thousands of years old prior to collapse, given the volcanic activity in the region?
“In other words, it was just local weather, not a consequence of so-called dangerous anthropogenic global warming, aka “climate change”.”
No, you’ve got it backwards. It SUPPORTS the global-warming narrative, so therefore it’s “Climate, not weather”. Only the stuff that DOESN’T SUPPORT the narrative is “weather, not climate”.
I hope this cleared-up any confusion on the topic. /sarc
Yellowknife airport in Canada is about the same distance north of the equator as Esperanza Base is south of the equator. Yellowknife’s average January temperature is -26 degrees C and its average July temperature is +17 degrees C. There is nothing remarkable about the summer temperature reported from Esperanza Base.
Yellowknife isn’t surrounded by ocean, so not really a good comparison. The proximity of ocean would explain the narrow temp range as well, I would think.
The proximity of ocean to Esperanza, that is.
You are way off there. Yellowknife has a continental climate, Esperanza an highly maritime one.
The Pribiloff Islands on the other hand would be rather a good match climatically. Record high there is +19 C.
This is a very good post, Mr. Kile. I particularly like the fact that you led with the coordinates of Esperanza, since I had a feel for northern hemisphere equivalents (Iceland, Sweden, Norway, and Alaska US came to mind), as it did to fred250 and I’m sure many other readers. The first thing I did was go to my globe to get a real perspective.
What really leaped out to me was Fairbanks, Alaska, 64° 50′ 37″ N, 147° 43′ 23″ W. It’s obviously closer to the Arctic Circle than Esperanza is to the Antarctic. By contrast, it is nowhere near an ocean – further away, in fact, than Las Vegas, Nevada is from the Pacific. The record high temperature in Fairbanks was 99 F (37 C) on July 28, 1919. Even if there has been a record set in Esperanza (and WMO was right to question it), I can’t see it being that unusual.
I do not recall if I pulled my globe off the shelf or looked up the data from Esparanza first, but as soon as I looked at that location, the very next thing I did was look to see where an equivalent location is in the northern hemisphere, and quickly focused on the capital of Iceland.
Which is north, yes.
Arctic?
No, definitely not.
I also looked at Fairbanks, but realized most people probably do not have a good idea of exactly where in Alaska Fairbanks is.
And Fairbanks is very cold in Winter because it is inland, although for this same reason it can be very warm in Summer.
I have another globe, a spinning one that floats in the air between two magnets.
From a normal perspective, it is hard to even see Antarctica or the Arctic.
It is on a mantle above my desk, and glancing up at it now…I can see the place where Esparanza is, and also just barely see Iceland and the southern tip of Greenland.
The relative size of the polar regions is not at all clear on most maps.
Compared to the tropics…they are tiny.
Each region is about 4″ of the globe.
The area between the Tropics of Cancer and Capricorn, on the other hand, is about 40% of the globe.
Sorry, that should say each polar region, the part of the planet polar of the Arctic and Antarctic circles, is about 4% of the globe.
What’s a globe? Is that some window in Google Earth Pro?
Almost, except it is the Luddite version.
They are checking for records!!! it’s a conspiracy
They never double check records!!! it’s a conspiracy
The cool thing about conspiracy thinking is it is never falsifiable.
I only bring this up because I am part of the conspiracy
which just proves, its a conspiracy
No Steve you are just a typical non arts person with an arts degree trying to eek out a living outside a McDonalds franchise … would like chips with that?
Graffito by the bog roll in my training establishment.
Arts degree, please take one.
LdB
its “would you like fries with that”
Search term “record high temp antarctica”
355 million results
(for comparison) “Trump impeachment”
131 million results
About three times as much promotion for this 6 A.M. foahn event of about an hour duration, than for an organized political attack lasting 28 months or more.
I’m sure we’re just imagining that crap, huh Mosher?
The only thing you got right is that you are part of it.
How much they pay you to stab the entire human race in the back? Just curious.
When did steve finally lose what’s left of his mind?
Pointing out problems with a particular record is not a conspiracy theory.
One can always tell when steve has nothing intelligent to say.
MarkW
You said, “One can always tell when steve has nothing intelligent to say.” That was such a great lead-in that I was tempted. However, I decided to pass. 🙂
Mosher, as usual, misses the point.
This was played up in the media as “Antarctica is melting! Run for your lives!”, when it’s nothing but an anomaly at a SINGLE point on the globe.
Mosher knows this, of course, but uses any excuse to stop by and look down his nose at people he thinks are beneath him. Typical. I guess he never learns from all the smackdowns given to him by Willis.
This is one of the on the dole alarmist troll’s biggest tells, they never ever ever ever speak against the alarm. Too much money at stake.
Mosher’s childish attempt at straw men is as failed as the fraudulent alarmists number fudging.
All I need to show conspiracy is the actual words the alarmists use to describe their conspiracy…
“We need to get some broad based support,
to capture the public’s imagination…
So we have to offer up scary scenarios,
make simplified, dramatic statements
and make little mention of any doubts…
Each of us has to decide what the right balance
is between being effective and being honest.”
– Prof. Stephen Schneider,
Stanford Professor of Climatology, lead author of many IPCC reports
~~~~~~~~~~~~~~~~~~~~~~~~~~~~~~~~~~~~~~~~~~~~~~~
“We’ve got to ride this global warming issue.
Even if the theory of global warming is wrong,
we will be doing the right thing in terms of
economic and environmental policy.”
– Timothy Wirth, President of the UN Foundation
~~~~~~~~~~~~~~~~~~~~~~~~~~~~~~~~~~~~~~~~~~~~~~~
“No matter if the science of global warming is all phony…
climate change provides the greatest opportunity to
bring about justice and equality in the world.”
– Christine Stewart, former Canadian Minister of the Environment
~~~~~~~~~~~~~~~~~~~~~~~~~~~~~~~~~~~~~~~~~~~~~~~
“The data doesn’t matter. We’re not basing our recommendations
on the data. We’re basing them on the climate models.
– Prof. Chris Folland, Hadley Centre for Climate Prediction and Research
~~~~~~~~~~~~~~~~~~~~~~~~~~~~~~~~~~~~~~~~~~~~~~~
“The models are convenient fictions
that provide something very useful.”
– Dr David Frame, climate modeler, Oxford University
~~~~~~~~~~~~~~~~~~~~~~~~~~~~~~~~~~~~~~~~~~~~~~~
“I believe it is appropriate to have an ‘over-representation’ of the facts
on how dangerous it is, as a predicate for opening up the audience.”
– Al Gore,
Climate Change activist
~~~~~~~~~~~~~~~~~~~~~~~~~~~~~~~~~~~~~~~~~~~~~~~
“It doesn’t matter what is true,
it only matters what people believe is true.”
– Paul Watson, co-founder of Greenpeace
~~~~~~~~~~~~~~~~~~~~~~~~~~~~~~~~~~~~~~~~~~~~~~~
<i."The only way to get our society to truly change is to
frighten people with the possibility of a catastrophe.”
– emeritus professor Daniel Botkin
~~~~~~~~~~~~~~~~~~~~~~~~~~~~~~~~~~~~~~~~~~~~~~~
“Effective execution of Agenda 21 will require a profound
reorientation of all human society, unlike anything the world
has ever experienced a major shift in the priorities of both
governments and individuals and an unprecedented
redeployment of human and financial resources. This shift
will demand that a concern for the environmental consequences
of every human action be integrated into individual and
collective decision-making at every level.”
– UN Agenda 21
Then of course we have this…
“I can’t see either of these papers being in the next IPCC report. Kevin and I will keep them out somehow — even if we have to redefine what the peer‐review literature is!”
-Philip Douglas Jones, Director of the Climatic Research Unit, Professor in the School of Environmental Sciences at the University of East Anglia
So yeah Mosher, it is a conspiracy. You guys already confirmed this, so stop lying.
Is it possible that some enterprising climate “scientists” might have latched on to a trick and are actively seeking to place weather stations at locations predicted to be influenced by a Foehn Effect? Surely no-one would be that mischievous.
Drew
Now, that is a real “conspiracy theory!”
Stupid question: what is that second thermometer showing 10° doing on the same picture?
Is it a joke or IQ test?
Dew point. That thermometer’s bulb is kept wet.
Relative humidity is then calculated using a chart.
18C dry, 9C wet indicates about 55 percent RH.
And that is very VERY low for a hypermaritime arctic climate like at Esperanza and rather tells all you need to know. Föhn!
I took the joke and made 145 points!
Apart from the fake news, the question should rather be on why Antarctica is not warming at all. Given the very low temperatures, the elevation of the ice shield (2.000 – 3.000m above sea level) vapour as a GHG only plays a tiny role there. Accordingly CO2 should have a much more prominent role to play and Antarctica would have to react very sensitive to any CO2 induced “global warming”. Yet, it defies all warming trends visible else where.
And I guess the reason is, “global warming” is not caused by CO2 at all, but by contrails. Next to the fact, that contrails indeed must cause warming, while CO2 cannot, this explanation is perfectly in line with the “when”, the “where” and the “how” of global warming. And the CO2 hypothesis is not!
More CO2 is as a matter of fact has a net cooling effect in inland East Antarctica. Since there is a permanent temperature inversion there, more CO2 means that there will be more not less radiative heat loss, since the radiation will come from higher altitudes with higher temperatures. The link below has satellite IR spectra from Sahara (top), The Mediterranean (middle) and Antarctica (bottom):
Notice that the “valleys” in the top two ones are “bumps” in the bottom one, i. e. there is more heat loss in the GHG frequency bands, not less.
This effect is well known to atmosphere physicists but is almost never mentioned.
No, I see no foundation to your claim..
https://www.researchgate.net/figure/Average-air-temperature-profiles-for-the-Antarctic-and-Arctic-regions-from-the-coupled_fig10_317044987
There are none so blind as those who will not see.
Try this:
https://agupubs.onlinelibrary.wiley.com/doi/full/10.1002/2015GL066749
Fun fact: this paper suggests due to CO2 the surface of Antarctica would now receive more “back radiation”, which should cool it…
I would consider this a ridiculous attempt to safe a failing theory.
This has been obvious since Nimbus satellite started measuring IR flux back in the sixties.
If all the ice around Esperanza were to melt, it might raise global sea levels by what, half a micron?
I wish people would stop harping on volcanoes in this context, they only signal their ignorance. Volcanism has minimal direct effect on air temperatures (and even less on sea temperatures). The heat flow is too small to matter in the open air or open sea.
The extensive volcanism/geothermal heat flow in West Antarctica on the other hand is definitely an important (and usually disregarded) factor when it comes to glacial dynamics there. Warm-based glaciers (where the temperature at the glacier base is above the pressure melting point) move much faster and have much flatter profiles than cold-based glaciers.
If the mean monthly temperature in July, the coldest month, is -10.5 C, and +1.4 C in January, the warmest month, that’s only a difference of 11.9 C (21.4 F) between the warmest and coldest month, which is extraordinarily stable for a location that gets about three hours of daylight at the winter solstice and 21 hours at the summer solstice. The small climatic difference between summer and winter is probably due to the fact that the northern end of the Antarctic Peninsula is the only land at that latitude in the world, and the surrounding ocean (and the circumpolar current) with its high heat capacity tends to maintain a nearly constant temperature despite the sharp seasonal variation in solar radiation.
The location of the Esperanza settlement was probably chosen because it is relatively sheltered from the strong westerly winds that normally sweep that latitude, and sometimes benefits from a foehn effect. By the way, when that temperature record of 18.3 C was recorded in Esperanza, what was the temperature on the west shore of the peninsula? Probably a lot less…
If the wet bulb temperature was only 10.0 C, that corresponds to a relative humidity of about 30%, which would be unusually dry for a location along a cool ocean in summer. This probably confirms the foehn effect, where whatever moisture might have been in the air precipitated out over the mountains, and the remaining drier air was compressed and warmed by downsloping winds.
The previous record was set on March 24, which would have been shortly after the autumnal equinox. At 63+ degrees south latitude, the noonday sun would only be about 26 degrees above the horizon on that day, and there would be about 12 hours of daylight, so are we supposed to believe that CO2 trapped the heat of the sun to cause that temperature record?
Of course, it is extremely misleading to conflate a record high temperature on the northernmost extremity of the Antarctic Peninsula with a warming of the continent of Antarctica. It’s equivalent to citing a record high temperature in Key West, Florida to claim that the entire United States is warming.
Yes, this area has a quite maritime climate, much more typical of Southern Ocean islands than of Antarctica proper.
Which means storms, sleet, fog or snow most of the time.
Regarding “despite recent research suggesting a cooling trend since the year 2000, contradicting the carbon dioxide-driven global warming scare.” The part of Antarctica where Esperanza is, the Antarctica Peninsula, has a warming trend since the start of the UAH TLT record and since the start of its first full year (1979). Using the start date of 2000 sounds to me like cherrypicking. The study linked in the referenced WUWT article considers only 2000-2014 for statement of a cooling trend, which largely coincides with the global pause of global warming. For that matter, the UAH TLT trend for south polar land, which at least largely equates to the continent of Antarctica, has its trend from December 1978 to January 2020 being warming at the rate of .10 degree/decade.
Than any other base in the neighborhood would have had the same weather extreme?
just 45 km away
http://ivs.bkg.bund.de/vlbi/ohiggins/
Meteo-Daten 02 2020
This is the most “densely populated” part of Antarctica. There are nearly a dozen bases nearby, but probably none that would be affected by Föhn, so they would be considerably colder.
Try weather for “Marambio”, “O’Higgins”, “Machu Picchu”, “Arctowski”, “Gabriel de Castilla”, “Antarctic Great Wall”, “Artigas”, “Presidente Eduardo Frei”, “Yelcho”, “Palmer Station” or “Port Lockroy”
Than the whole northern Antarctic Peninsula can be affected.
https://earth.nullschool.net/#2020/02/05/2300Z/wind/isobaric/1000hPa/overlay=temp/orthographic=-61.21,-69.92,1979/loc=-64.818,-66.577
Perhaps you should have used “SFC” (Surface) instead of the 1000 hPa level which happens to be well below ground level for most of the affected area.
Using your method the temperature in Tibet is currently +25 C and the Andean Altiplano is is well over +40 C.
So, no, all of West Antarctica was not above freezing on Feb 5.
This place is 1000 miles closer to the Falklands than it is to the South Pole. It’s only 200 miles further away from Buenos Aires than it is from the South Pole.
Yep… that’s *certainly* a proxy for Antarctica.
From WMO February 7 2020 media release:
“the record for the Antarctic region – that is, everywhere south of 60 degrees latitude – is 19.8C, taken on Signy Island in January 1982.”
A surprise, surely, that this “record” apparently was not analysed in detail until 2017 in the Atmospheric Science Letters paper, 35 years later. Why did it take so long?
That’s like using Key West temperatures as the proverbial “canary in a coal mine” for Continental North America; or Aleutian Islands or Dutch Harbor.
Curious ever curiouser the extents alarmists goto in screeching new records.